


Francesca Hong, a candidate for the Democratic nomination for Governor of Wisconsin in 2026, lost her primary race last night by less than half of one percentage point. In absolute terms, her performance should be impressive; a Democratic Socialist who years ago said Thanksgiving should be canceled and was outspent by a ratio of 15-to-1, according to media tracking firm Cross Screen Media, came within half a point of securing the nomination for governor of America’s 21st most populous state, and a key political battleground.
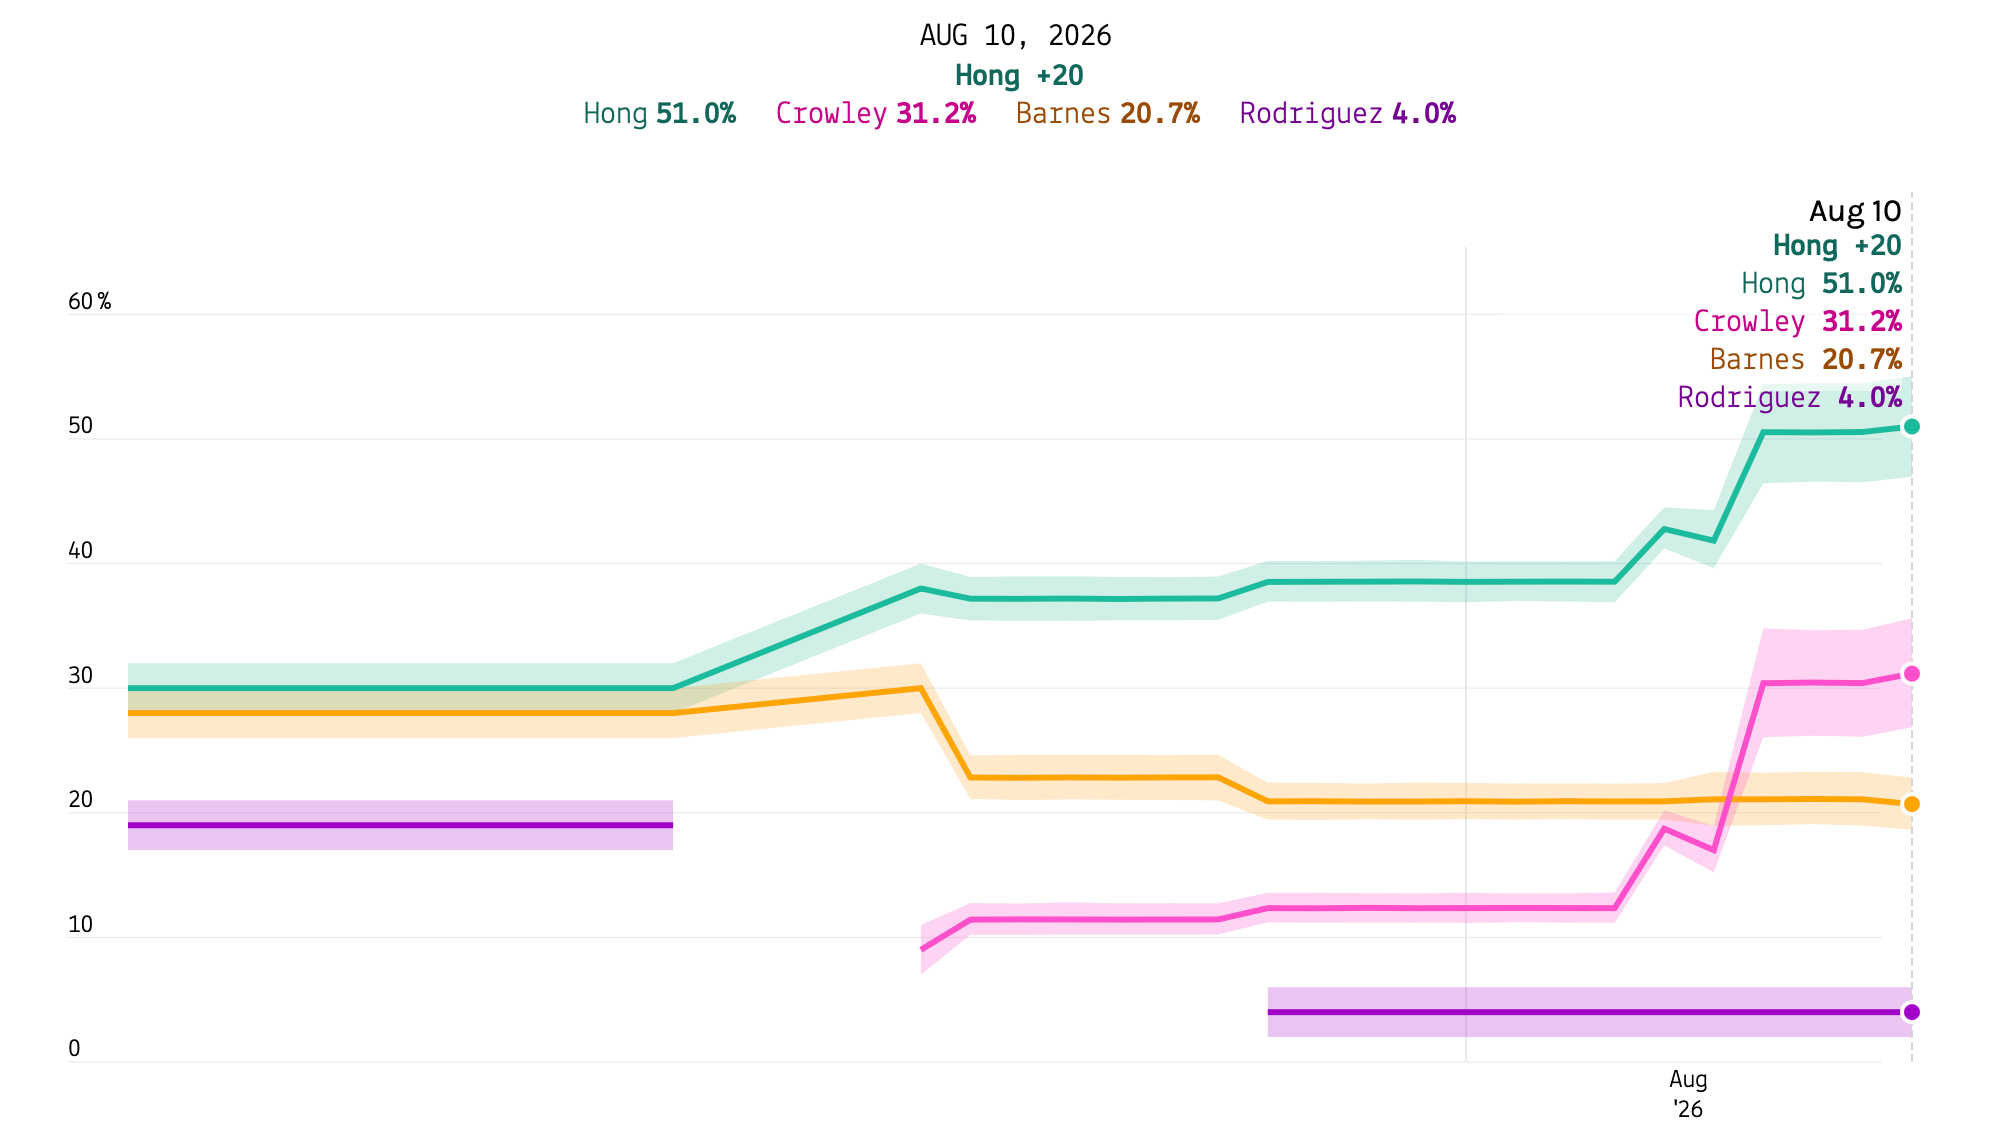
But graded against the polls, Hong disappointed. Our average of polls at FiftyPlusOne had Hong 20 points ahead of the competition Tuesday morning, with about 20% of the electorate left undecided:
The difference between expectations and reality prompted the New York Times to call Hong’s defeat versus challenger David Crowley a “stunning loss” for the left:
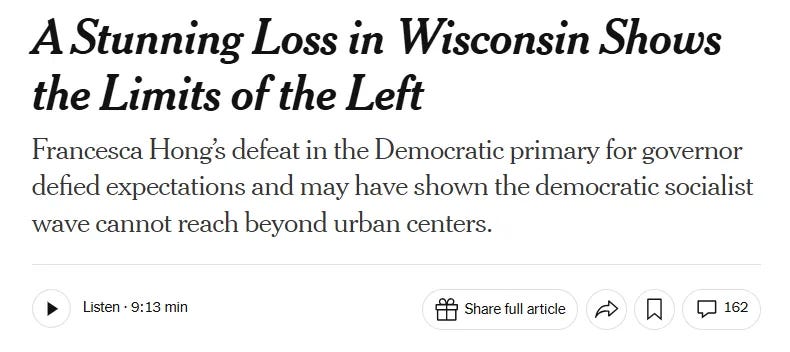
So the polls are causing not just high expectations for the left, but also journalists to react to world events in weird ways — grading candidates by their performance relative to the polls, not their performance in absolute terms.
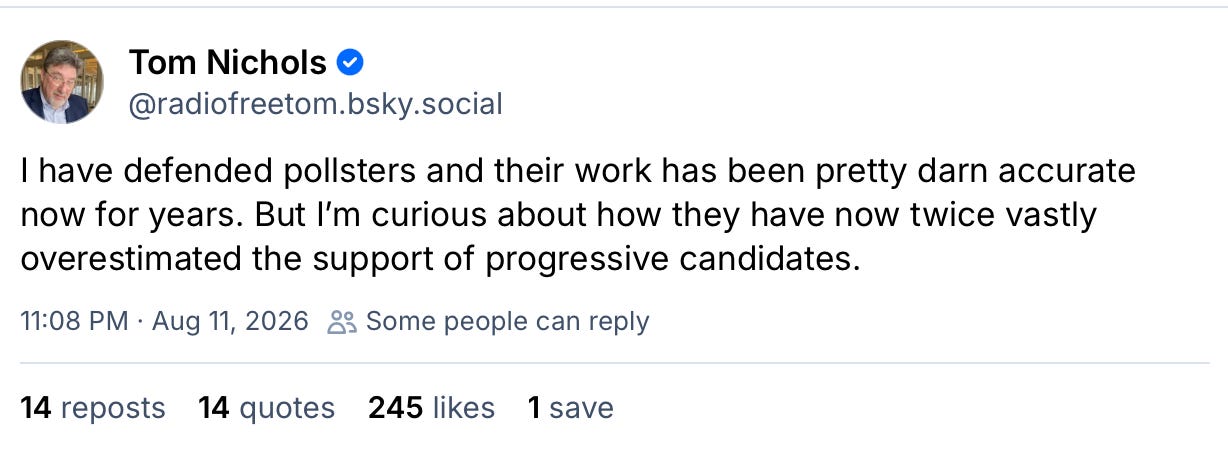
This is the second time this year that polls have overestimated support for a left-leaning candidate in a marquee race. Since the rules of punditry dictate that two is a pattern, Tom Nichols, a conservative writer for The Atlantic, raises the possibility of uniform polling bias in progressives’ favor:
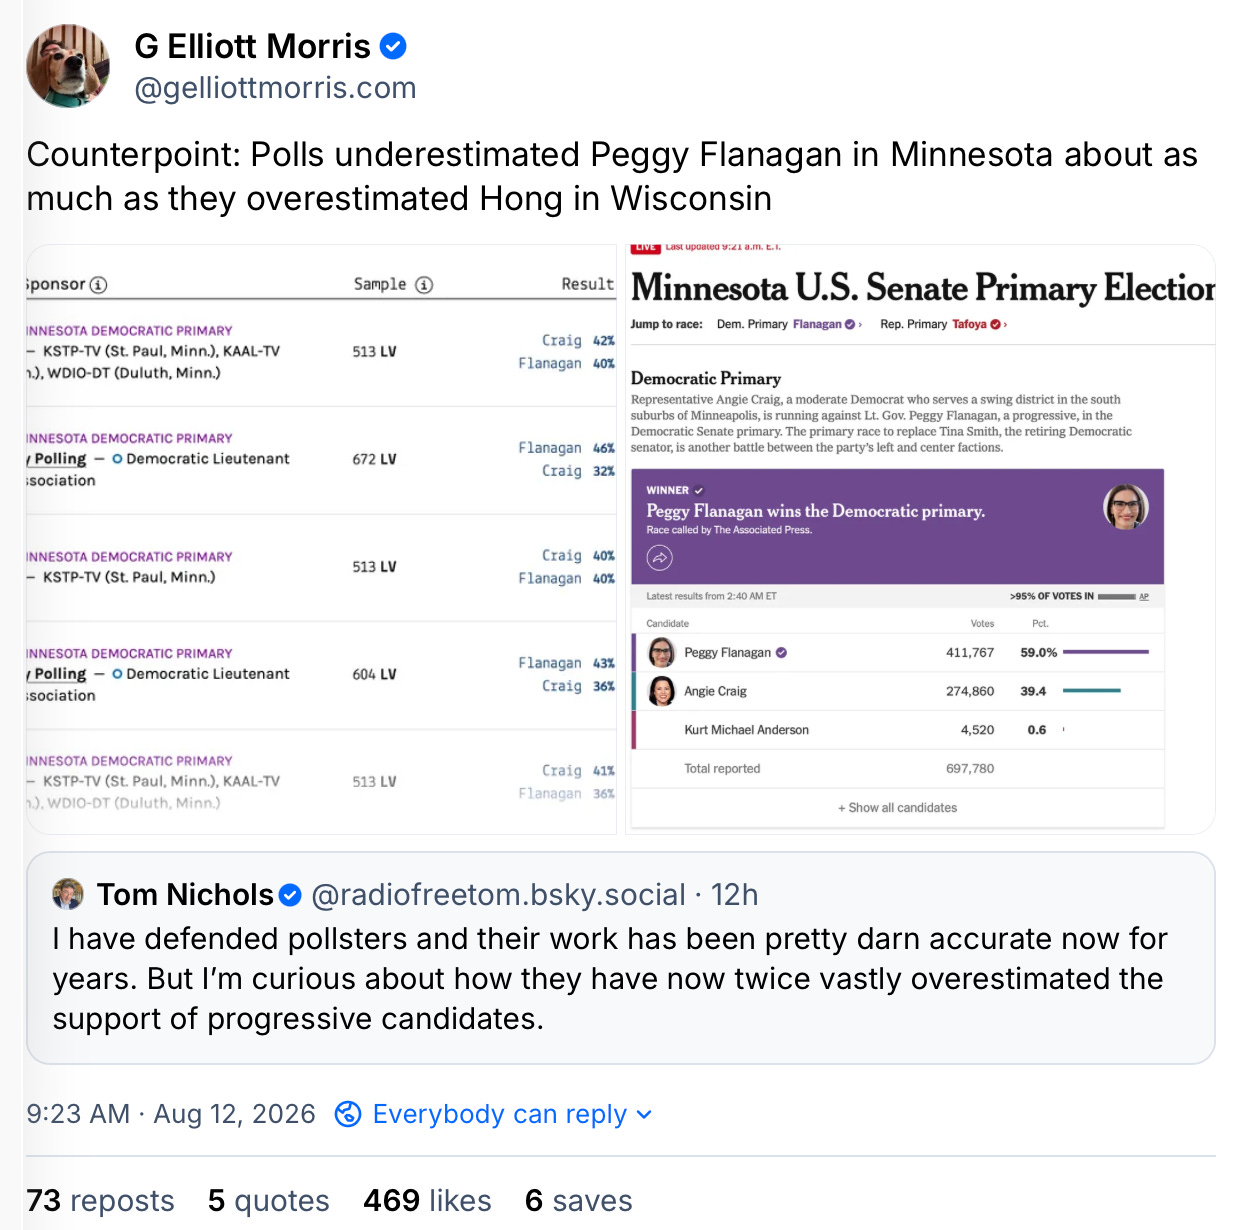
For what it’s worth, this is silly on its face; the same night polls overestimated Hong, they underestimated support for progressive candidate Peggy Flanagan in Minnesota by the same amount:
But Nichols isn’t totally off base. The polls in both Wisconsin and Minnesota last night performed worse than the average primary poll.
Are primary polls just useless? Are all polls so bad that you should just ignore them? Let’s take a quick look at the data.
I would usually paywall an analysis like this, but I am releasing it for the public so readers can have better-informed expectations for the accuracy of primary polls in the future.
If you learned something from this, please consider upgrading your subscription to a paid membership to make sure I can continue publishing analysis like this in the future. Paying readers make original data journalism like this possible.
Primary election polls are off by 13 points on average — but that number hides some huge misfires
Earlier this year I wrote up a historical study of the accuracy of primary polls that I conducted with my colleague Mary Radcliffe at FiftyPlusOne. We concluded then that primary election polls for Senate and Governor elections in 2014, 2016, and 2024 (years where we had the most complete data) had an expected error of about 13 points on average in the difference between the margin for the top two candidates:
On the margin between the top two candidates — which is what we really care about in plurality races, like the Democratic primary in Texas — the numbers are even worse. The expected error on the margin between two primary candidates in a race for governor or U.S. Senate is a whopping 13.0 points. And in our historical data, polls picked the wrong winner for competitive primary races (those where the margin between candidates in polls was less than 10 points) in 2 out of every 10 elections. So both Crockett’s 3-point edge and Paxton’s 3-point advantage are well within the historical predictive margin of error for Senate primary polls.
But the average also obscures some truly enormous misses. In the crowded 2024 Nevada Republican Senate primary, polls had Sam Brown up 18 points on average over the last 3 weeks of the race; he won by 45. In the 2014 Iowa Republican Senate primary, Joni Ernst’s polling lead over her closest competitor was 16 points; she won by 38. And the 2024 Ohio Republican Senate primary polls showed a near-tie between Bernie Moreno and Matt Dolan; Moreno won by 18.
The 2024 cycle was also the least accurate of the three we studied, with an expected error of 16.1 percentage points on the margin of victory between the candidates polling in the top two. The 2014 cycle was the most accurate, at 10.8 points. Neither of these numbers should make you confident in a 3-point lead.
We made the following graph of polling averages for key primaries. Note that on average, polls are right in primaries; they just have a huge spread:
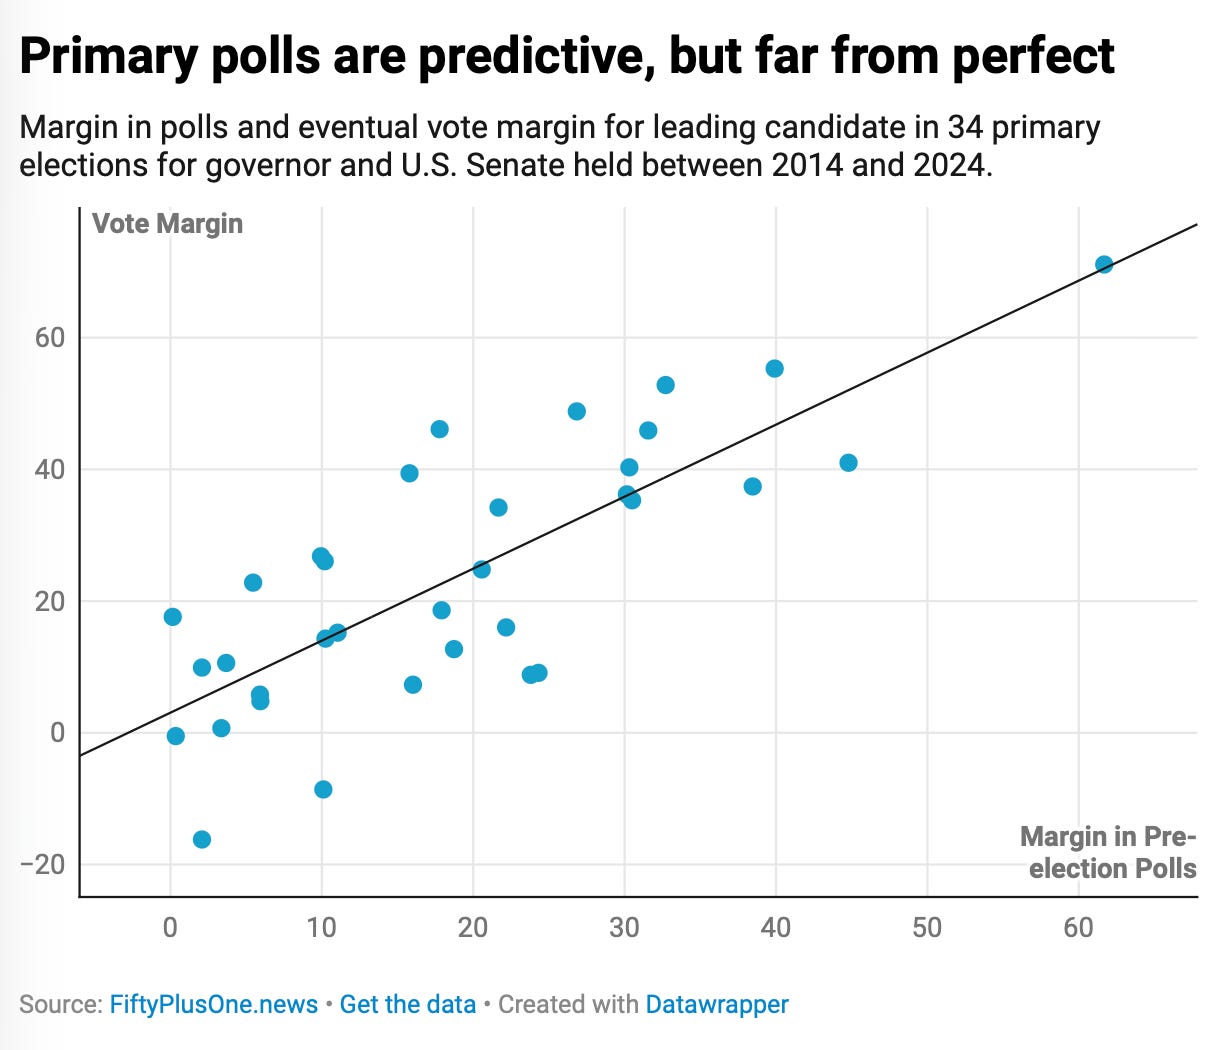
But this chart really doesn’t give you a good look at how off primary polls can be. The following histogram does, showing absolute errors in some cases of more than 30 points!
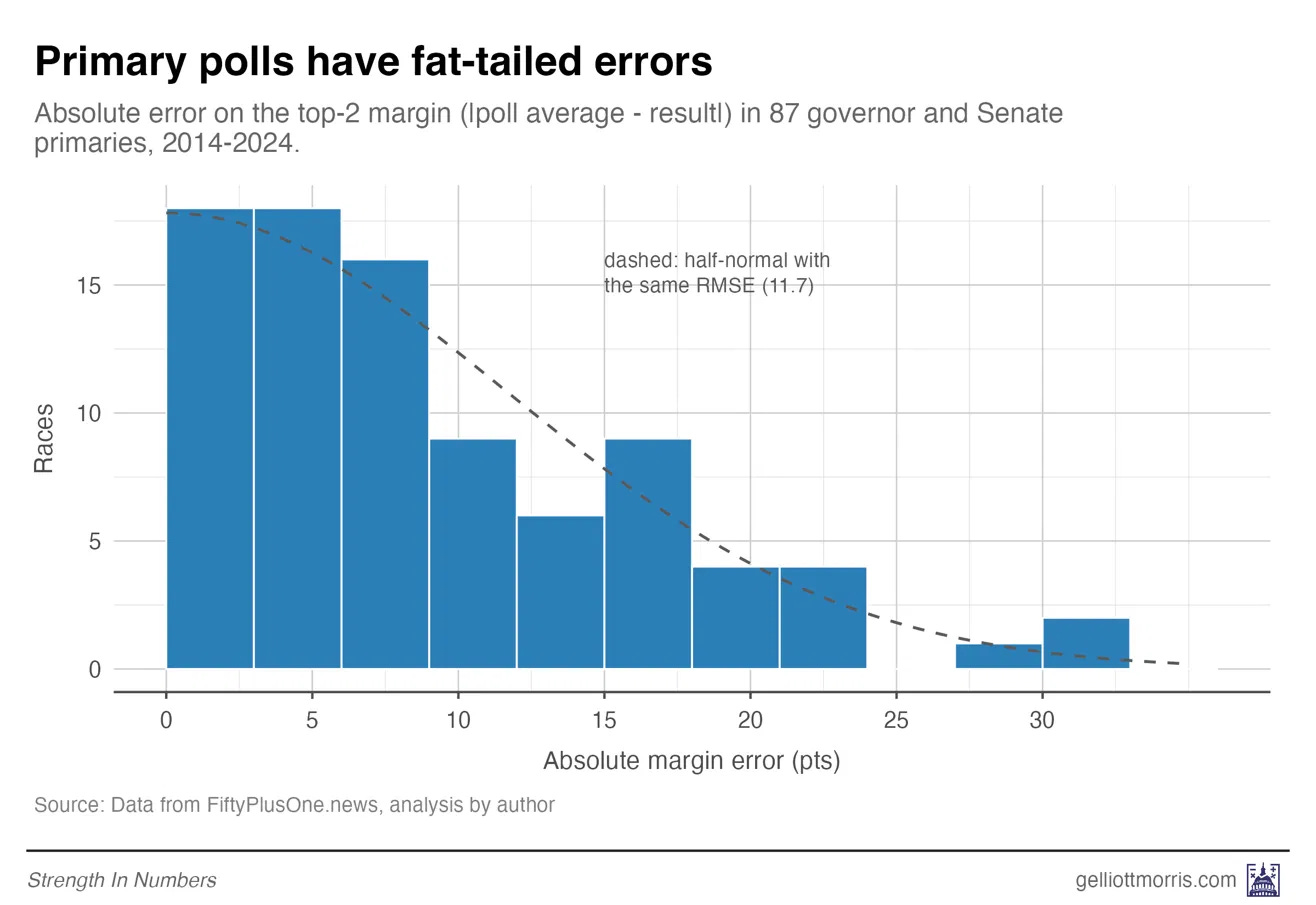
Running the math with this data, a primary candidate that is up by 10 points has a corresponding win probability in their race of only 70%. (In contrast, in general elections, that number would be well above 95%.)
A related question is how often polls miss by as much as they’ve been missing recently. Here’s a table showing the probability of primary election polls being X points off:
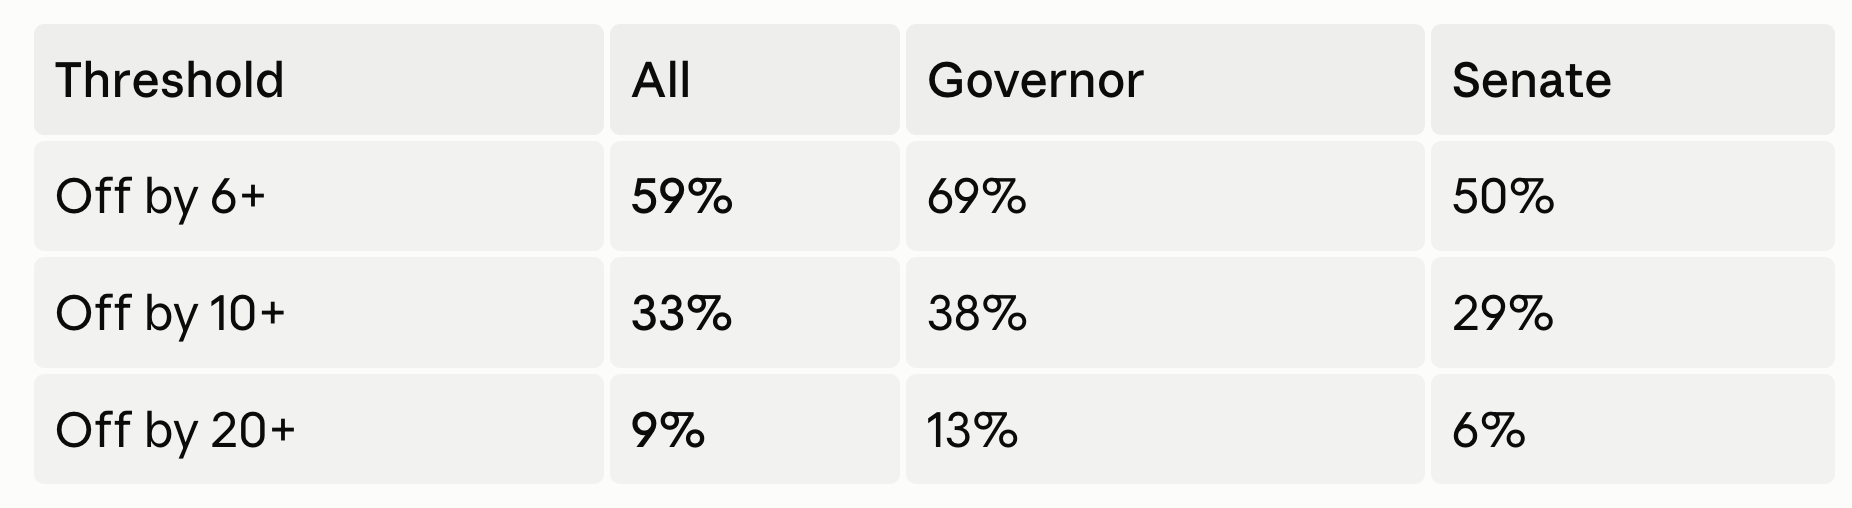
About 10% of the time, primary polls miss the winner’s margin of victory by about 20 points.
(All the data here is from FiftyPlusOne.)
Based on this data, I would recommend taking primary polls seriously but not literally. To put a finer point on that statement: The expectation is that primary polls will be off by about 13 points on average in the difference between the margin for the top two candidates. You should expect them to err, not to provide perfect predictions.
Polling primaries is just really hard
Primary election polls are not general election polls.
As Mary and I wrote:
Part of covering public opinion polls is knowing when they are useful and when they are not. While polls give us good predictions of horse-race contests (especially presidential elections) on average, they are less predictive in primary elections.
This is in part because electoral dynamics can change quickly in primaries (candidates can drop out and endorse others), but also because primary polls are simply harder to conduct. [...] In addition, primary polls tend to have significantly more undecided respondents than general election polls. This all adds up to a lot of uncertainty about the polls ahead [in primary raced]
(Emphasis is mine.)
The primary (hah) problem with primary polls is that pollsters have fewer variables they can use to make sure their polls are representative of the electorate. The response rate to the average poll today is well below 1%, forcing pollsters to make statistical adjustments to their data to try to make it representative of the electorate. This usually means comparing the demographic makeup of a poll to the Census data in a region and giving more weight to the groups that are underrepresented in a sample, and less weight to those that are overrepresented.
These adjustments work well in a general election where the variables pollsters have are highly predictive of election outcomes. Things like race, education, income, past vote, and party identification are very good proxies for how someone will vote in an election between a Democrat and a Republican.
But, as Mary and I wrote, there are fewer highly predictive variables available to weight on in primary elections, where candidate support is more correlated with non-demographic factors like ideology, issue prioritization, beliefs, and electability, and so on.
As the quote shows, other hurdles exist, too. First, it is harder to predict who will turn out to vote in a primary. The population pollsters are trying to represent — people who turn out to vote on Election Day — is an ephemeral group, coming into existence in an instant, not able to be polled precisely ahead of or after the contest. Second, the electorate’s preferences are also formed later and based more on things like media coverage and advertisements — both of which can cause a lot of late change in the race (see: 2026 MI-Sen Democratic primary).
Measurement of preference in a primary election, in summary, is just really, really hard. Expect error, not precision.
So, back to Wisconsin. Was Tuesday night a “stunning loss” for the left?
Only if your baseline was that the polls would be perfect. As this analysis shows, that is not a well-calibrated expectation.
With a proper model of primary polling data, losing while being somewhere at +10 to +20 in polls is somewhere between a 1-in-10 and 1-in-30. That’s rare, but not unthinkable. And it looks like polls actually got Hong’s support pretty close, they just underestimated how well her opponent would do — in an environment with lots of undecided voters and dropouts for other candidates that came very late in the race. This is an argument for even more caution.
The practical takeaway for the rest of the 2026 primary calendar is:
Expect primary polls to be off by 13 points on average. This will help you mentally prepare for misfires. A 10-point lead is roughly a 3-in-4 favorite, not a lock.
Expect a blowout sometimes. With misses of 20+ points striking about once in every ten races, and a dozen contested primaries left this cycle, at least one more “shocking” result is the expected outcome, not a crisis for polling.
Don’t build theories of ideological bias on two data points. Historically, left-leaning candidates do no better versus the polls than centrists or right-leaning candidates. As we saw on Tuesday night, the tails are fat in both directions: Polls in Wisconsin overestimated a progressive by 20 points while polls in Minnesota underestimated one by the same amount. People writing about polling error with a sample size of n=2 are doing punditry, not statistics.
Moreover, I would argue that the failure of the conventional wisdom to see a Hong loss on Tuesday as possible is both a problem of the polls and of the media’s expectations for them. This is the central argument I made in my book, Strength in Numbers: How Polls Work and Why We Need Them: polls are indispensable tools for hearing what the public actually wants, especially between elections, and they can only fulfill that duty if we treat them with the amount of uncertainty they deserve. Attaching false precision to electoral projections sets polls up for failure, which prevents the people from using them to hold leaders accountable when they run afoul of public opinion.
Primary polls are really hard to get right. As such, they come with large margins of error — even when combined. Don’t expect perfection, and you won’t be disappointed.
The NYT was just silly clickbait, not responsible reporting, because it misrepresents what people can expect from polling. The only "stunning" poll failure I can remember was Ann Selzer's last poll, but even in that case, it was an outlier from most polls.
Appreciate you calling out the ridiculous NYTimes headline.