The Democratic image is underwater — but they're not losing
Polls show the party near a 30-year low, yet they’re favored in the House popular vote.
Note number one: Elliott wrote this article. Strength In Numbers contributor and former FiveThirtyEight colleague Mary Radcliffe gathered most of the data and created the polling average visual.
Note number two: This is a newsworthy enough subject that I felt I should push the July Q&A, originally slated for today, later in the week. Look for that in your inboxes tomorrow!
A new poll from the Wall Street Journal has Democrats in a panic. According to the WSJ’s pollsters, 63% of U.S. voters have an unfavorable view of the party — the highest share ever in WSJ polls; meanwhile, only 33% view it favorably.
The Democratic Party's net rating (-30) is 19 points below that of the Republican Party, and the WSJ’s worst-ever gap for Democrats. According to their polls, the party is nearly as unpopular as it was in 2002-2003, when a surge in enthusiasm for Republicans due to 9/11 and the invasions of Afghanistan and Iraq pushed the party to historic highs over the Democrats. And at -19, Democrats are almost as underwater as Republicans were in 1992, after 12 years of GOP rule and 2 recessions (D+30 on net fav).
These are some tough numbers for Democrats. But I think the collective freak-out over this one poll is unwarranted — and in general, I wonder if party favorability is telling us something all that useful or actionable anyway. I read these polls for a living, so when I saw the reaction to the WSJ survey, I had several thoughts about how people should be reacting to these numbers. In this post, I'll detail four things to keep in mind.
Beware outliers
First, it's always good to be aware of outliers. In this case, the WSJ survey may be significantly more pessimistic for Democrats than other polls.
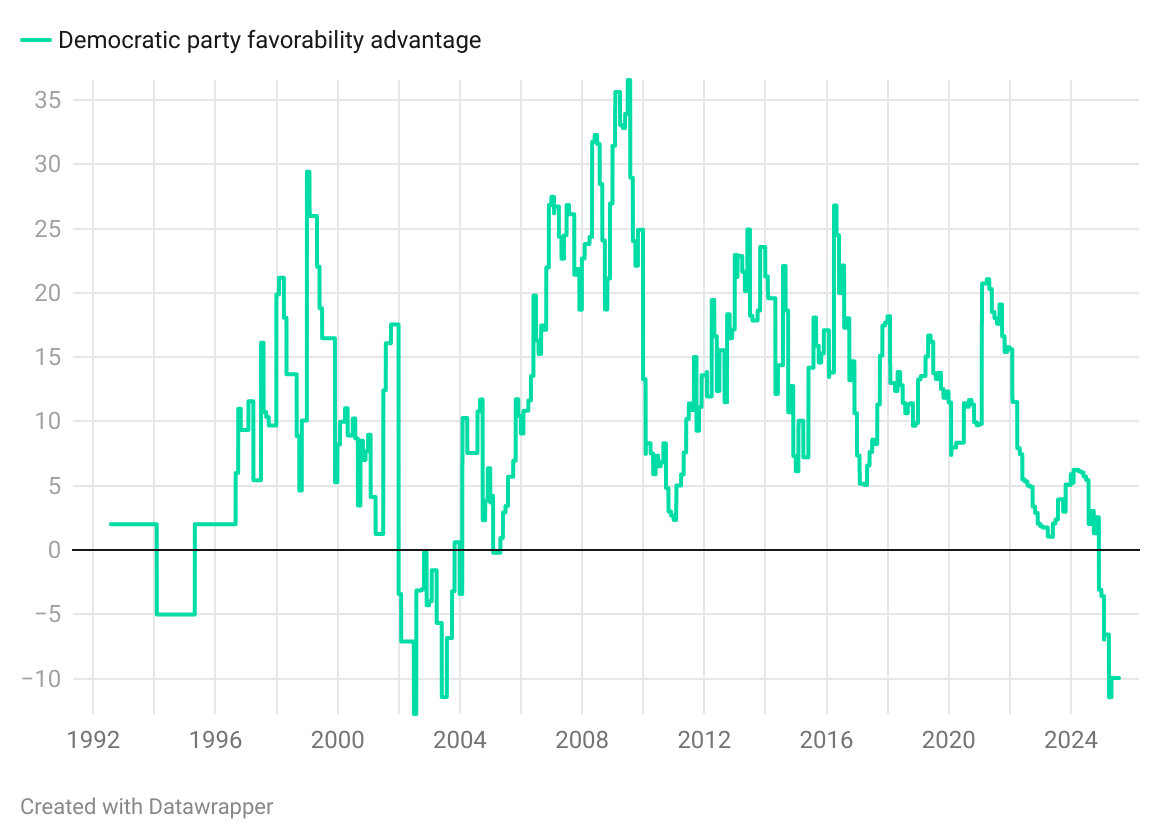
Below, I have calculated a weighted moving average of the difference between the Democratic Party's net favorability rating (% favorable - % unfavorable) and the Republican Party's, going back to 1992. Numbers above zero indicate Democrats have a better net favorability than Republicans; below zero, Republicans lead.
Notice that the general thrust of the story about the Democratic Party is correct. The Dems are at a near low for this century — though the -10 average rating is higher than the Republican Party’s score for most of the time series after 2006.
Then, note that the WSJ's -19 number is a bit of an outlier; the average poll today has the Democrats "just" 10 points behind the Republicans. In fact, the WSJ number is about twice as pessimistic for the Democrats as the average poll.
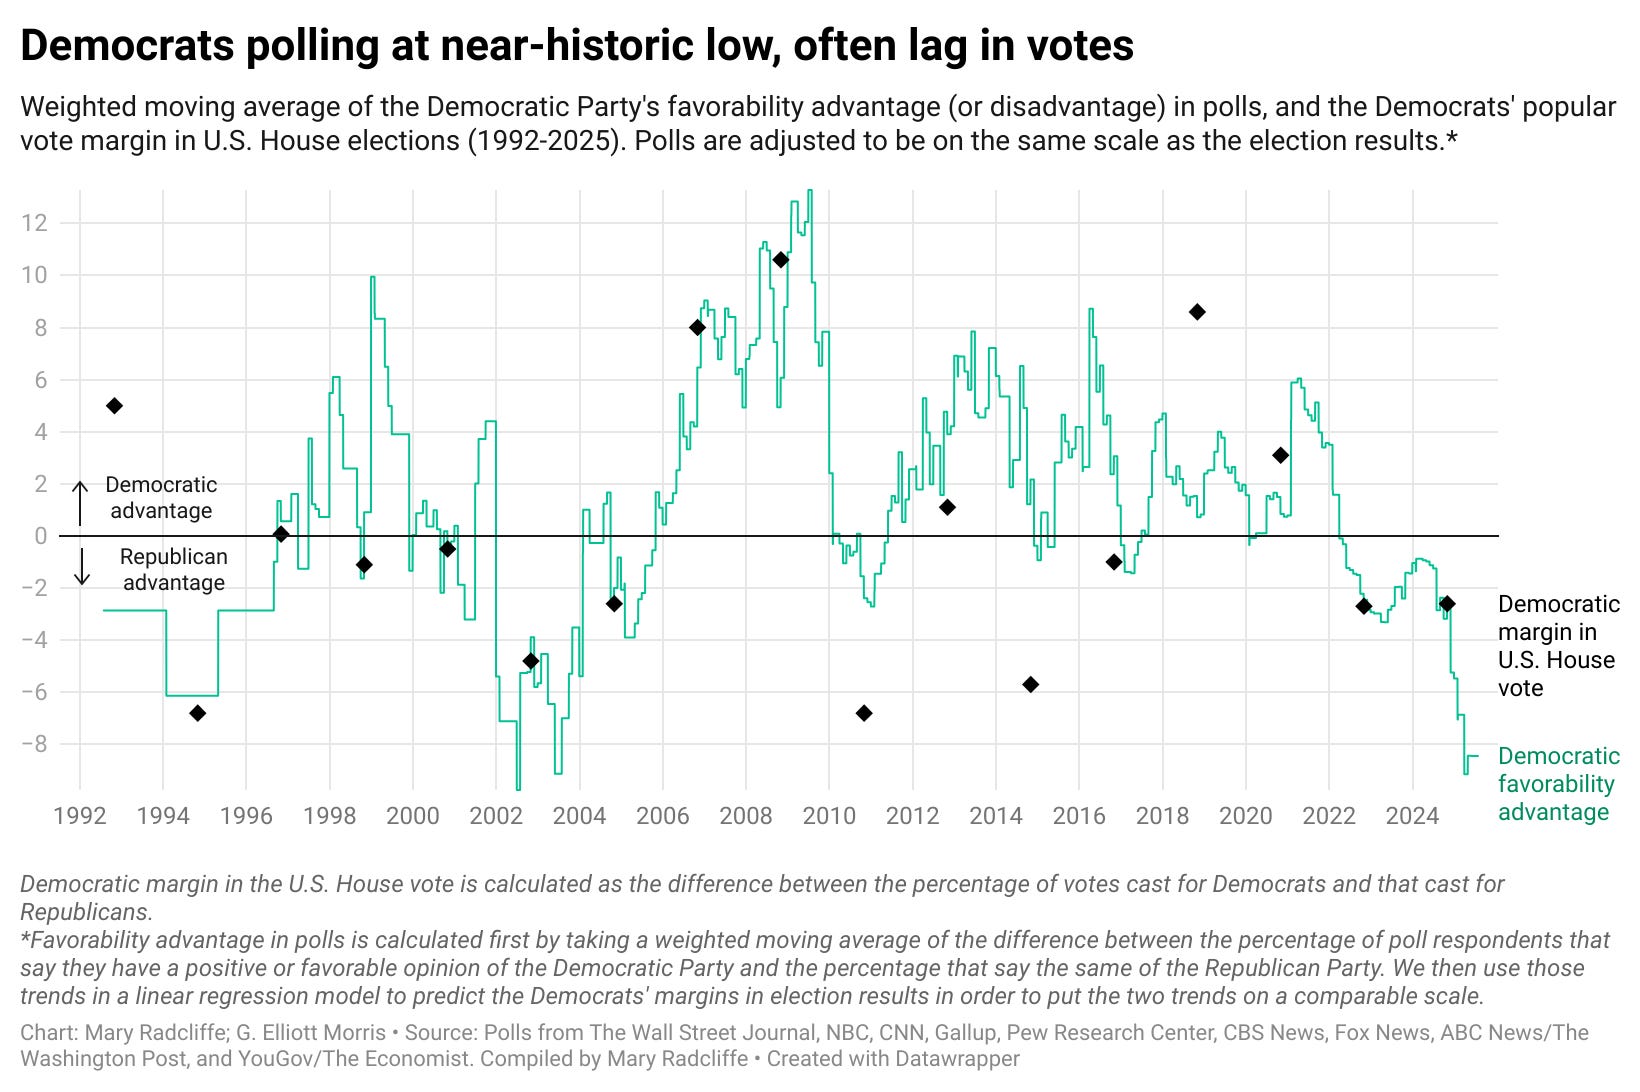
But a favorability rating does matter. In the graph below, we (Mary and Elliott, though mostly Mary) show how the Democratic advantage in party net favorability rating correlates rather well with the party's performance in congressional elections since 1992. Except for some weird outliers in 2010, 2014, and 2018, the parties' favorability ratings as of Election Day predict the party's margin in the U.S. House popular vote to within 2 percentage points.
In case you don't read image captions: Note that we did rescale the net favorability trend to get the y-axis to match the scale of U.S. election results. The Democrats go from being 10 points less popular than the Republicans to having a predicted 8-point loss in the popular vote IF the 2026 election were held today.
So that’s not nothing. But this is quite a different story from “worst ever Democratic rating, 30 points underwater, historic deficit vs the GOP.” The vibes in these two realities are meaningfully different. Below, you’ll see why the more nuanced view is better calibrated for forecasting electoral trends.
You can disapprove of a party and still support it
Second, we need to ask what the favorability percentage means in terms of electoral or political consequences. When we measure something with a poll, we are trying to tap into social dynamics, individual behaviors, etc. in the real world. Abstract measurements are somewhat useless when they aren't moored in actual behaviors or outcomes, so let's try to figure out what party favorability is a proxy for.
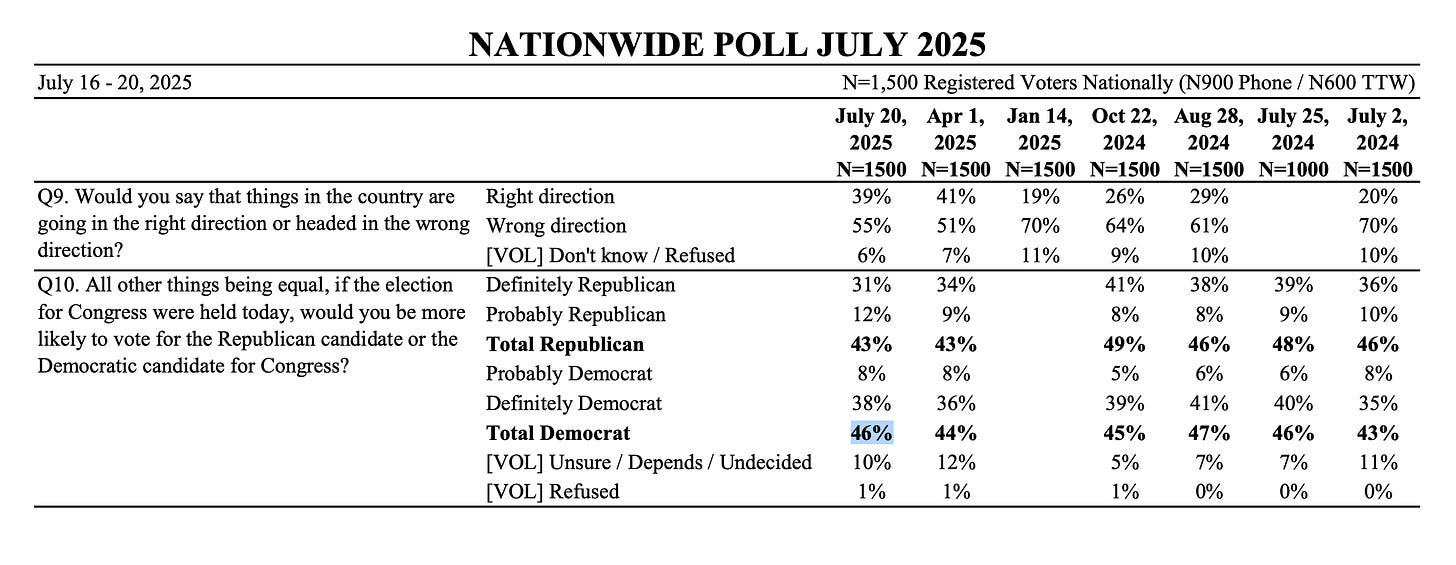
The WSJ reports that Democrats are 19 points underwater in party image compared to Republicans. That's indeed pretty bad. But does it mean, e.g., that voters won't vote for Democrats in next year's elections? In fact, no! The very same Wall Street Journal poll that got branded as the party having its "worst ever" image also shows the Democrats up three in the generic congressional ballot. That’s a six-point swing from their last poll in 2024 and would be large enough for the Democrats to win somewhere around 230-235 seats in the U.S. House of Representatives.
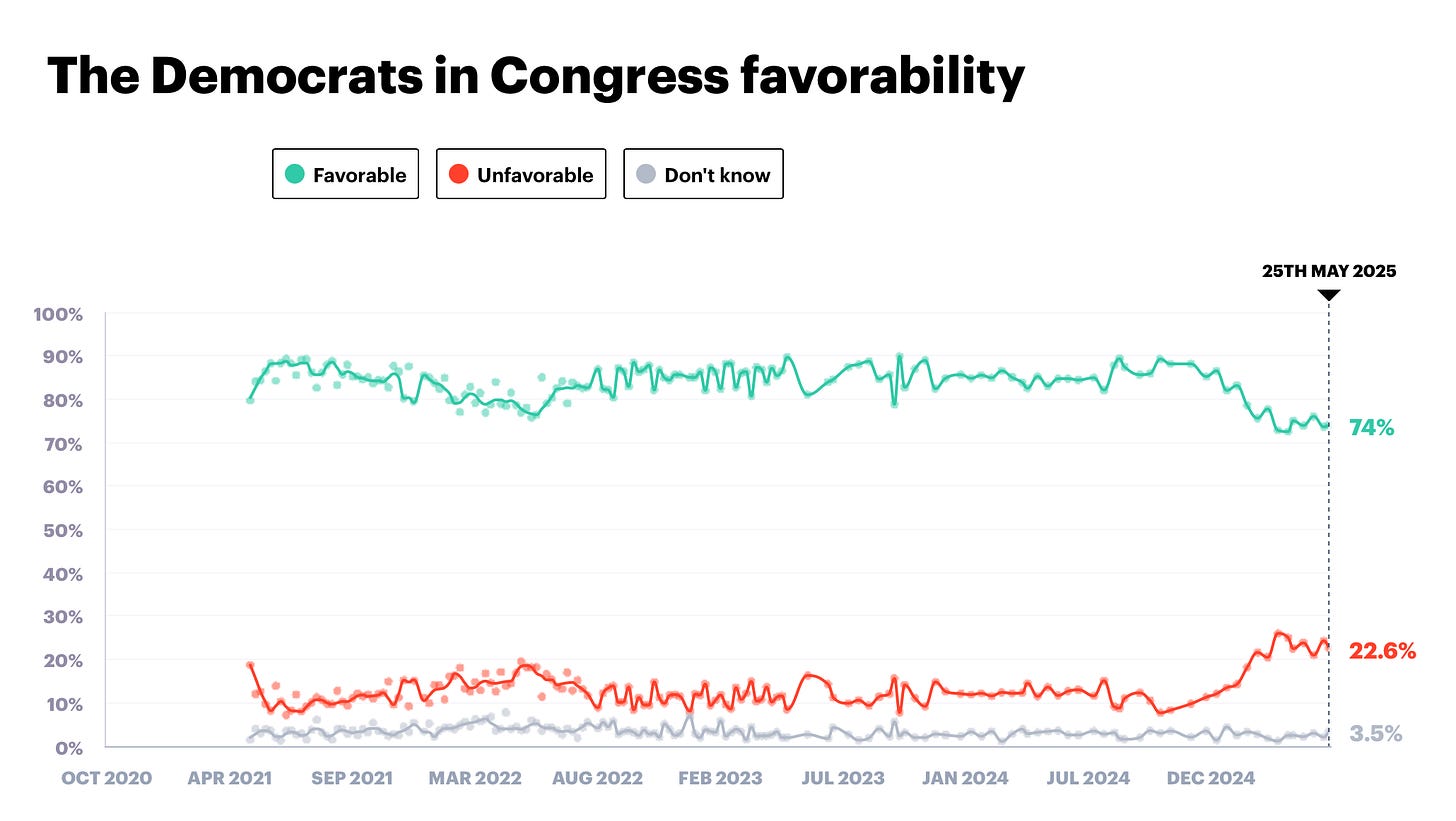
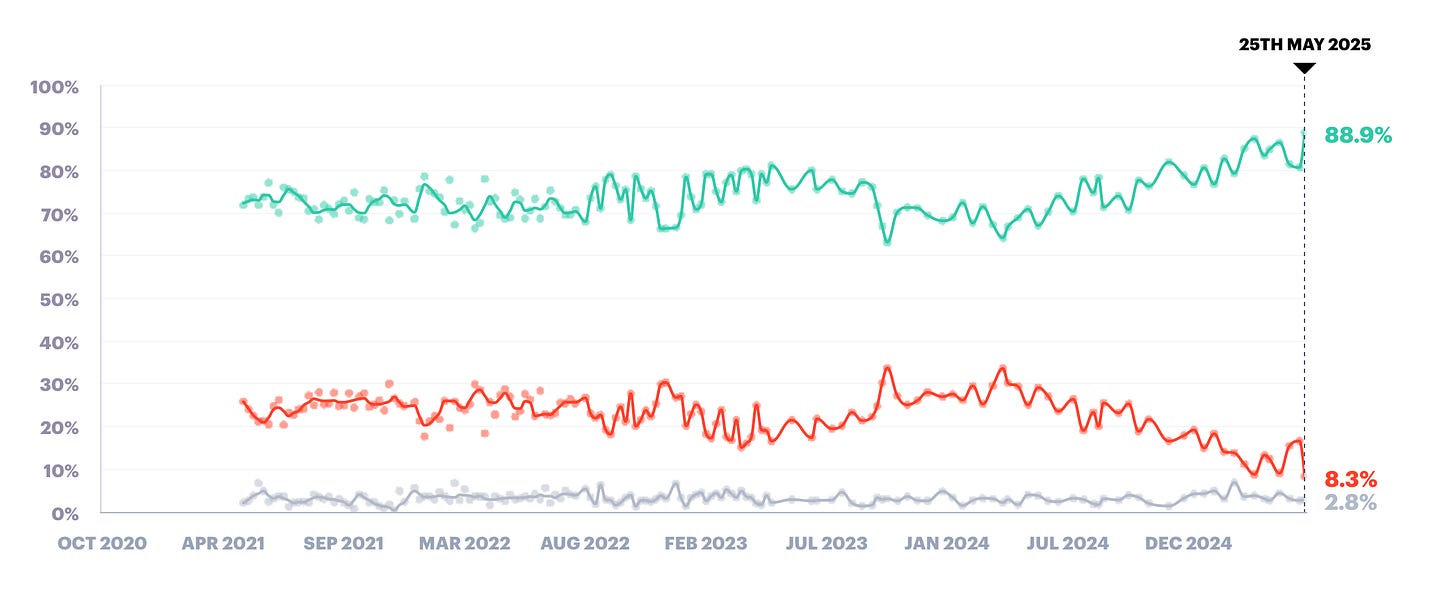
But how can the Democrats have such a poor rating while winning the House popular vote? What's going on here is that a lot of Democratic voters don't like the party brand, but still think of themselves as Democratic voters, and will vote for the party above alternatives. I don't have crosstabs for the WSJ poll, but you can see this if you compare the party favorability trend in the YouGov/Economist for the Democratic Party, among Democrats…
…to the trend for Republicans, among Republicans:
The percentage of partisans who don't like their party is between 2-3 times higher among Democrats than Republicans, and support is 15 points lower. This is what's behind the Democrats’ low rating.
And, to be sure, this isn't a finding that's specific to YouGov data. For one thing, the WSJ poll has to necessarily contain the same finding, otherwise there's no way to get the Democrats to 46% of the generic ballot vote with only a 33% favorability rating.
Left-wing disaffection is sinking Democrats
In our Strength In Numbers/Verasight polling, there is a large mass of left-leaning Democrats who are bringing down the party’s favorability rating. In our data, about 20% of the Democrats who call themselves “very liberal” have an unfavorable view of the party. That compares to just 8% of “very conservative” Republicans who view the GOP negatively. If you account for left-wing disaffection, the percentage of Americans who approve of the Democratic Party rises by 4 points — increasing their net rating by 8 points. That would bring the party’s net rating up to even, about where it was just after the 2022 midterms.
And interestingly, the share of not-far-right Republicans who approve of their party is lower than the share of Democrats who approve of theirs, at least in our data. In other words, the Democratic Party’s favorability rating is so much lower than Republicans’ almost entirely because of dissatisfaction from in-party ideologues. The Democratic Party actually has a higher favorability rating among political independents than the Republican Party does!
In terms of electoral consequences, 88% of self-described “very liberal” Democrats say they would vote for a Democratic candidate in their congressional district if the 2026 midterms were held today. That is 2 percentage points lower and within the margin of error of the 90% of “liberal,” “somewhat liberal,” and “moderate” Democrats who say they’d vote for a Democrat in their district. Again, this is the inverse of public opinion on the right, where it’s the “conservative,” “somewhat conservative,” and “moderate” Republicans who may abstain from voting for Republicans (just 80% Republican on the generic ballot — compare that to 87% among “very conservative” Republican voters).
So while the Democratic Party's rating is low in this one abstract measurement that people encounter in the context of political polls, it’s not exactly the death knell for the party's electoral performance that the coverage of the WSJ poll signaled. And the topline number is skewed by the percentage of partisans who are unhappy with the party, but not exactly running to the polls to vote for a center- or right-wing party.
Why the Democrats are struggling to be popular
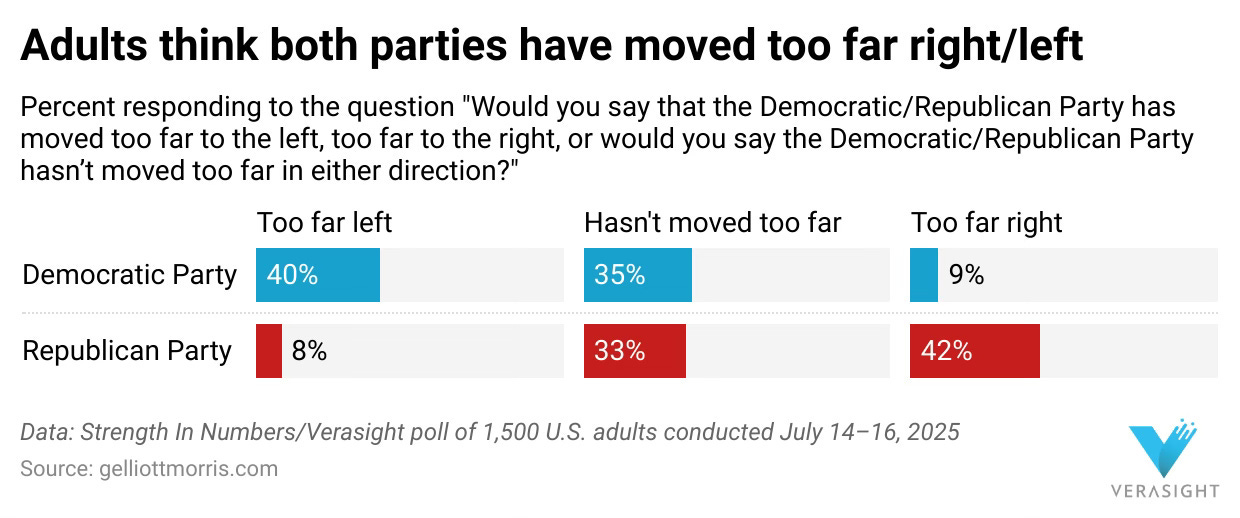
It's not the point of this article, but looking at the data, I think the Democrats’ problems have something to do with party leadership and recent electoral performance (as opposed to ideological positions or something to do with "wokeness”). Voters do not think Democrats are more ideologically extreme than Republicans:
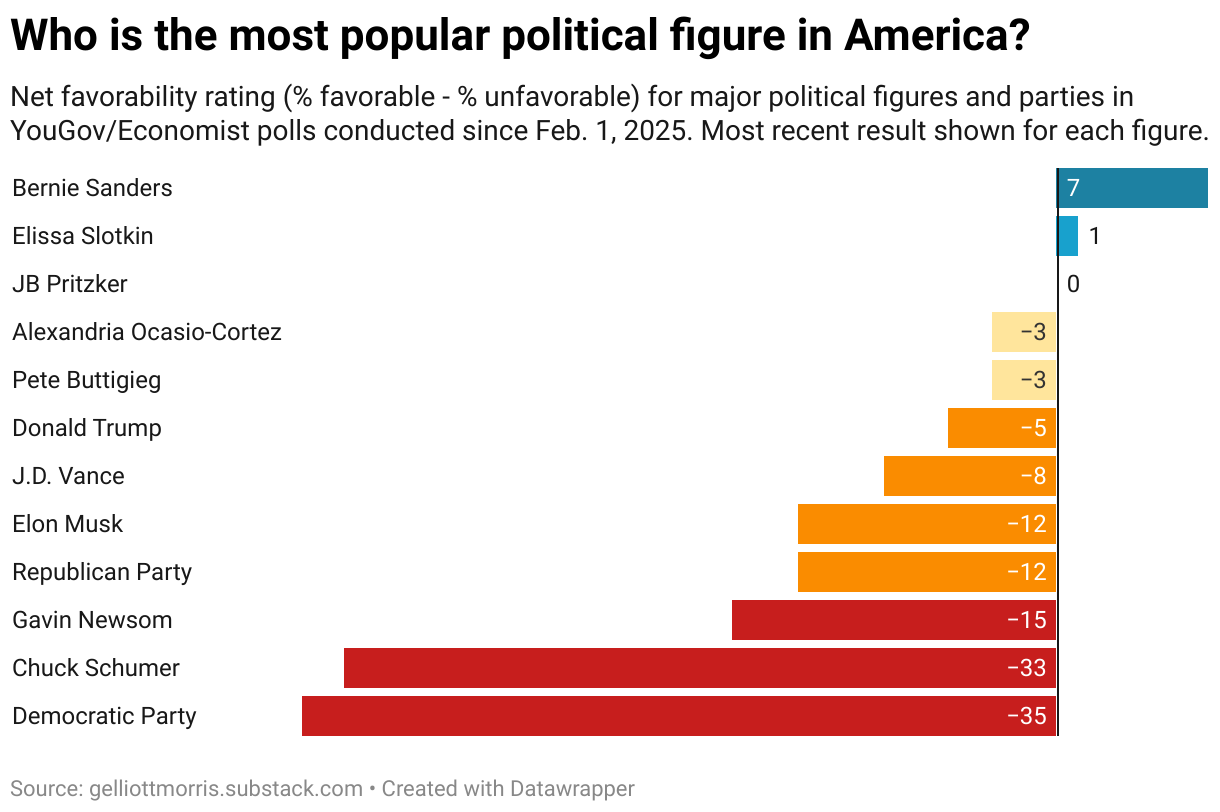
But voters do rate the Democratic party's leadership figures poorly, however:
Of course, it could be a little bit of both (with social science, it usually is). But let's get back on track.
As mentioned, hidden in the Wall Street Journal poll is a finding that an unpopular party brand doesn't necessarily predict electoral doom for that party.
There's a related point to make here, and that's that polling data this early in the cycle has almost no predictive power for congressional election outcomes. I'm going to boot up the historical data now, and run some predictive models to show you just how poorly these early polls predict congressional — and especially midterm — elections. In particular for midterms, the relationship is so weak that you're actually better betting against the party that has the favorability rating advantage this early in the cycle, historically speaking.
It’s time for some models and scatter plots:


