

Democrats up 6, 10 points in new averages of New Jersey and Virginia governor polls
Aggregators take note: We found that many polls in these contests are sponsored by or affiliated with GOP campaigns, increasing the potential bias of (unadjusted) polling averages

Two announcements before we get started:
First, like Strength In Numbers did for the first No Kings Day event in June, we will be producing an estimate of total turnout for this weekend’s anti-Trump protests across the country. This estimate is based on crowdsourced accounts of protest turnout provided by organizers, local officials, and attendees, and collected by me and Alex Ip, a data scientist and journalist for the independent news outlet The Xylom.
SIN is doing this crowd-counting work for two reasons. First, because major media outlets crave data after large protest events — but since high-quality estimates aren’t usually available (academic accounts take months to come out), they tend to rely on anecdotes, ad-hoc estimates from organizers (which are typically inaccurate), or worse. We use crowdsourcing and simple statistics to provide a sensible initial estimate while academics do their thing. Second, the charts we can make with protest data are very informative for other stories. Look out for this data from us Saturday night or Sunday morning, here on this Substack.
Also, the monthly Q&A for October will go out on Tuesday, the 21st. Please send in your questions ASAP if you haven’t already! You can submit a question by adding it to the comments of the September Q&A, or by emailing me at questions[AT]gelliottmorris[DOT]com.
Okay, time to talk about the polls.
Partisan polls are dragging down Dems in VA, NJ poll averages
I have written here before about the need for polling aggregators to take into account whether the polls they’re collecting are created by partisan sources. This is another one of those articles — this time, with consequences for polling averages for the races for governor in New Jersey and Virginia.
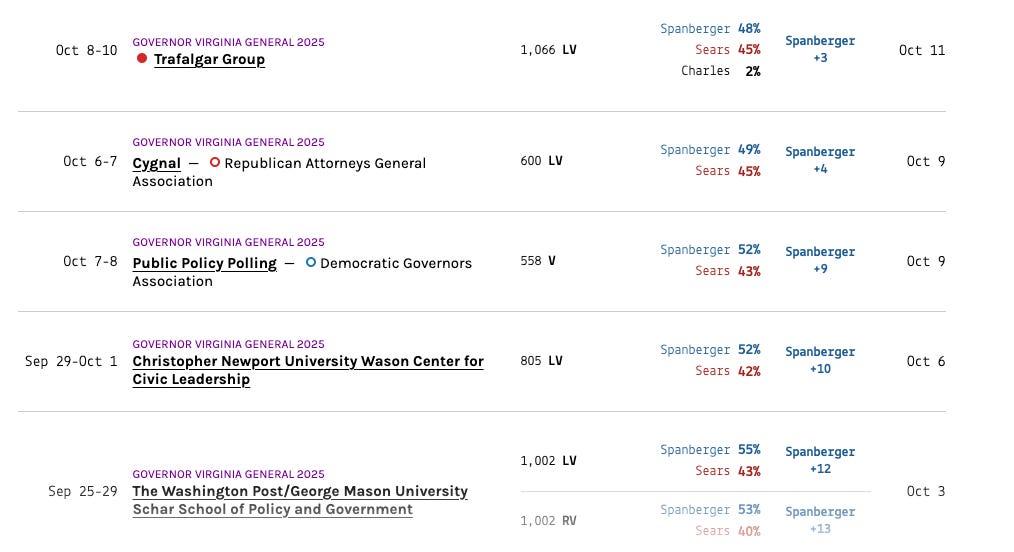
Some background: A lot of polling averages — such as the ones from RealClearPolitics and DecisionDesk HQ, as well as ours at FiftyPlusOne.news — include partisan polls in their database. Here’s a list of recent polls in Virginia. Note the partisan surveys denoted by the red and blue circles.
Including partisan polls in an average is empirically defensible because these polls, while partisan, tend to have pretty predictable biases over the long term. Historically speaking, a poll leaked by a Republican campaign typically overstates support for the Republican candidate by about 4 or 5 points on margin — for Democratic polls, there’s a bias in the other direction. The exact amount of bias (relative to the average poll) can vary, and a model can figure that out for us.
Because this estimate of poll-level partisan bias is right on average, if an aggregator adjusts for these historical patterns, then the trends in data from the same pollster become meaningful for the average. For example, if a poll from the Trafalgar Group (a pollster that FiveThirtyEight previously caught doing work for Republican clients that it did not disclose, so I consider it partisan) shows Democrats losing ground over time, then correcting for the bias across all surveys produces an informative result.
Most polling aggregators don’t use partisan data the right way
But here’s the thing: Most polling aggregators do not make this adjustment; they just take the data as-is. RealClearPolitics, for example, currently has 4 polls in its aggregate for the Virginia governor’s race. Half of them (polls Trafalgar and Cygnal) were produced by partisan firms OR for a partisan client (Cygnal’s data was sponsored by the Republican Attorneys General Association). RCP shows Democratic candidate and U.S. House Rep. Abigail Spanberger up 7 points against Winsome Earle-Sears, the current Lieutenant Governor of Virginia. DDHQ has her up 6.
So what would the average be if we adjusted for those historical biases of partisan data? Well, since RCP uses a simple average of polls, adding 4 points for half the data increases Spanberger’s margin by 2 points to +9. DDHQ is harder to say, since their algorithm is fancier (involving custom weights on polls and polynomial smooths over time), but a good guess is that it’s also off by 2 points just due to the partisan data-generating process behind those surveys.
In total, according to the polling we have collected at 50+1, 30% of the polls released in Virginia have come from partisan sources. On average in Virginia, non-partisan polls released since Sept. 15 have had Spanberger up 9, whereas partisan Republican polls have had her up just 4. If your polling average is dominated by partisan polls, you’re going to end up with a much more GOP-leaning picture of the race.
But wait… that’s not all. While polling results are historically biased based on who pays for or leaks the survey, pollsters also have their own individual methods that can push their data away from the polling average. We call these “house” or “pollster” effects. Generally, house effects are relatively small (only a few points), but in extreme scenarios, they can be as large as 6 points on the margin.
It is extremely important to take house effects into account, from both the statistical and practical points of view. Statistically, if data is generated in groups, then enabling your model to know about those groups and look for residuals among them is simply standard best practice. Similarly, if you were trying to predict students’ grades on a history exam, you’d want some way to control for the quality of each student’s history teacher.
Practically speaking, house effects can really impact averages if left out. In my analysis of DDHQ’s Trump approval average, for example, I found that at one point they were producing an estimate of the president’s net approval rating that was about 8 points higher than it would have been if their model adjusted for house effects.
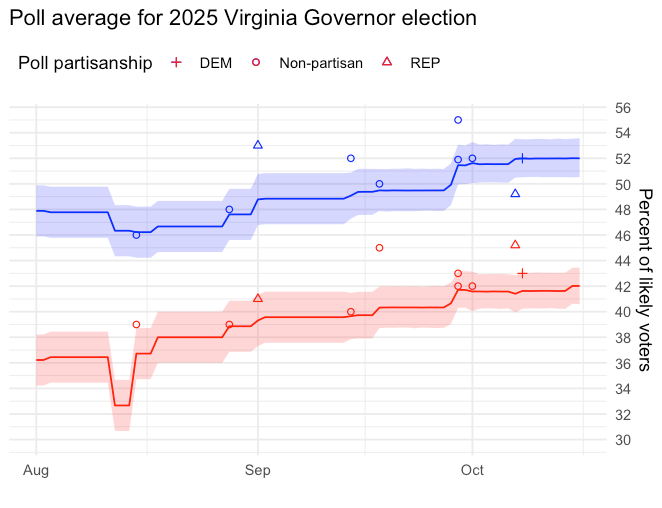
In the case of Virginia’s governor’s race, there’s also a big spread among different polling firms that a good aggregator should take into account. Christopher Newport University has Spanberger up 12, for example. The Trafalgar poll is D+3. Both of these are somewhat different from the average poll (Trafalgar more so), and you’d want a model that adjusted the surveys accordingly.
Our new averages for VA, NJ at FiftyPlusOne.news
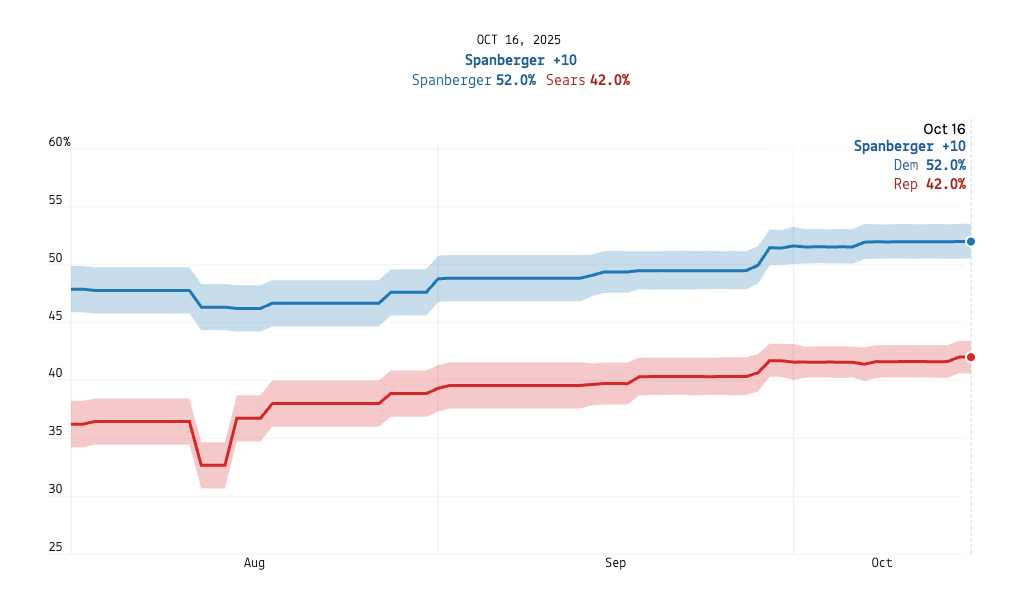
So if you don’t want an average that’s subject to being pulled around by partisan pollsters and firms with strong house effects, here’s our polling average in Virginia at Strength In Numbers’ sister site FiftyPlusOne. We account for partisan biases, house effects, and other factors (including adjusting the average from registered to likely voters, who are more Democratic-leaning this year). We have Spanberger up 10:
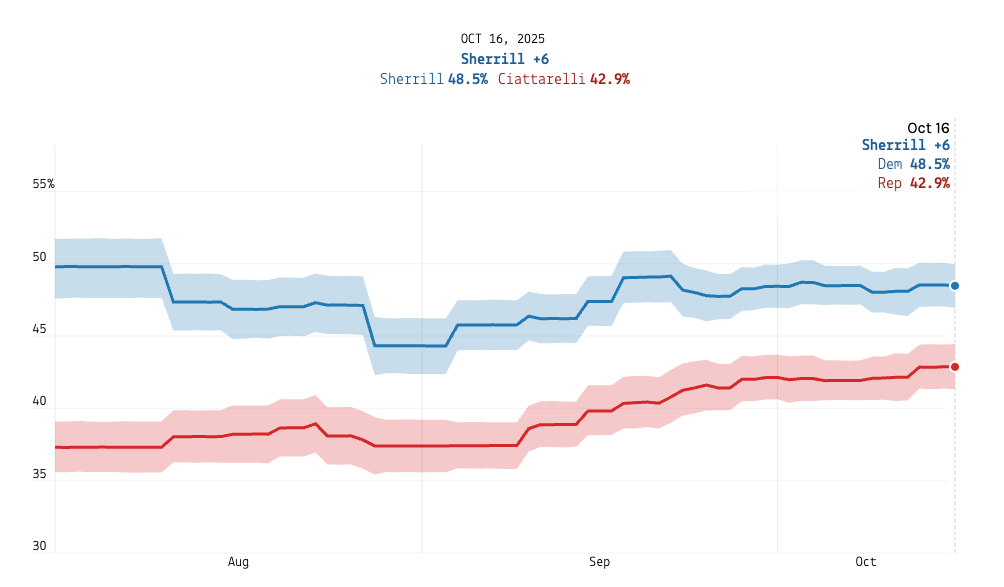
And in New Jersey, we have Democratic U.S. House Rep. Mikie Sherrill up 6 versus former GOP Rep. Jack Ciattarelli:
In New Jersey, 44% of the polls released so far in this campaign have been partisan polls — even higher than the share in Virginia. Non-partisan polls released since Sept. 15 have had Sherrill up 5.3 points, whereas partisan Republican polls have had her up just 3. Again, if you don’t take this into account, you get a very different picture of the race.
It might be easier to show you how this bias affects aggregates if I show you the polls and our average together. Here, I’ve plotted the FiftyPlusOne average for the candidates in New Jersey as lines, and the polls of the race as points — where partisan polls have different symbols from non-partisan polls. Republican-affiliated polls are triangles, Democrats are plus signs, and non-partisan polls are points.
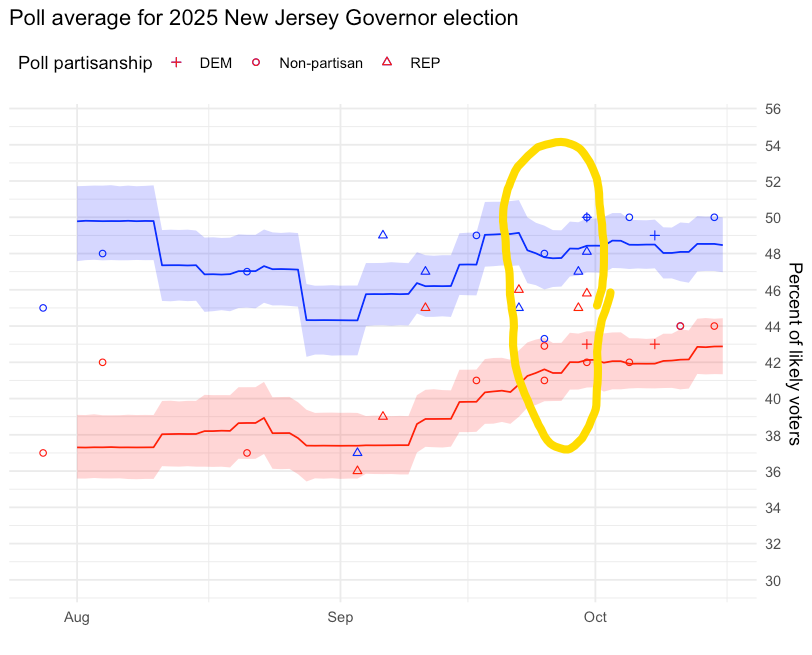
Above, I have circled New Jersey Governor polls released in late September. I chose this period on purpose: Late September is when the conventional wisdom (as indicated by political betting markets) started shifting toward Republicans. This happened right after/while a large mass of Republican-sponsored polls were released, including the only survey since Labor Day to have Sherrill behind Ciattarelli (that other poll was also partisan). Here’s the betting market over the whole campaign:
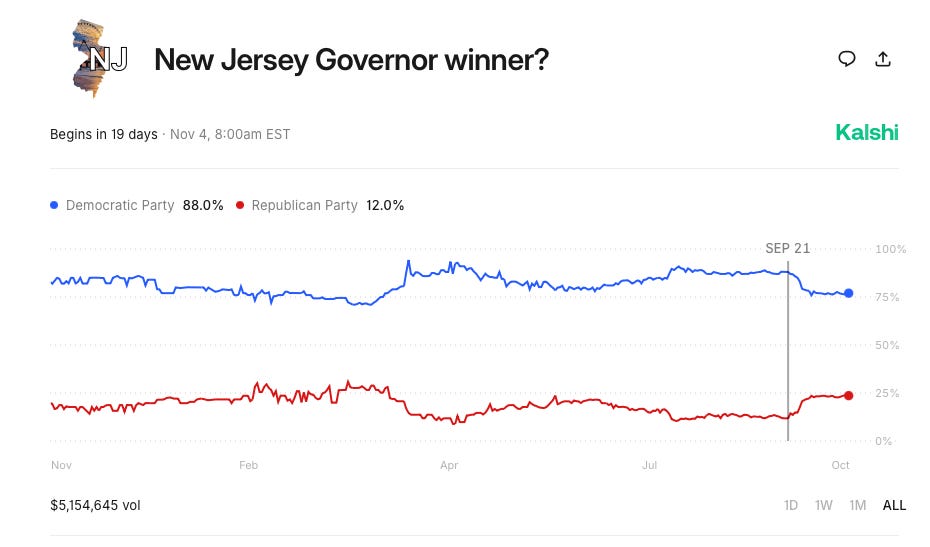
Today, betting markets give Sherrill just a 75% chance of winning. Her win odds haven’t really recovered since that tranche of GOP polls came in: RealClearPolitics and DecisionDeskHQ have Sherrill up 5.
The polls could still be uniformly biased
To be clear, I am not arguing that Democrats will definitely win these races. For one thing, there are a few weeks left, and the Republican candidates could theoretically pull ahead in the polls. As I’m writing this, we haven’t had a good, high-quality, non-partisan poll come out in Virginia since October 1st:
But for another thing, it’s still possible that all polls, regardless of methodology or sponsor partisanship, could be reaching too many Democratic voters, all else equal. This is, of course, what happened in 2016, 2020, and, to a lesser extent, 2024. And in 2022, state polls systematically underestimated Democrats, suggesting errors are unpredictable ahead of time. I would probably buy Mikie Sherrill to win an election at 77 cents, but I don’t think that’s that far off. I would definitely sell at 95 and buy at 70. In other words, at this point, I would be surprised if Sherrill lost, but my worldview wouldn’t be permanently shaken if she did. Large polling errors happen from time to time.
Of course, it’s also possible that the polls are, on average, right, and that the Democratic candidates end up winning by 6 and 10 points (in NJ and VA, respectively).. And if that’s the case, you want to make sure that your average isn’t getting pulled around by polls that — either because of who they worked with or how they do their polls — are overstating support for Republican candidates, relative to non-partisan polls. That is to say: Even if RealClearPolitics beats FiftyPlusOne this year because the polls are on average biased toward Democrats again, it still pays — on average, over the long term — to have a coherent and accurate statistical model.
Over at FiftyPlusOne, that’s exactly what we’ve put together. Our averages for the Virginia and New Jersey governors’ races are now public, and we will update them as we add new polls until Election Day.
Fascinating analysis, but what's is the sample size and margin of error? Even a ten point spread can be an illusion if the margin of error is +/- 5 points. I'm sure the polls showing a 3 point advantage for the Dem in VA are within the margin. I think one of the reason people are suspicious of polls is that they mistake specific numbers for ranges. Thanks.
So G you have a prediction on how wide the margins of victory will be if the favored Dem candidates win their governorships?