

Do non-voters still lean toward Trump?
Who will win the shutdown fight? And what makes a pollster trustworthy? That and more in the Strength In Numbers September 2025 Q&A.

Readers,
Greetings from a cramped Amtrak seat on a new Acela train currently somewhere between Boston and Washington, DC. I’m taking advantage of the poor Amtrak wifi to do some concentrated writing and coding, churning out answers to all the best questions Strength In Numbers subscribers sent in for our Q&A over the last month.
This month, y’all asked a lot of questions about how the public is feeling about Donald Trump’s policy agenda. Hunting down all this data posed a big challenge. Rather than spend a lot of time chasing toplines on various websites, I sourced my artisinal spreadsheets locally; one of the great things about having our own Strength In Numbers/Verasight polling data is that I can go to a central dataset (that I own and understand the quality of) to easily run numbers and generate deep insights for readers.
Thanks to our poll, this Substack is uniquely positioned (relative to other independent politics publications) to satisfy all of your curiosities about politics and the electorate.
For the September SIN Q&A, I combine our polling data from May through September into one mega-poll to answer all of these questions:
Do non-voters still lean toward Trump?
What’s Trump’s approval in the swing states?
Will Democrats get blamed for a shutdown?
How do young Trump voters feel about the president?
And more.
One programming note: I am moving up the October Q&A one week to the 20th, so that I can run our final pre-election 2025 Strength In Numbers/Verasight poll as close to Election Day as possible. You can send questions for next month to me via email (questions[AT] gelliottmorris.com) or leave them in the comments of this post.
As usual, the Q&A will be paywalled about halfway through as an exclusive for paying members of Strength In Numbers. You can sign up to read the full version here:
Trump’s support among non-voters, other groups
Katie asks:
What does the data show on polling among Trump voters, Harris voters, and non-voters broken out by gender and ethnicity? Particularly interested in how it’s tracked over that past year among women across demographics (ethnicity and socioeconomic factors). What are the shifts?
Great (if big) question. I won’t be able to answer every aspect of this (it’s a lot of different demographic breakdowns, which will get boring after a while), but I have extracted a few interesting nuggets from our polling data.
What I’ve done is combine all 7,000 interviews Verasight has conducted for Strength In Numbers over the last 5 months into one big poll. This gives me the ability to slice the country into lots of little pieces that normal polls are too small for. For example, based on this data, 33% of U.S. adults who did not vote in the 2024 election currently say they approve of the job Trump is doing as president, versus 59% who say they disapprove. We can break down these non-voters by sex:
Male: 33% approve
Female: 33% approve
and race:
White, female: 42%
Asian/Pacific Islander, female: 28%
Black, female: 21%
Hispanic, female: 21%
Other, female: 19%
And on socio-economic status, poorer voters have swung much harder than richer voters against the president. I’m showing lines for groups that I feel confident have large enough sample sizes:
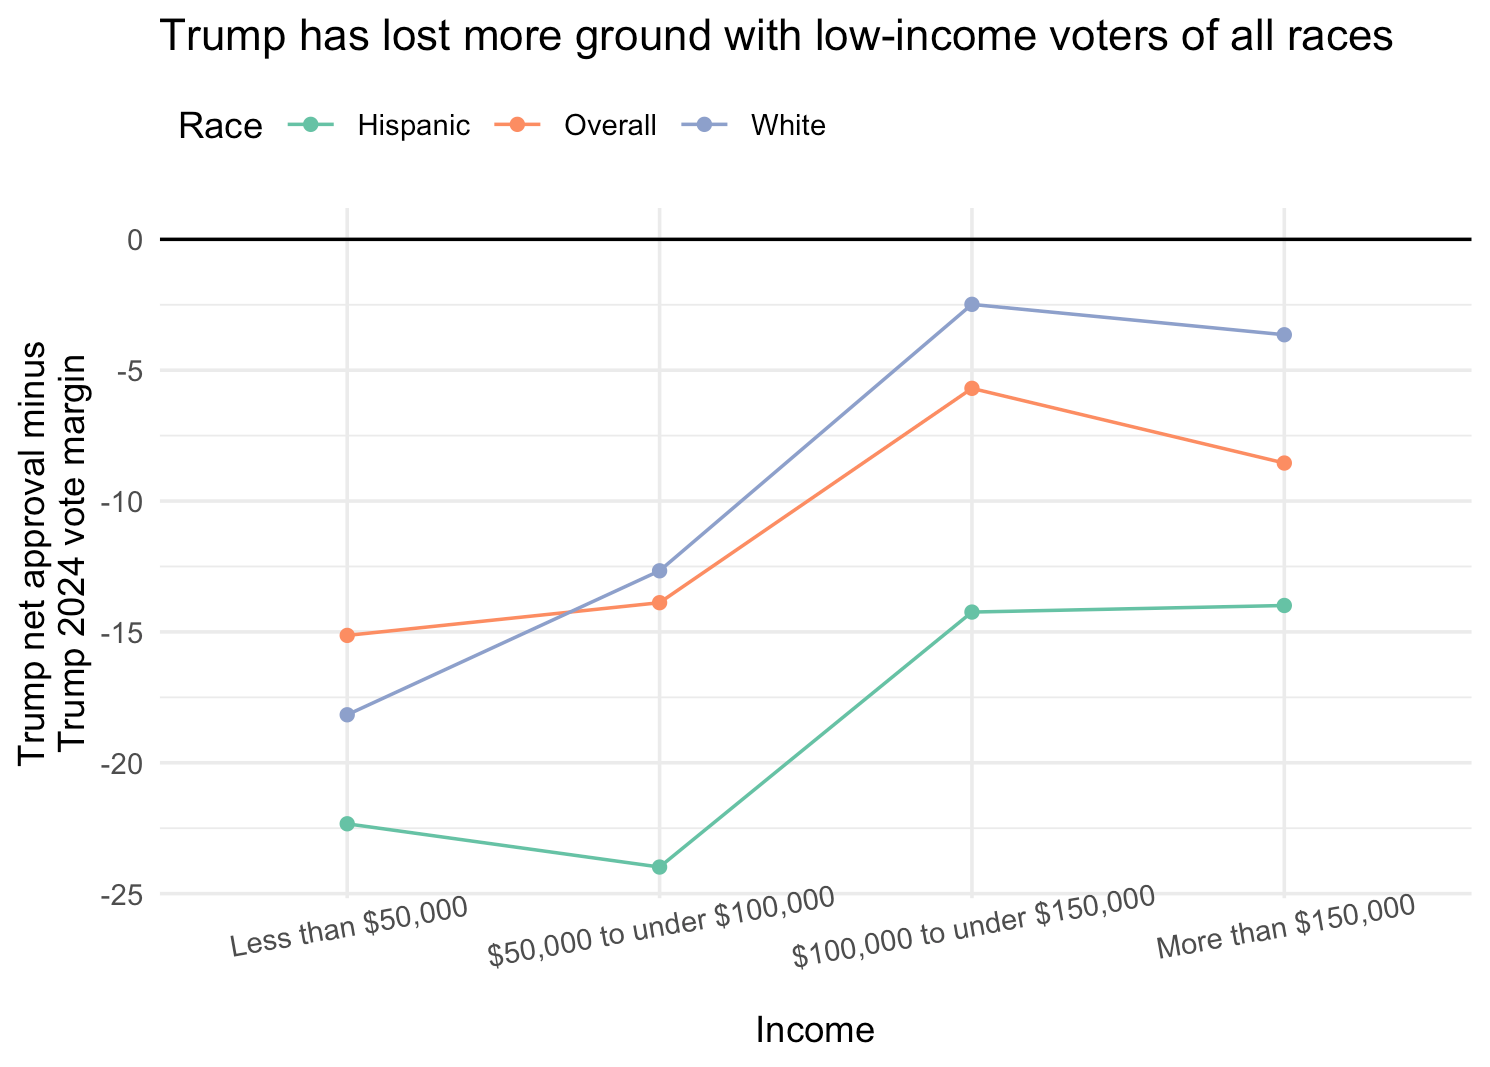
It makes sense that lower-income Americans would react more harshly to Trump’s presidency, since his policies have been inflationary and he has broken his promise to get prices down. What do readers think? What other stories are here in this data?
On a similar note, Matthew asks:
Much has been made of the recent so-called “latinexodus” from Trump in polling and some special elections. Do you believe this is happening? What does 2026 look like if latino voters abandon trump at the rates we’re seeing in approval polls?
Another good question. Here’s the same plot as above, except the horizontal axis shows age instead of income. Notice that huge delta for young Hispanics compared to every other race/age group:
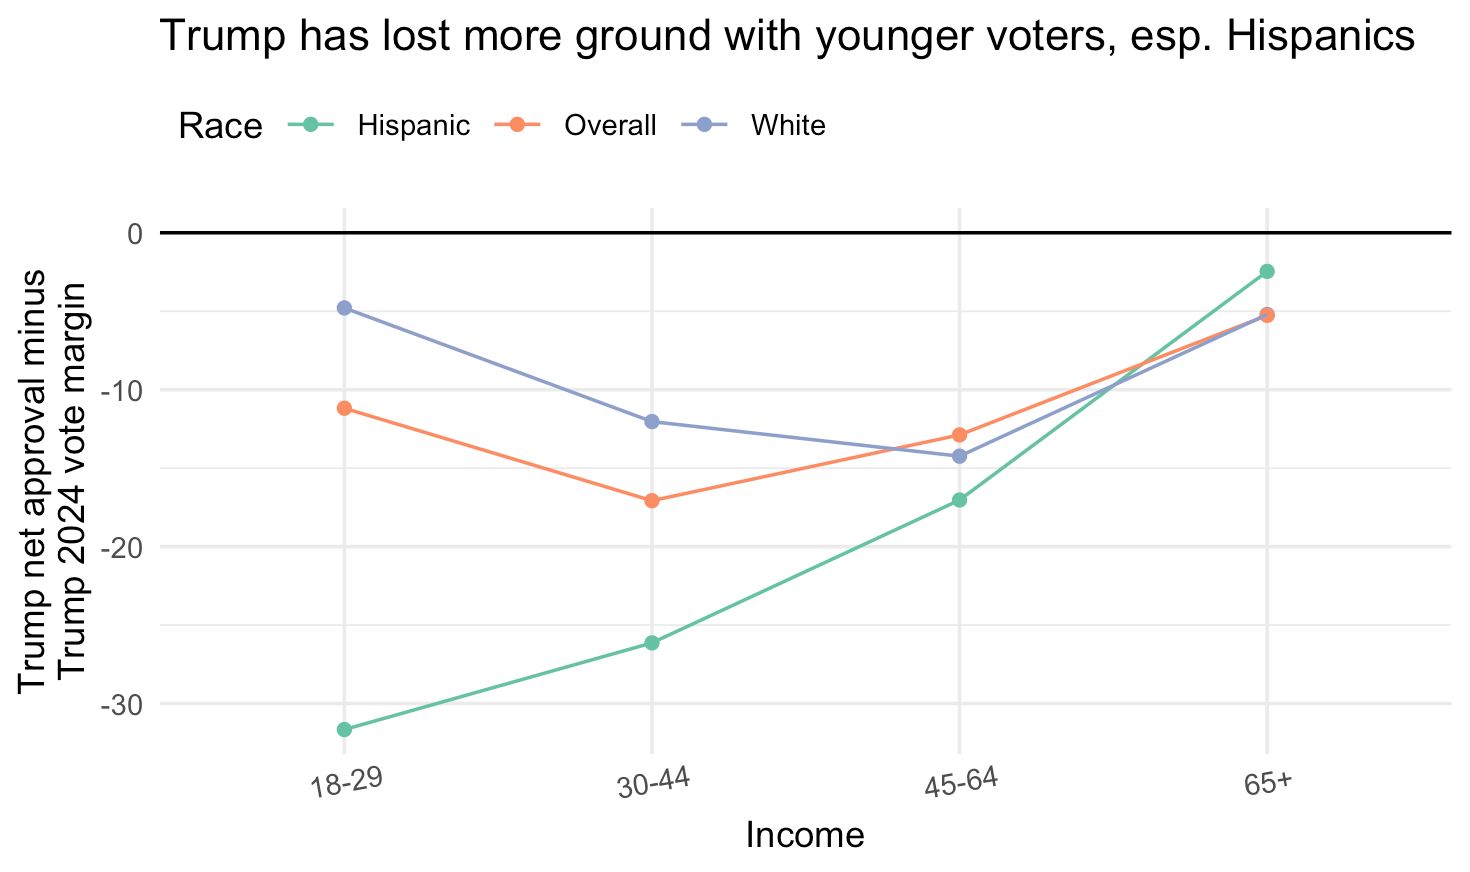
My theory of what’s going on here is that “young, Hispanic” is the intersection of two groups that were very sensitive to price increases during Joe Biden’s term, but were not necessarily super conservative or on board with Trump’s policy agenda. Here, I mean especially tariffs and mass deportations, which are also both inflationary and highly visible to young people and Hispanics.
And for the sake of clarity, the way I did the math for the vertical axis was two-fold. First, I calculated Trump’s net approval for each group using simple demographic crosstabs of survey data. Then, I calculated the 2024 election results for each group based on self-reports from our poll respondents. This way the comparison directly measures admitted changes in attitudes from individuals (rather than, e.g., me comparing my data to the 2024 exit polls, which risks conflating survey noise with differences in vote share).
Trump’s net approval among young people (18-29) in our survey data is -38 today, which is about ~35 points lower than his estimated vote margin among the group in 2024.
Modeling state-level Trump approval
NCPack2010 asks:
We see all the national level polling for Trump’s approval but I remember in the past during presidential elections there were cases where state level polls were better. Is state level polling showing the same level of Trump approval as national averages?
Great question, and a few ways to answer this. Each has its own tradeoffs.
First, we could calculate state-level averages of Trump’s approval using only polls that are fielded at the state level. However, there aren’t enough polls in most states, so this results in noisy averages.
We could also estimate Trump’s approval in each state using something called “uniform national swing” (UNS). The way this works is we calculate the difference between Trump’s national net approval rating today and his national vote margin in 2024, and then add that delta to Trump’s margins at the state level in 2024. This gives us a very sensible prediction, but we miss any state-by-state residual change (maybe California has moved more against Trump than other states because of immigration raids; or, equally, maybe there’s been a backlash among farmers in Iowa).
Finally, we can calculate state-level Trump approval by training a statistical model on polling data and estimating state-level opinion based on the demographic traits of people who live in each state. We do this using something called multilevel regression with post-stratification (MRP).
In MRP, we train a statistical model predicting an individual’s likelihood of approving of Trump today based on factors such as their race, age, education, income, the partisanship of the county they live in, and so on, and then predict every American’s probability of supporting Trump today based on their traits in U.S. Census data.
MRP is cool, but you’re locked into one data source (unless another pollster wants to supply me data) and subject to potential modeling errors (”researcher degrees of freedom”).
To give NCPack2010 a good answer, I’m going to take our existing UNS-based estimate, which lives on the Strength In Numbers data portal, and combine it with an MRP-based estimate. Here’s the current UNS-based estimate:
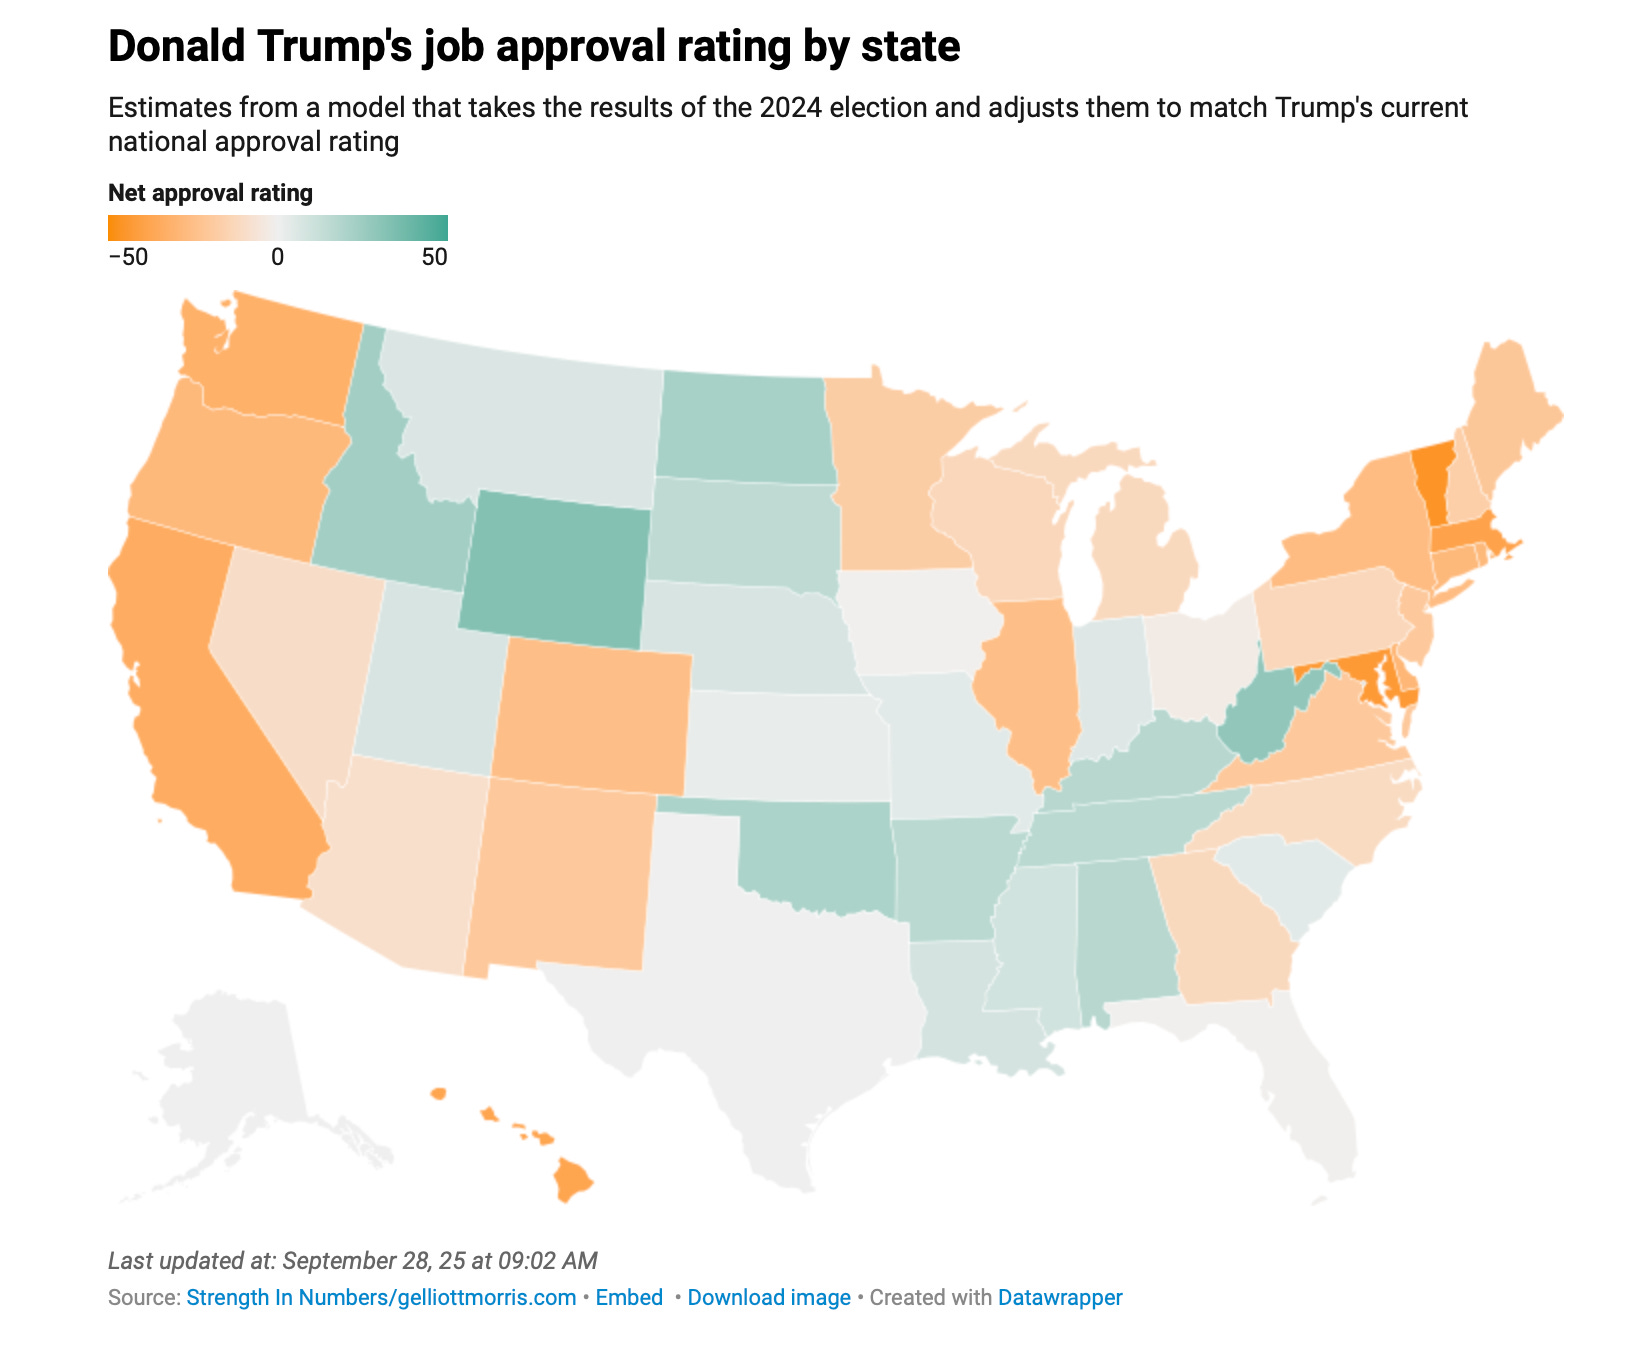
And here’s the MRP-based approval, which looks similar but has some differences — it’s generally about 3-4 points more negative than the UNS estimate, and much worse for Trump across the South:
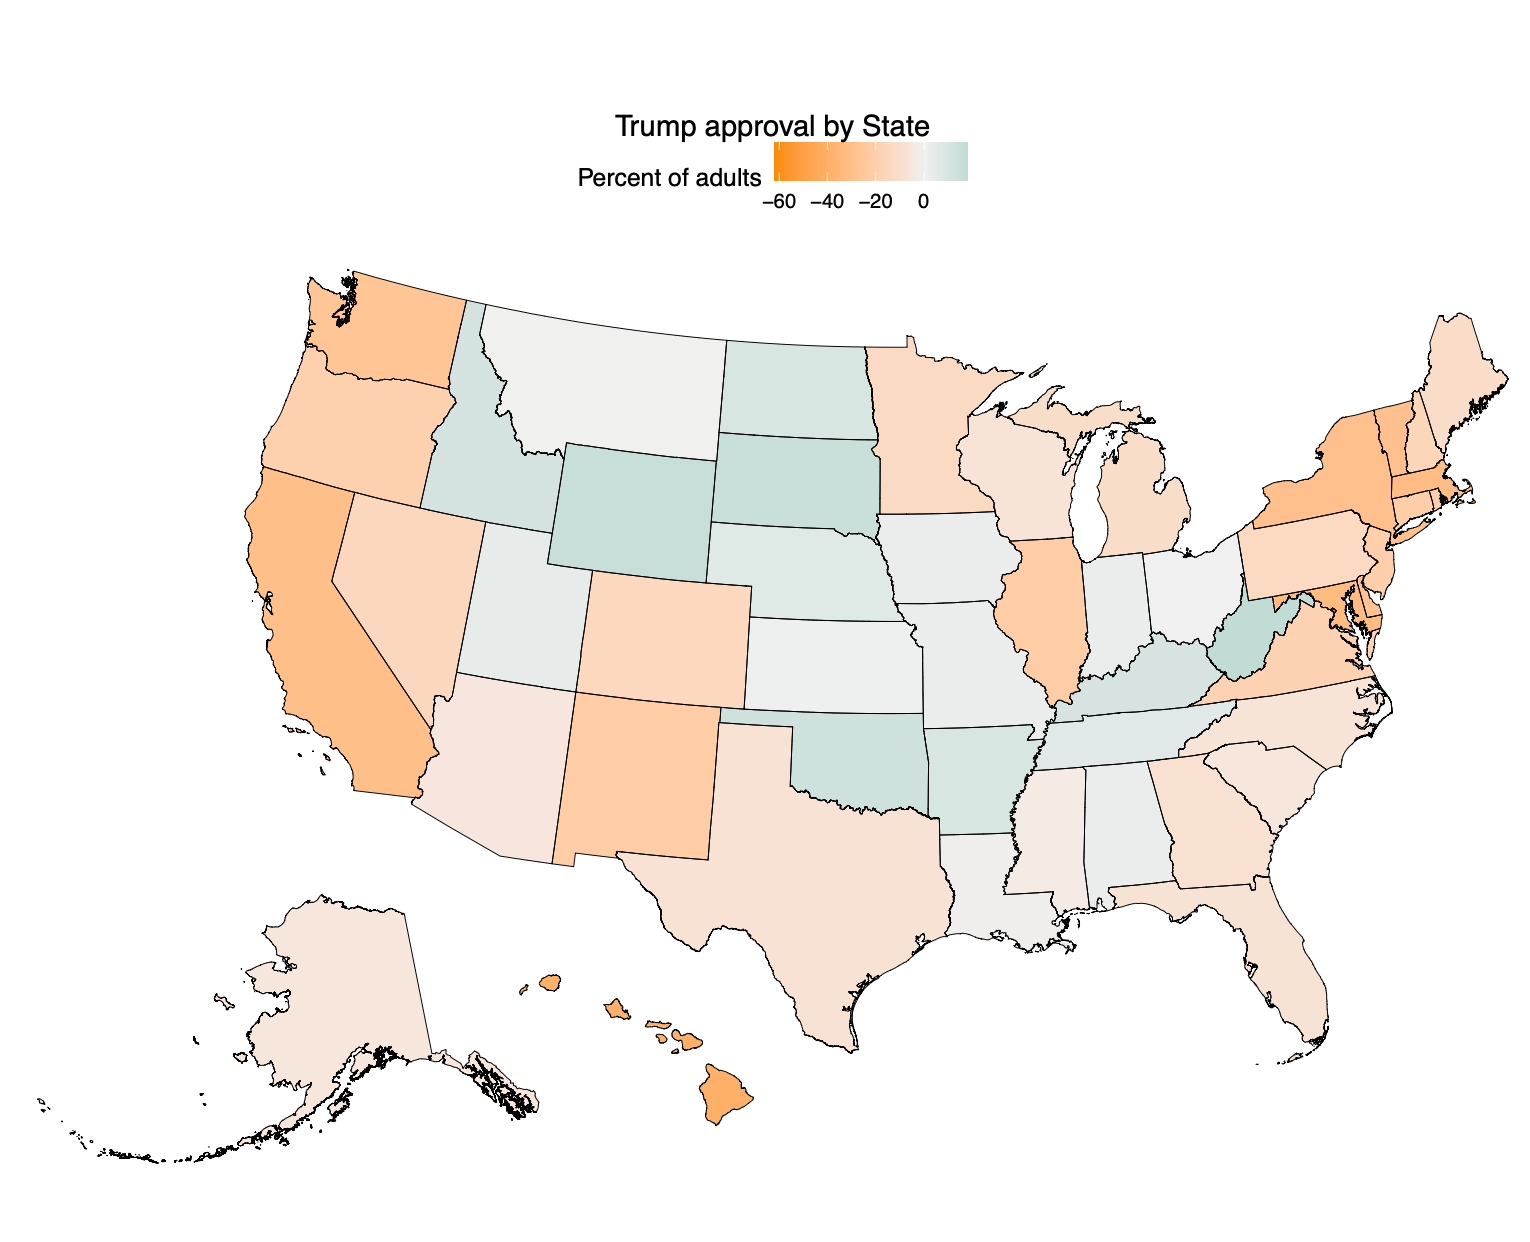
The resulting averages are shown in this table:
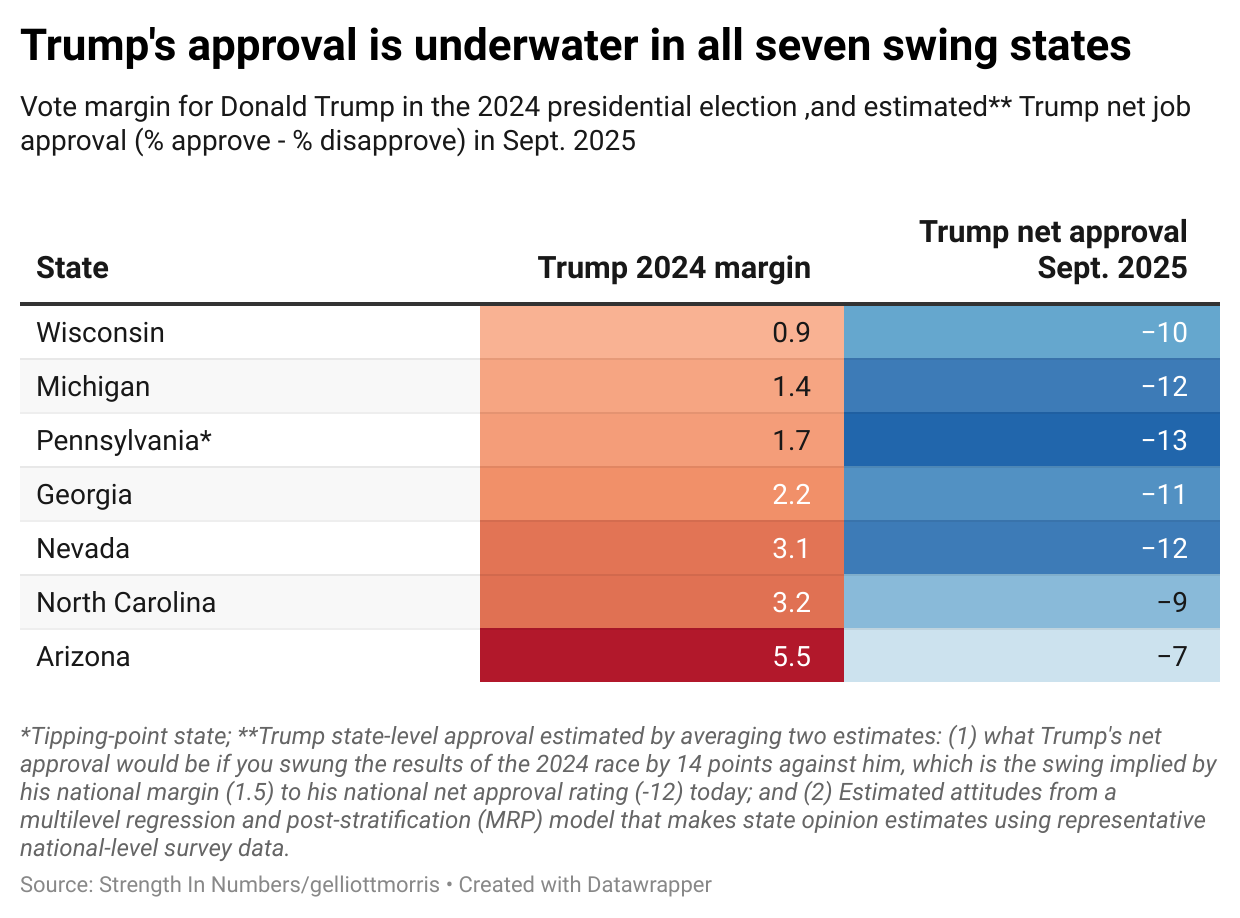
One of the things that is apparent to me in all the data I’m crunching for this Q&A today: there are a lot of Trump voters out there who regret their choice in 2024. In our polling data, just 82% of Trump’s 2024 voters approve of the job he’s doing as president today (plus 33% of non-voters and 3% of Harris voters). For comparison, 95% of Harris voters (plus 59% of non-voters and 15% of Trump voters) disapprove of his presidency.
Why are Democrats trailing so badly on policy?
Rikeijin asks:
Why are people dissatisfied with Trump’s economic policies (including strong dissatisfaction with inflation and tariffs), yet still trust the Republican Party’s economic policies significantly more than the Democratic Party’s? Link to Reuters poll
This is, in many ways, the billion-dollar question for the Democrats today. The common answer in Washington is that voters don’t know what the party “stands for,” and you can’t support something you don’t know anything about. This poses a big messaging challenge for the Democrats, which is why you see the common fights against the pro-moderation/anti-left crowd and the progressives. This “circular firing squad” dynamic likely only contributes to the confusion of the average voter.
Another answer might be that these polls are artificially bad for the Party because they factor in a lot of dissatisfaction among Democratic voters who will vote for their party’s candidates in future elections, anyway. There is certainly some evidence for this; if you look at the crosstabs for that Reuters poll, you see the gap between the two parties on trust on key issues is actually smaller than it is among the general public.
But the gap is still there. My prior is that the gap will shrink as the Democrats find a standard-bearer to run in the 2028 presidential election. And it doesn’t help that Democratic leadership is dramatically unpopular:
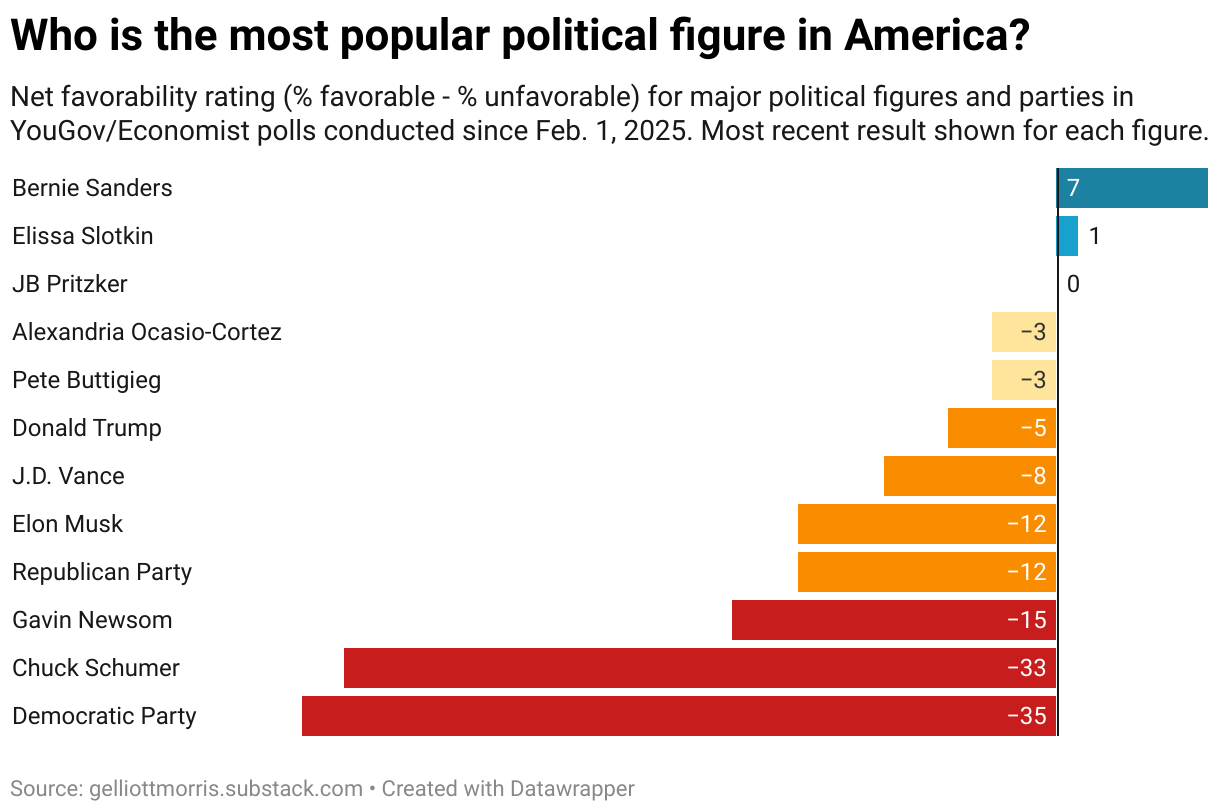
This is one of those questions that I won’t take too seriously until we’re closer to a national election — but if these party’s numbers are this bad this time next year, they’re in for some trouble.
What makes a good poll/polling average?
Dawson asks:
There seems to be a big methodological divide when it comes to estimate Trump’s popularity, with online opt-in polls giving him far better numbers compared to matched samples, live phone surveys, and probability panels. Opt-in polls tend to show Trump only a few points underwater (or even above water), while all the other poll types pretty consistently show him double digits in the red. Any thoughts on why this is happening? Which polling method is more reliable here?
Love a wonky poll average question. The first thing I want to say is that our polling average, unlike every other average on the market, actually controls for these methodology- (or “mode-”) level differences across pollsters. This is one factor of the “special sauce” of our approach to polling aggregation.
