The New York Times is wrong about the electoral value of moderation | Weekly roundup for October 26, 2025
The paper's arguments hinge on several methodological flaws, and it dismisses valid empirical alternatives. Plus: Gerrymandering, and the Republicans' lost lead on economics
Dear readers,
This week’s lead note touches on a big New York Times article published on Monday, Oct. 20, in which the paper argues moderate candidates for Congress meaningfully outperform non-moderate candidates (On the order of 4 percentage points). Given that this Substack is devoted to seeing what we can (and cannot!) learn about politics using data, I have a couple of reactions to this piece. The Times also criticizes my own earlier analyses on this topic, so I think it’s only fair that I get a response.
On deck this week: I’ll have results from our final pre-election Strength In Numbers/Verasight poll, and some meta commentary on phones, social media, and work — plus the usual Friday Chart of the Week.
The New York Times makes several crucial errors in its analysis of the electoral value of moderation
The New York Times published an opinion piece from the Editorial Board this week titled “The Partisans Are Wrong: Moving to the Center is the Way to Win”. In this piece, the Board makes a familiar argument: In analyzing 2024 election returns, the paper finds that moderate candidates for the U.S. House have overperformed progressives, and asserts that this is the single path the Democratic Party can take to win future elections.
I disagree for three main reasons:
I. The Times makes basic statistical errors that overstate the effects of moderation
Let’s get to the heart of the disagreement: the math. It appears that the Times’ analysis makes several big statistical errors that overstate their case. Ironically, these errors are the same ones that other analysts on the moderation hype train have made, and are explained well by Adam Bonica in his response to the Times.
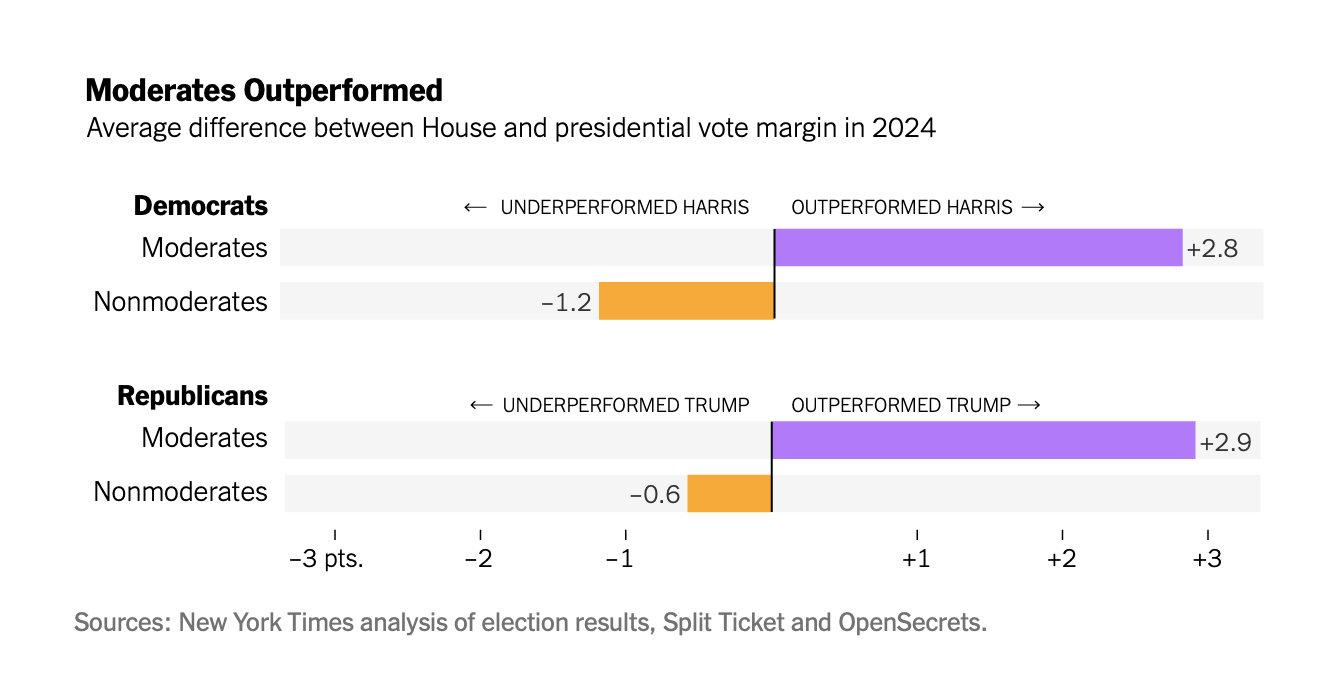
The first error is that the Ed Board ignores other non-ideological factors that explain candidate performance. The key empirical evidence the Times generates is the following plot, showing the average raw difference in House candidate and presidential vote margin in 2024 for candidates the Times determines are “moderates” and “non-moderates.”
According to the Times, moderate House Democrats did 2.8 points better on vote margin than Kamala Harris did in 2024, while non-moderates did 1.2 points worse. The Ed Board attributes this entire difference to ideological differences between moderates and non-moderates.
This ignores that other factors, such as incumbency and the amount of money a candidate fundraises, also correlate with a higher candidate vote margin. In 2024, moderates were disproportionately incumbents and had more money thrown at their races, which explains almost all of the Times findings. Bonica writes:
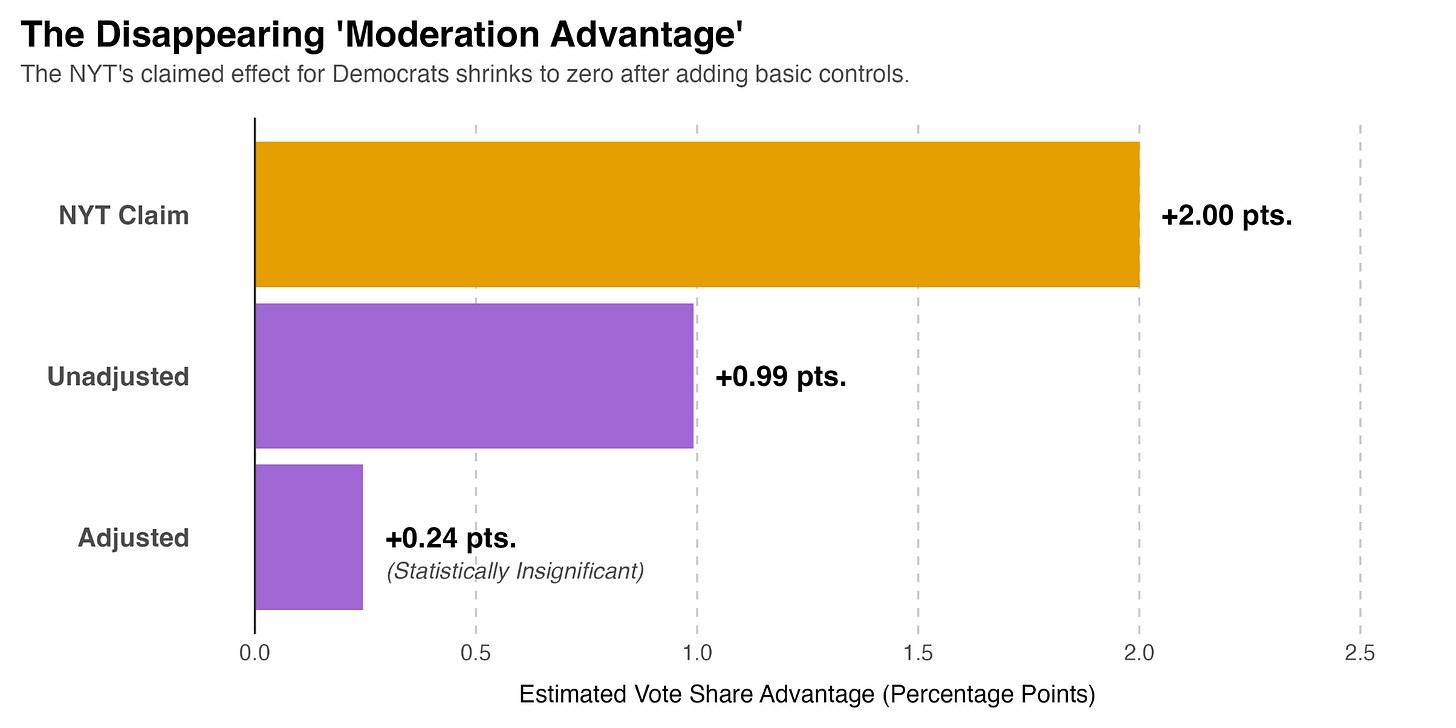
The small electoral bump the Times attributes to moderation isn’t a feature of ideology at all. It’s a phantom effect created by ignoring the two most powerful forces in American elections: fundraising and incumbency. When we apply even the most basic statistical controls, the “moderation advantage” disappears completely.
And he produces this graph:
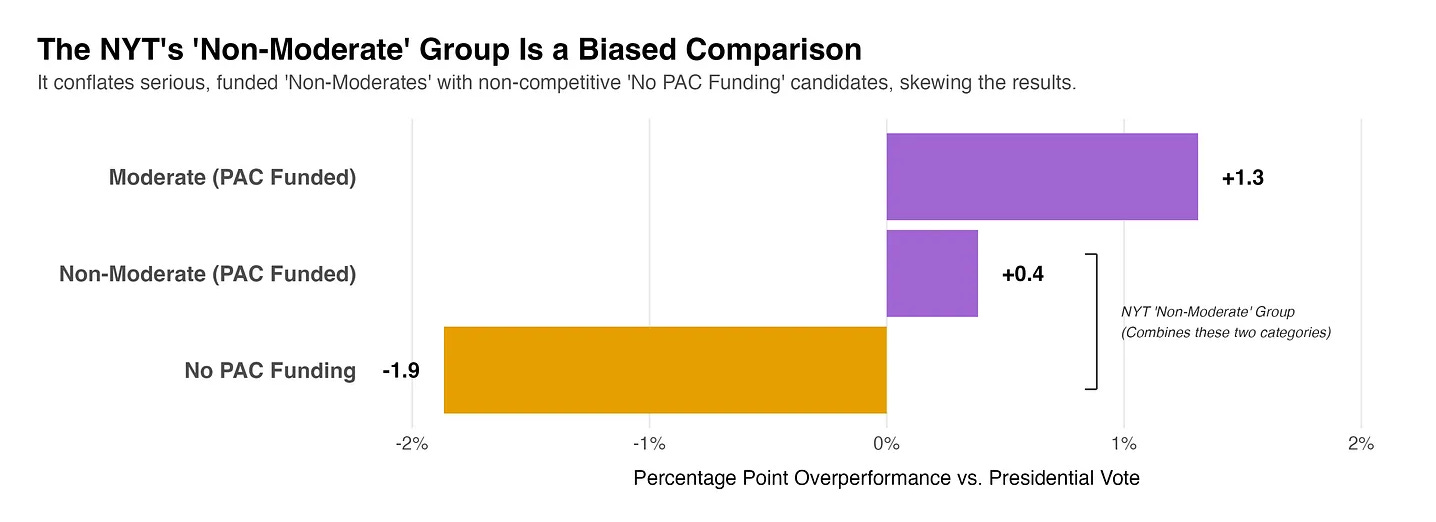
What the Ed Board has apparently done, according to Bonica, is to compare the performance of incumbent candidates who fundraise very well, and just so happen to be moderate, to non-incumbent challengers with weaker fundraising networks, who are non-moderate. This exaggerates the skill difference between the candidates. If instead you only compare the moderates and non-moderates who fundraise well, the supposed advantage the moderates enjoy shrinks from 4 points on vote margin to under a point:
Bonica’s findings mirror my own earlier analysis. When I looked at the Democratic candidates who ran for competitive House seats in 2024 and lost, I found no progressives. Every single Democratic candidate that lost a House seat by less than 2 points in 2020 had an empirical ideology score that is to the right of the median Democratic congressperson. These candidates did not lose because they weren’t moderate enough; they lost because they had other non-moderation problems that overrode the effects of their moderation: a bad political environment in rural-suburban seats, low personal fundraising ability, and a bad cultural match to the district.
The claim that I have made is not that moderation doesn’t matter at all, it’s that it matters a lot less than other factors so should not be the end goal of strategists.
Second, the Ed Board appears to have selected a strange empirical measure of moderation (which PACs endorsed each candidate) that produces much better results for so-called “moderates” than you’d get if you picked basically any other measure. Here’s another response from Bonica to the Times:
The editorial claims academic measures are disconnected from voter perceptions. Yet when we use data entirely based on voter perceptions (the Cooperative Election Study), we find no moderation advantage. In fact, measuring candidate ideology based on how voters perceive candidates showed the smallest effect size of any measure tested.
The issue isn’t methodological complexity. It’s that rigorous analysis—whether using various academic measures, voter perception data, or even the Times’ own PAC endorsements—consistently fails to show the large moderation advantage the editorial describes.
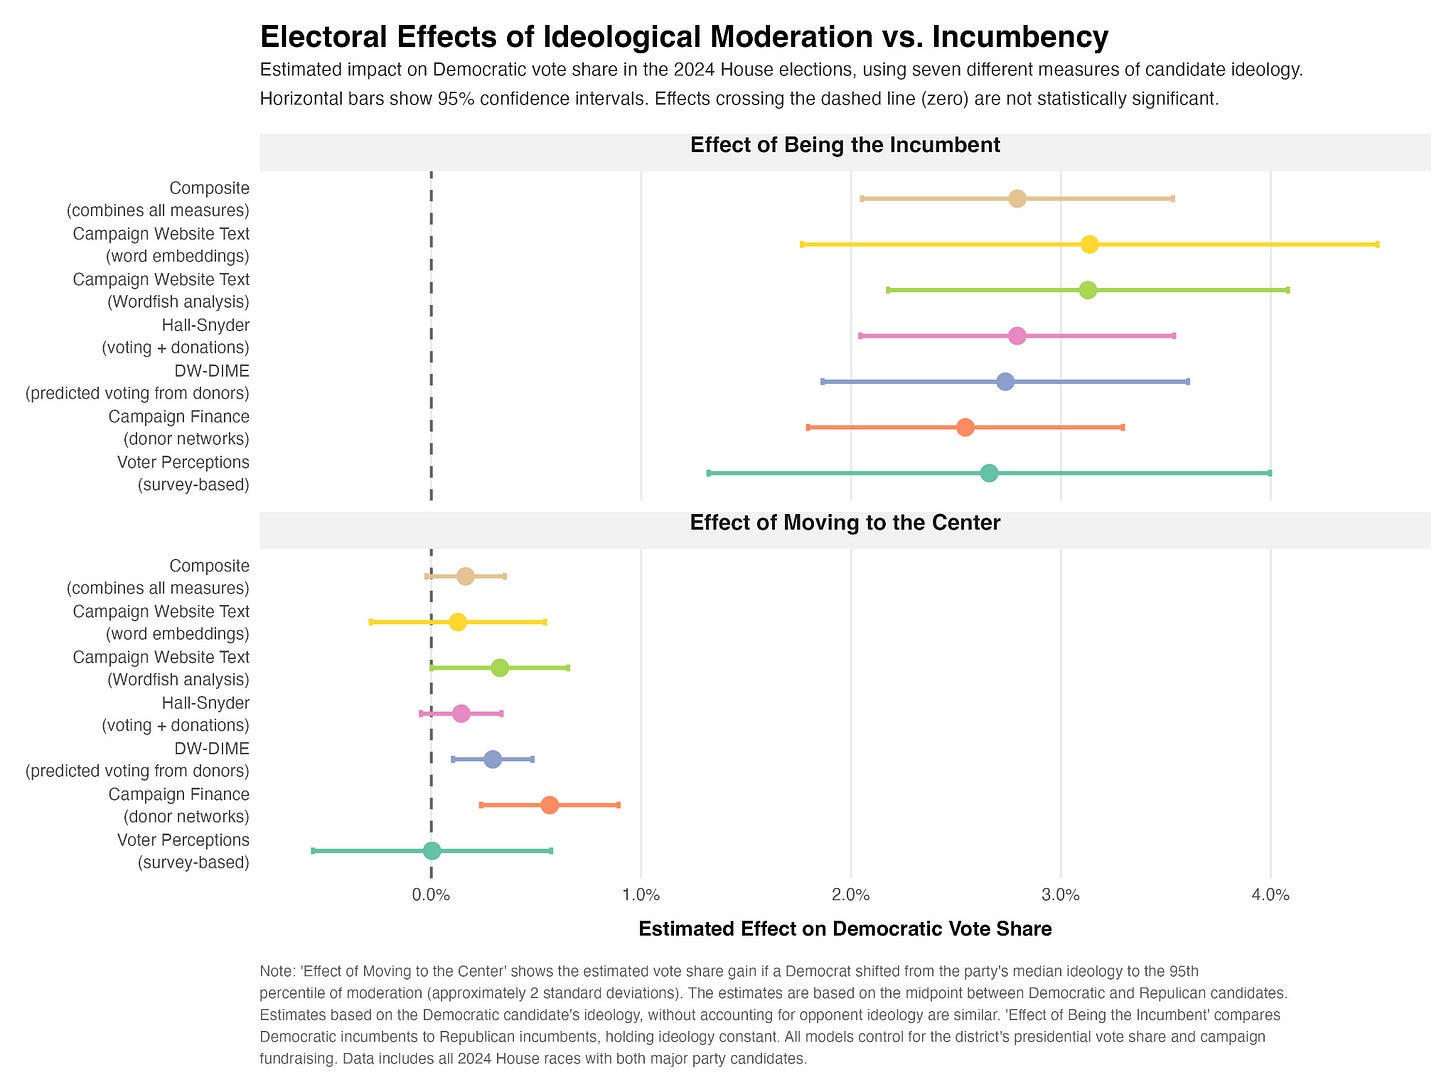
Here’s a graph of the estimated effect of moderation on candidate vote share when you measure ideology in different ways, compared to the effect of incumbency:
If you pick basically any agreed-upon empirical measure of ideology, you get different results than what the Times claimed. In statistics, we call this p-hacking.
Additionally, it appears that what the Times has done is, in fact, exactly what they criticized us for: using a messy metric that is detached from how voters actually view candidates. This is because the PAC fundraising variable is a very loose proxy for moderation. For example, if you actually put candidates into moderate/non-moderate buckets based on the PACs they received money from, then many of the Times‘ written examples (including Tammy Baldwin and Ruben Gallego) are sorted into the non-moderate bucket (they didn’t get PAC funds from the Blue Dogs PAC).
The third problem with their analysis is that the core dependent variable the Times is using — the difference between a House candidate’s vote share and Kamala Harris’s vote share in a district — is itself very biased toward moderates. This is because it conflates Harris’s performance with that of a “replacement-level” House candidate. The baseline in their analysis is not how House candidates do in absolute terms, it’s how they do relative to a progressive presidential candidate.
But Harris is not the replacement candidate in the counterfactual congressional election, another congressional Democratic candidate is! Democratic voters in suburban Michigan or southern Louisiana would never elect a candidate as progressive as Harris (or, for that matter, Ilhan Omar) for a House district; they would nominate a Democrat closer to the median Democratic congressperson. The better comparison for a purple seat is not the vote share of a progressive president, but a true replacement congressional Democrat.
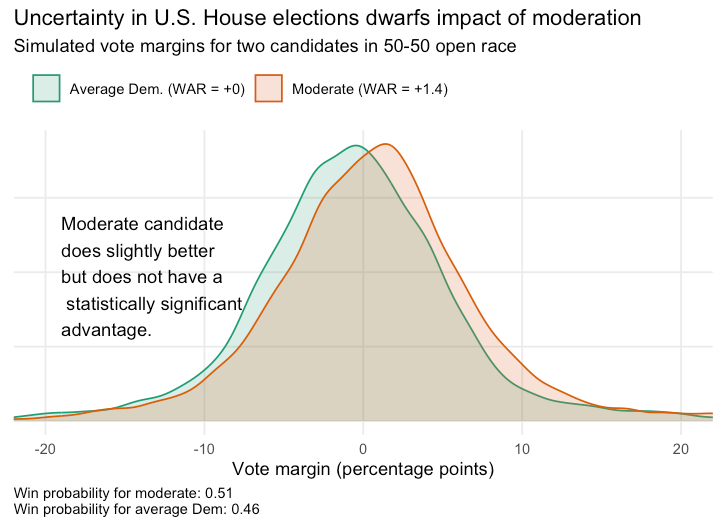
So, how would a real hypothetical play out? We put together a full Bayesian forecasting model for House elections to answer exactly this question. Our result is that the baseline that the Editorial Board and other analysts use is significantly biased toward moderates because of the faulty baseline. If you replace a moderate Democratic candidate with a new candidate that has an ideology equal to that of the average Democrat, their predicted probability of winning a tied race rises from 46% to 51%.
Maybe the Times disagrees, but I do not think a 5% increase in win probability is the transformative effect they are selling in their anlysis.
And if you don’t believe me on any of this, you can go and check the code I used to run this analysis, which I have made publicly available for purposes of replication. The other empiricists in this discourse have also published proof of their work, including Bonica as well as Andrew Hall and Daniel Thompson — two academics who, earlier this year, corrected a famous 2018 paper claiming large effects for moderation. They have since re-analyzed their data with new models and finer-grained results and retracted their claims, saying the effect of moderation “is far weaker than we previously thought,” and their earlier analysis “should not be relied on.”
Politics coverage rooted in data, not spin.
Mainstream coverage of politics is lost in the noise of partisan spin and an understanding of elections found in Government 101, not reality. Here at Strength In Numbers, I explain our world using hard data and statistical analysis. SIN offers members exclusive journalism that goes beyond headlines to reveal how voters truly make their decisions — and covers what the media is missing.
Get premium independent, fact-based political journalism with a paid membership to Strength In Numbers today.
II. Voters don’t think about elections the way elites do
Now, let’s zoom out a little bit. A bigger problem with the Times’ argument — with this whole debate about ideological moderation, really — is that they are assuming that the average American voter is thinking about parties and politics in the same way that they are. But we know the way that elite political strategists think is not the way that the average voter works.
The operational model of voter psychology among the pundits and mainstream press is that voters make their decisions based on a rational analysis of their own priorities and the major parties’ policy platforms. When strategists say Democrats have an unpopular position on x and need to moderate on y to win, they are implicitly pushing an overly mechanistic view of voting onto the public that assigns all the weight in voters’ minds to matching up their own dearly held policy preferences with those of the parties, completely ignoring the other forces acting upon voters.
Yet empirical studies show that upwards of just 10% of voters have a coherent mental model of where the parties stand on most issues. The vast majority of the public has no sense of political ideologies, are “group-interested,” or are “nature of the times” voters, to use Philip Converse’s old categories. Simply put, most voters cast their ballots based on pre-conceived preferences and identity, on information from their friends, or as a reaction to how the economy is doing.
Additionally, much political science finds that when it comes to their attitudes on the issues, voter are very fickle. People change their policy preferences based on input from party leaders, and also seemingly at random across surveys. The mass public is not as ideological as the people who read The New York Times — or, frankly, this Substack.
“Strategic moderation” is a strategy to win the 10% of voters who understand what a “moderate” and a “progressive” is. It is not a strategy that meets most voters where they are.
The view from the Times Opinion floor in Manhattan completely ignores that voters base their decisions on something other than a list of policy preferences. Perhaps inflation had something to do with Donald Trump’s victory in 2024, for example. But you wouldn’t know that based on the paper’s editorial, however, since prices and inflation are not mentioned a single time in their diagnosis of Democrats’ struggles last cycle. Not a single time!
The problem here is that the Times is using an archetype of voters that does not exist. The median voter imagined by the collective hivemind at the Times Editorial Board lives in an isolated, experimental laboratory — not here in the real world.
In many ways, the Times and the people it agrees with have made this a debate among elites, for elites, with very little bearing on the research about why voters actually vote. I and others have tried to push us closer to the real world, instead of the mechanistic hypothetical where the Democratic Party is just pulling on a lever marked “moderate!” to improve party performance. And I have especially tried to inject any acknowledgement at all of uncertainty into this discourse, with apparently few takers.
III. Personal gripes with the Times
Finally, and least importantly, I’m rather annoyed that the Editorial Board linked to several criticisms of my work on this subject — including one in which the author, the blogger Matthew Yglesias, admits he didn’t even read my piece! — without asking me for comment. This seems like the minimal commitment a journalist should make when trying to adjudicate between competing claims about reality.
The Times also did not link to any of my published work on the topic, which I view as both a biased linking practice and also a missed opportunity for understanding my real disagreement with people like Matt. I think I made some good points!
Instead of reading my analysis, the Editorial Board appears to have simply dismissed it as “progressive” and hard to understand. Lumping me in with some other academics they disagree with, the Editorial Board writes:
“[S]ome progressive analysts and professors say [moderation] has little effect. The debate involves statistical complexities that are difficult for most people to follow. The researchers making that claim rely on data about candidate ideology that can have little connection to voter perceptions… The data ends up being so messy as to produce bizarre results.”
In an empirical debate, I don’t think you get to dismiss arguments because they are “statistically complex” and inconvenient for your stance. Let’s recap the way this debate has unfolded: High-profile pundits and some analysts in the party have said moderation is the only way to win elections. I — and others — have said that the effects of moderation are very small if you account for variables such as fundraising and incumbency, so focusing on moderation is not a silver bullet. In response, the Times calls us progressive and our data divorced from reality.
So the Times gets to write whatever it wants with no burden of proof. What they say is right, and what their critics say is too progressive to consider. Huh?
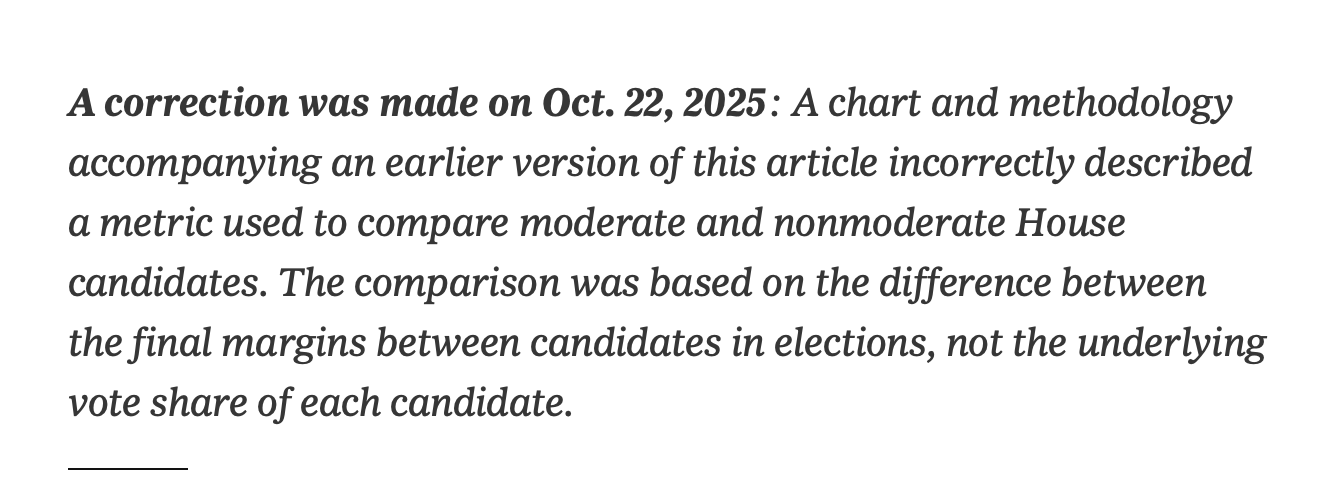
The Editorial Board, by the way, had to issue a correction to their original article because it made a rudimentary math mistake that double-counted the effect of moderation in its analyis/presentation.
I think this is a very important debate with consequences for both the future of the Democratic Party and democracy in America. I do not think that the way the Times has engaged in it enhances our understanding of the subject.
What you missed at Strength In Numbers
Subscribers to Strength In Numbers received four articles over the last seven days:
My regular Friday post, about Trump losing the Republican Party’s edge on the economy:
My premium Tuesday article, with answers to the October subscriber Q&A:
Last Sunday’s data roundup, with commentary about the government shutdown and why I think Democrats are looking at the polls too much:
And a special newsletter from last weekend, counting the attendance at the Oct. 18 No Kings Day protests:
Every day is a good day to become a paid supporter of Strength In Numbers. You get extra premium posts at least once a week (and, lately, more like 2-3x a week), an early look at any data products I’m developing, access to a private Discord server just for paid members, and more. Paying members also support all the work that goes on behind the scenes to put together the SIN/Verasight poll, my state and congressional district MRP models, and all the other analyses that power my journalism.
Even more numbers!
I’m on the way to a weekend camping trip in Shenandoah National Park, so I only had time to collect a few other links this week:
Here’s a survey of people who attended the No Kings rally in DC, which I think is an interesting research/reporting tool for these.
Gabe Fleisher at Wake Up To Politics shows that Trump has withdrawn a record number of nominees this year.
Blueprint polling shows it’s Trump’s economy now
Gallup has Congress’ job approval rating at just 15%
The redistricting ballot initiative in California is likely to pass, according to this CBS News poll
Polling update
The Strength In Numbers polling averages have moved to a new webpage at fiftyplusone.news, a website purely for poll-tracking that I’ve set up with my friends.
Trump’s approval is -13.
The generic ballot is D+3.
The Democratic candidate is up 9 in the Virginia governor’s race.
The New Jersey governor election is D+6.
That’s it for your major political data stories this week.
Got more for next week? Email your links or add to the comments below!
Have a nice week,
Elliott



Bravo. Excellent work. 👏👏👏👏
The NYT is often wrong. More and more often. Your points about the ways they are wrong in this instance are spot on. I hate the phrase "lie w statistics" but that show seems like their goal here