

What if America used ranked-choice voting for presidential primaries?
Plus: an update on non-voters; the secret sauce behind my polling models; and updating my list of political biases and how I account for them. This is the Strength In Numbers November 2025 Q&A.

Dear everyone,
Welcome to a special Thanksgiving week edition of the Strength In Numbers monthly Q&A! Thanks to everyone who submitted items for this month’s installment. I have selected eight questions that were most topical and that will provide the most value for the full audience. You can send questions for next month to me via email (questions[AT] gelliottmorris< DOT>com) or leave them in the comments of this post.
In this installment, I answer reader questions like...
How do your polling average models work?
What would ranked-choice voting in the Democratic Party look like?
Are election results driven more by turnout or persuasion?
How do you ensure your biases don’t influence your work?
Do non-voters still lean toward Trump?
Let’s dive straight in. As usual, the Q&A will be paywalled about halfway through as an exclusive for paying members of Strength In Numbers. Premium subscribers get tons of benefits, including exclusive analysis weekly and early access to new data products. You can sign up to read the full version here:
Does a universe of “all potential voters” still lean Republican?
Doug asks:
I often see people comment that, had the tens of millions of folks who didn’t vote in the 2024 presidential election submitted a ballot, then Harris would have won. Are there data that support this? I seem to recall a poll (maybe by Pew) earlier this year which found the opposite to be true, that Trump would still have won.
Apologies if you have covered this ground before (I’m a pretty new subscriber) and thank you for all that you do to present and interpret polling data.
First, thanks for joining us here at SIN, Doug!
My answer is that had everyone voted in 2024, Trump likely still would have won. As Doug mentions, an analysis of voter file and survey data from the Pew Research Center in early 2025 found the opposite. According to Pew, survey respondents who did not vote in 2024 favored Donald Trump by four points, 44% to Kamala Harris’s 40%.
This was a big shift from previous elections, when non-voters favored Democrats. Hillary Clinton’s lead was large enough with non-voters, for example, that she very likely would have won in 2016 if everyone had turned out.
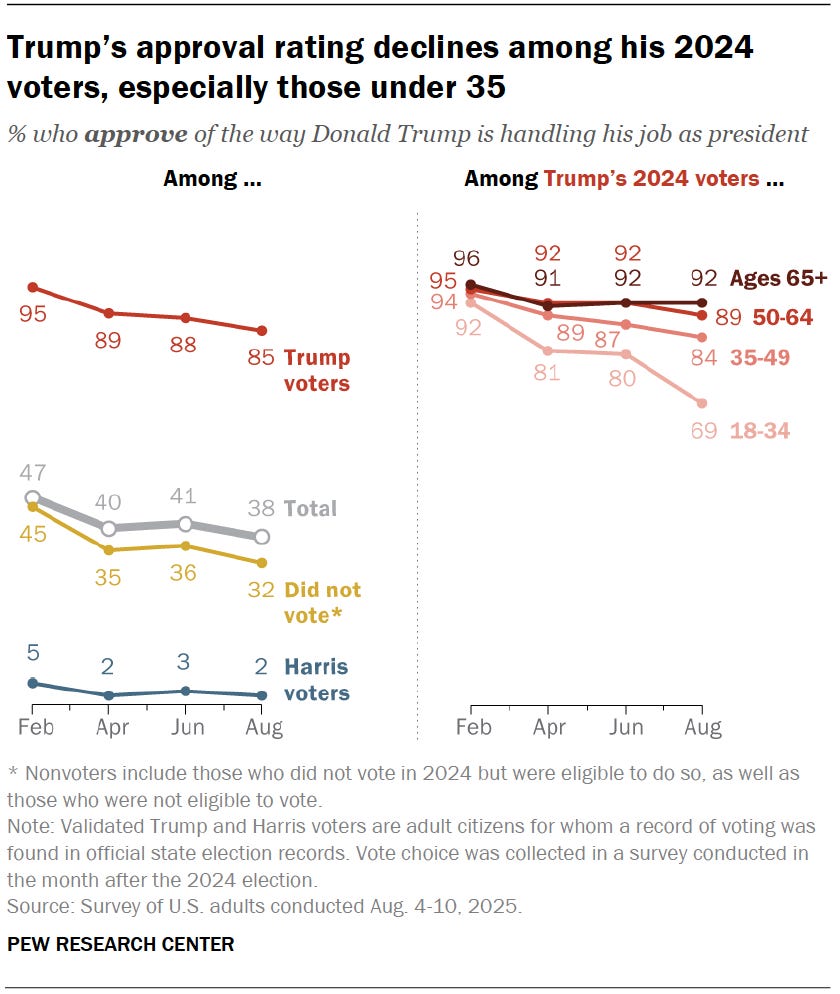
But it looks like opinion has shifted since 2024. In August, Trump’s job approval rating among 2024 non-voters was down to 32% compared to 45% when he took office, according to Pew:
And in the 2025 elections, 2024 non-voters who turned out went for Democrats by 25 points across Virginia and New Jersey. Even if there are turnout effects there (Trump-leaning non-voters staying home), it’s not large enough to account for the entire change in behavior among the group.
This is a good reminder that nothing is forever in politics. That goes for the authors of the 2002 book The Emerging Democratic Majority (quite a blunder, with the benefit of hindsight) and the Republicans who alleged the 2024 election showed voters had fundamentally realigned to the right. This turned out to backfire on them pretty badly, too.
Actually, the takeaway here is two-fold. First, yes, nothing is forever in politics — AND, one point does not a trend make. Future voter behavior is uncertain. Maybe non-voters will drift back to the right. Or maybe it’s all the vibecession, stupid.
How I handle different populations when averaging polls
And now, two questions on how I average polls. Bruce S asks:
Polls seem to either poll likely voters or registered voters. Could you explain what the advantages versus disadvantage of each group is and whether it makes any significant difference as the elections get closer. In other words do polls using likely voters become more accurate the closer to an election we get or do both poll types simply become more accurate at about the same rate?
And Lowell asks a similar question:
After FiveThirtyEight went off the air I started following a presidential approval graph produced by the New York Times that claimed to use the same methods as 538 was. That was until I discovered the graph produced by your new site, FiftyPlusOne. Though the two sources make reference to the same polls and have a similar appearance, FiftyPlusOne consistently shows an approval Gap if it is two to three points greater than the one shown by the Times. For example, the NYT currently shows Trump’s net approval at -14.0 as opposed to -16.1 at FiftyPlusOne. What is FiftyPlusOne doing that is different from what the New York Times is doing and why do you believe that the the FiftyPlusOne methodology is more accurate?
These are good questions. For the wider audience, the 50+1 methodology is explained here.
For Lowell, the simple explanation is that (for presidential approval specifically) the FiftyPlusOne methodology adjusts polls back to the population of all adults, whereas the Times average takes all data as-is. When there’s a big difference in attitudes between registered voters, likely voters, and all adults, our adjustment manifests itself as a difference across the aggregators (since the NYT does not make the adjustment we make).
Today, registered voters are both (1) much more likely to have an opinion about politics (so we get a lower percentage for “don’t know” in the poll) and (2) slightly likelier to approve of Trump, relative to the population of adults. So when we adjust polls back to the adult population, we end up subtracting about 2 points of net approval from Trump.
We make this adjustment because the population “all adults” is the reference population in the historical data from firms like Gallup and Pew. Since we spend so much time comparing presidents across history, we want to make sure the comparison is apples to apples. If we did not make this adjustment, then in our historical analyses (such as a regression predicting presidential vote shares as a function of presidential approval ratings) the predictions could be biased up or down in ways the model didn’t know about. If you have a basketball league of a bunch of sub-six-foot dudes and predict their free-throw rate as a function of their height, and then add a seven-foot-four French dude, your training data isn’t going to make an accurate prediction for him.
For what it’s worth, this is not a partisan thing: Biden’s approval rating among all adults was also lower than his approval among RVs/LVs. It seems like these days the adult population tends to disapprove, and say “don’t know,” and higher rates than RVs and LVs, regardless of who’s in power. This is what we would expect given anti-incumbent bias resulting from economic anxiety.
For averages of election polls, I adjust the data toward the level among likely voters, not all adults or RVs. This is one thing that I think led our averages in Virginia and New Jersey this year to be more accurate than averages from competitors. Likely voter polls tend to be more accurate at predicting elections than registered voter polls because not all voters vote, and those that do tend to lean toward one party or the other. (This is because persuasion and turnout are correlated; parties that do better at persuading people to vote for them also do better at persuading people to turn out to vote at all.)
Here’s a good general framework on populations: When we are making characterizations of “the average American”, we should try to use polls among all adults (sometimes called “gen pop” surveys). When we are predicting elections, likely voter polls are best. If it’s many months before an election, but you want to characterize the opinion of voters, then a registered-voter poll is a good option, too.
What if America used ranked-choice voting for presidential primaries?
Rick asks:
Is it possible to model what would have happened in the 2020 Democratic Primaries if we had ranked choice voting? Alternatively… what about modeling proportional allocation of delegates as another path, or even a proxy for ranked choice?
I love it when a question lets me revisit my past work!
I answered this exact question for The Economist back in February 2020. We asked Democratic respondents to a national poll to rank the candidates for the Democratic nomination, and then simulated what the rankings would look like at each round. We found that left-leaning voters exhausted their ballots (they didn’t rank every single option, so their vote got discarded early after just a couple rounds or ranking) early, which would have ended up in Biden beating Warren in a 53-47 final round:
Of course, this is what a nationwide Democratic primary using ranked-choice voting would have looked like. In reality, the “primary” is multiple primary elections that take place successively across many states. And adopting RCV is not likely to change the federalist nature of the Democratic primary: the one current proposal in front of the Democratic National Committee keeps the state-by-state system of primaries and caucuses.
The state-by-state nature of presidential primaries creates a chaotic path dependency that increases the importance of otherwise rare and seemingly inconsequential decisions. In a nationwide ranked-choice primary, the opinions of a local community leader in one state don’t really matter. But in a state-by-state primary, they do, since those delegates could be the ones a candidate needs to prove they are viable in the general election. RCV probably doesn’t fundamentally alter the chaos inherent in modern primary systems.
This is all, by the way, very unlikely to actually happen. For the DNC to change its rules and allow ranked-choice primaries, it would need the support of the DNC’s rules and bylaws committee and a majority of the 450-member national committee. Many states would also need to amend their election laws, since states regulate the way parties hold primaries, and many states prohibit ranked ballots.
But the ranking does tell us about the ideological “lanes” of the primary electorate. It will be interesting to do this analysis again in 2028 and see how the results change!
A list of my political (and other) biases
Bruce says:
[In a recent podcast, Nate Silver] complained about [you] having a political bias. I hope [you] will address that issue sometime in one of [your] future articles. I think everyone has some form of bias politically and pollsters should at least check their processes and tell us what they think are their bias and how they address these bias in their polling. I know my bias are very anti-Trump, anti-oligarch, anti-trickle down economics, and pro education and science to name a few.
For starters, I don’t think Silver was being particularly fair in his critique (if you could even call it that). Silver is not exactly what I would call a reliable narrator when it comes to commenting on his competitors, and he has always had it out for me in particular (stretching all the way back to blocking me on Twitter in 2020 after I published a competing election forecast model to his). If I had to guess, he probably also blames me for ABC firing him in 2023.
But I also found this specific critique pretty weak. Nate says I make methodological errors in my analysis of ideological moderation, but doesn’t say what they are and instead just dismisses me as a partisan. It’s very convenient for him to paint his competitors as ideological and throw mud without engaging in honest criticism. In my opinion, that’s a real shame, since he’s very good at statistics (not a real Bayesian, though) and probably would have something to add to the discourse if he actually did the work.
But enough about that. In the spirit of the Q&A, I’ll answer the question about my biases. We all have our own, and it’s only fair to readers that you know what they are. Plus, I don’t really hide my priors, so it’s not like I’m divulging state secrets here by rehashing some things and combining some others.
Like everyone, I have important personal and professional identities putting pressure on my ideological priors. To name a few:
I was born into a working-class family as one of four siblings.
My mother was an elementary school teacher, and my father did a lot of different things, including working as a fishing boat captain, merchant marine, and on one of the ships that helped clean up the Deepwater Horizon oil leak in 2010.
I was raised in rural towns in Central and South Texas, where lots of people were on government assistance, and the town gave generously to local educational initiatives.
I was able to afford college because of scholarships donated to me by various business leaders around town, for example.
My parents were apolitical, or at least shielded us from politics as kids. I have a vague impression from my childhood that my dad was anti-war in general and especially opposed the invasion of Iraq, but otherwise have few political memories.
Later, when I was a teenager, I remember my dad telling me that Barack Obama was “the best president you’ll ever have.”
While I do not consider myself a formal political scientist or statistician, I do often say I “have a foot in both worlds” and am heavily steeped in empirical social science.
This metaphor breaks down quickly because I also consider myself as “having a foot in” journalism and political polling. (I do not have four feet.)
I read most of the classics of Western political theory for my first book, as well as a good chunk of 20th-century survey-based sociology, psychology, and political science.
I am, of course, a pollster and a journalist.
I have a wife whom I love and respect, and we are hoping to have kids soon, too.
