


I have a short bonus post for you today about some important new polling data on party affiliation from Pew. I’m still on paternity “leave,” but the data gods keep smiling down on us, and you know I have some code to make cool charts already written and lying around… uh it’s here somewhere.. I swear I just had it.
This post is free to read, but it was not free to produce. Strength In Numbers is an independent and reader-funded small business devoted to making you smarter about politics using data. Paying subscribers get premium posts, access to an online community, and support the data collection and analysis work that powers analyses like this one.
The vibe has shifted back to the left.
Every year, the Pew Research Center conducts a large, national poll of U.S. adults to measure key partisan attitudes and other population characteristics that are useful for public opinion researchers. The National Public Opinion Reference Survey (NPORS) is fielded predominantly by mail (people can respond online, but they get invites mailed to them) and has a response rate of 30% — around 20-30x higher than your typical poll. That makes the results very reliable and (in theory) less subject to things like partisan non-response bias.
Pew on Tuesday, July 14 released their 2026 vintage of the NPORS. Most people are focused on shifts in the topline and among young people, who have moved left again. Pew finds 47% of adults now call themselves Democrats, 43% Republicans, and 10% Independents. Pew produced these graphs you might want to grok:
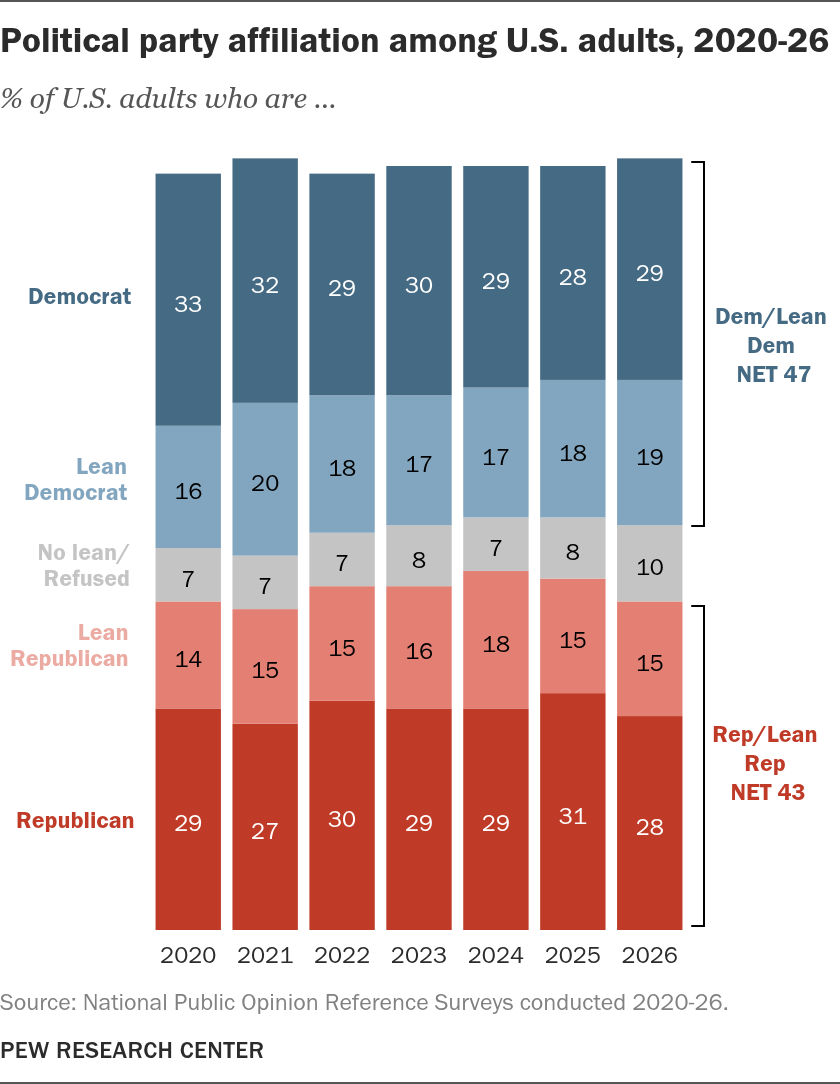
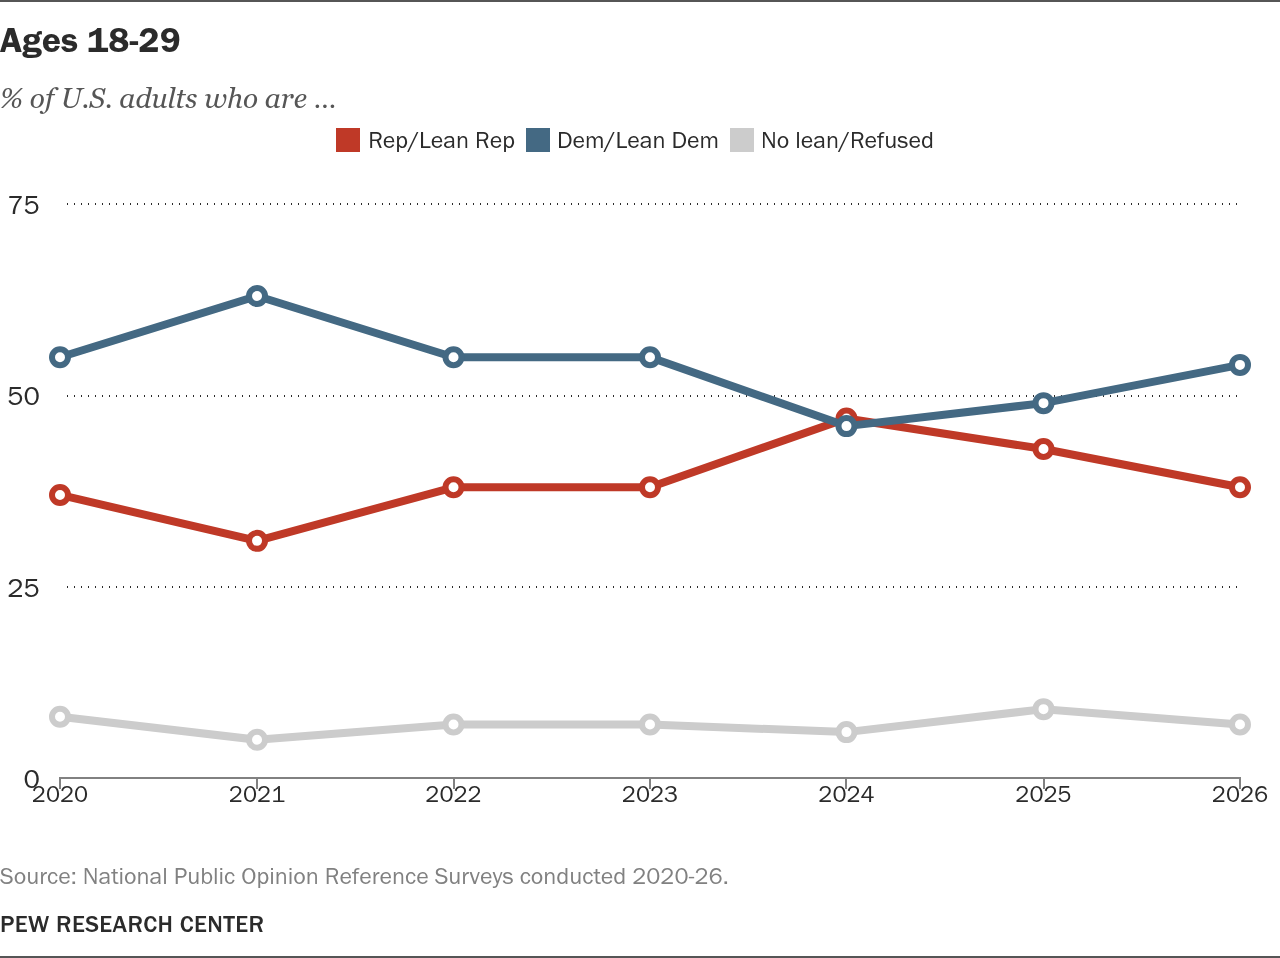
As mentioned, Pew finds a particularly large rebound in party ID among young people, who are heading back to their pre-2024 levels of Democratic Party loyalty.
This is in itself a big story. While party elites and strategists in Washington, DC, have been assuming young Americans are the dominant pro-Republican force that landed Trump in the White House in 2024, the data have been moving against them. The country now looks more like it did in 2020, when Trump lost to Joe Biden by nearly 5 points in the national popular vote, and Democrats won 50 seats in the U.S. Senate.
But hey, this is Strength In Numbers! You know I’ve got a take nobody else has pointed out yet. Where’s the messy graph with Elliott’s theme instead of Pew’s? Well, have I got a treat for you…
As I mentioned, Pew conducts the NPORS largely as a public service for other pollsters. Their estimates of traits such as but not limited to party ID are useful to pollsters (like me! Thanks Pew!) who adjust their samples based on party ID.
Part of this public service is releasing the actual raw respondent-level “microdata” that constitute the survey. We can use that microdata to uncover more stories about the electorate. Even better, we can gather all the raw NPORS raw since Pew started running the survey in 2021! Chart-making ensures.
The story I want to show is about non-voters. Specifically, they have moved back toward Democrats in a big way.
Remember that Pew and others found in 2024-2025 that people who didn’t vote in that election likely would have supported Trump if they had turned out. This was a big shift since 2020 and 2016, when non-voters leaned toward Democrats.
At the time, people gave two explanations for this finding. One was that “low-propensity” voters had become much more conservative and open to Trumpism, especially on immigration policy. The other read — from people like me — was that the group was likely being moved instead by anti-incumbency bias, or “retrospective voting” as political scientists call it. Non-voters, under this theory, moved against Biden because of inflation and residual COVID trauma or whatever, just like the rest of the population, and would drift back toward Democrats as they saw what Trump 2.0 would look like.
Well, that is exactly what had happened. I was writing about non-voters shifting left as early as May 2025 and again last September. Now, Pew’s 2026 NPORS data backs me up: While non-voters leaned Republican by party ID by 4 points in 2024, they now lean Democratic by +12.
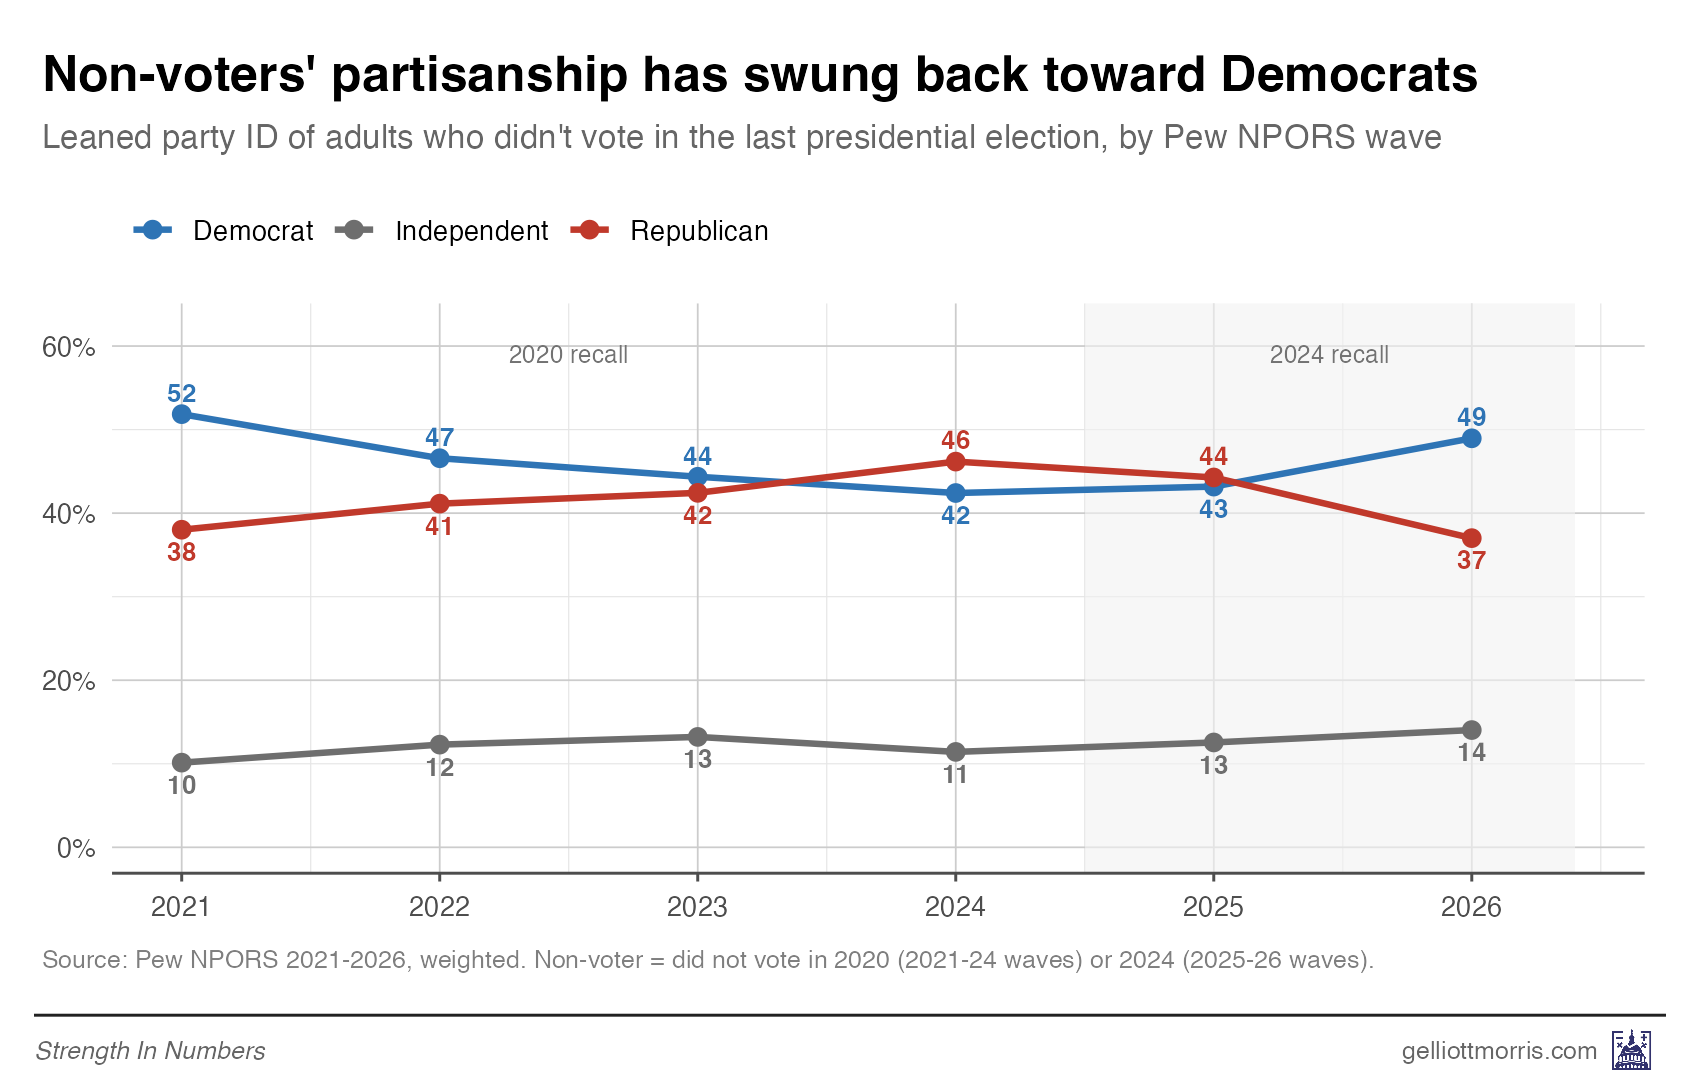
The Democratic lead in party ID now rivals what it was in 2020-2021, both overall and among low-turnout voters.
There’s a good lesson here not to overreact to short-term changes in American politics, as measured by election results. Winning a group in one year, under particular circumstances, does not mean you have won that group forever — and often the reasons given for winning are not correct.
I could write lots more about people reading too much into election results, but we’d be here all year. For now, let me know what other findings stood out to you in Pew’s new data or other coverage of it. I’ve personally got another wonky post cooking for the Data Lab about how weighting to past vote and party ID affects survey toplines. My MRP modeling, for example, takes Pew’s NPORS microdata as an input, and the new update would have shifted toplines if I hadn’t already predicted that party ID had moved to D+4!
If that’s the type of thing that interests you, get subscribed — and consider funding more work like this with a paid subscription.
The lesson of this, that low-propensity voters are shifting back to supporting Democrats, is that it will be more important to get those voters registered and get them to the polls. So the “ground game” of door-knocking and registration drives will become more important, and Trump’s efforts to make it more difficult to vote will be more of a threat.
The consistent and encouraging undercurrent here is that maybe, after being battered and bruised enough times, maybe some of the people who really, really thought that Trump loved them and would protect them and be loyal to them, have caught a clue that perhaps he is not the savior they wanted him to be.
The burned hand teaches best.
I hope that scar aches long enough that they make better decisions and then vote in November.