


Soooo, wazzup with the race raters?
As of publication, the three big election handicappers have the race for U.S. House as a pure toss-up and the Senate leaning Republican. The Cook Political Report currently has 206 seats at least leaning Democratic, 208 at least leaning Republican, and 21 tossups. Inside Elections has 200 Democratic, 202 Republican, and 33 tossups. Sabato’s Crystal Ball has 210 Democratic, 203 Republican, and 22 tossups.
Read literally, that implies Democrats need to win the lion’s share of seats rated “tossup” to carry the House: 12 of Cook’s 21, 18 of Inside Elections’ 33, 8 of Sabato’s 22. By “read literally,” I mean if you assume “tossup” means a 50-50 chance of going either way, Lean means something around 70-30 for the favored party, Likely 90-10, and Safe 97%+. The Democrats’ climb to a majority is even steeper if you consider they have more seats in the Lean Coulmn.
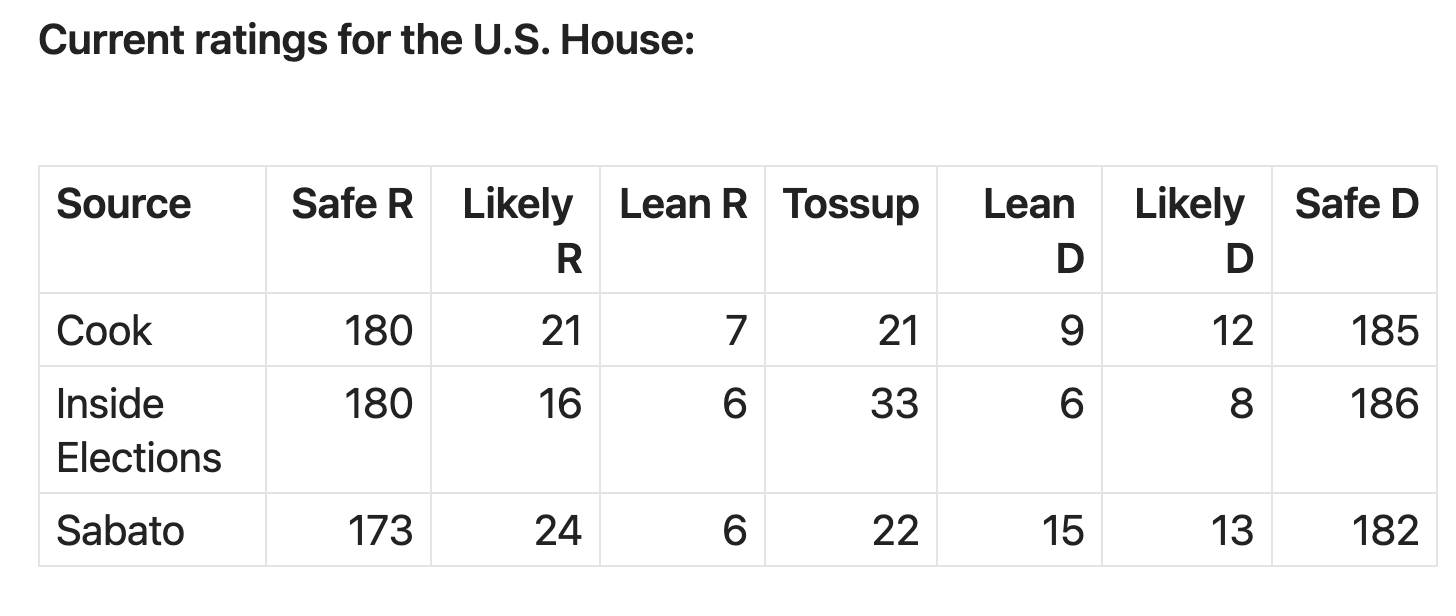
This is despite Democrats being up by 7 points in the House generic ballot among likely voters, and posting even larger overperformance in district polls and special elections. Our model at FiftyPlusOne has Democrats at a median of 238 House seats and a 98% chance of the majority.
What do the race raters know that we don’t?
I’ve been taking a deeper dive into race ratings for an analysis yet to come at FiftyPlusOne soon. But for this Chart of the Week, I wanted to share an important finding here based on the historical performance of the race raters. And that is this: since 1990, race raters have badly overestimated support for the incumbent party in midterm elections. When they say “tossup,” historically, those races break overwhelmingly for the out-party. This equates to Democrats being likely to win about 70% of current tossups.
If you like the free version of SIN, consider becoming a paying subscriber to get access to our private community and additional premium analysis at least once weekly. Paying members of this community keep Strength In Numbers running by supporting the time and data collection it takes to do analyses like this one.
Raters have a durable pro-White House bias in midterms
I took the historical race ratings database that powers part of the FiftyPlusOne election forecast, subset it to ratings given in midterm years as of 45 days before Election Day, and analyzed how often races in each rating bucket were won by the party in control of the White House. These ratings show a durable pro-White House bias.
For example, 45 days before the 2018 election, the Cook Political Report rated 28 House contests in Republican-held seats as tossups. Democrats (the out-party that year) went on to win 23 of them — a win rate of 82%. Of tossups!
That year, of the 27 seats Cook called Lean Republican, Democrats won 5, and of the 26 Likely R seats they won 2. Every one of the 22 seats Cook rated Lean D or Likely D stayed Democratic.
This is a big calibration problem. If you read the probabilities generated by the raters literally, seats rated as tossups should go to the parties at roughly equal rates; win probabilities of about 50%. But over the long term, this is not the case.
Here is Cook’s House record across the 2010, 2014, 2018, and 2022 midterms, using each seat’s rating as of 45 days before the election and recoding every label as favoring the “in-party” (the president’s party) or the “out-party”:
Safe in-party: the in-party won 100% of 311 seats.
Likely in-party: 88% of 69.
Lean in-party: 78% of 86.
Tossup: the in-party won 33% of 131. The out-party won 67%.
Lean out-party: the in-party won 5% of 37. The out-party won 95%.
Likely out-party: 0% of 73.
Safe out-party: 0% of 395.
Two things stand out here. First, we should expect Democrats to win a lion’s share of the races Cook currently labels as tossups. And second, there is a pronounced asymmetry in the ratings curve; A “Lean” label that holds 78% of the time when it favors the president’s party and 95% of the time when it favors the opposition is not a symmetrical probabilistic statement.
And I don’t mean to pick on Cook; other raters have the same bias. Inside Elections’ Lean in-party seats have held 69% of the time, Sabato’s 72%. All three give the out-party 67% of tossups. All three hold their Lean out-party seats 95% to 97% of the time.
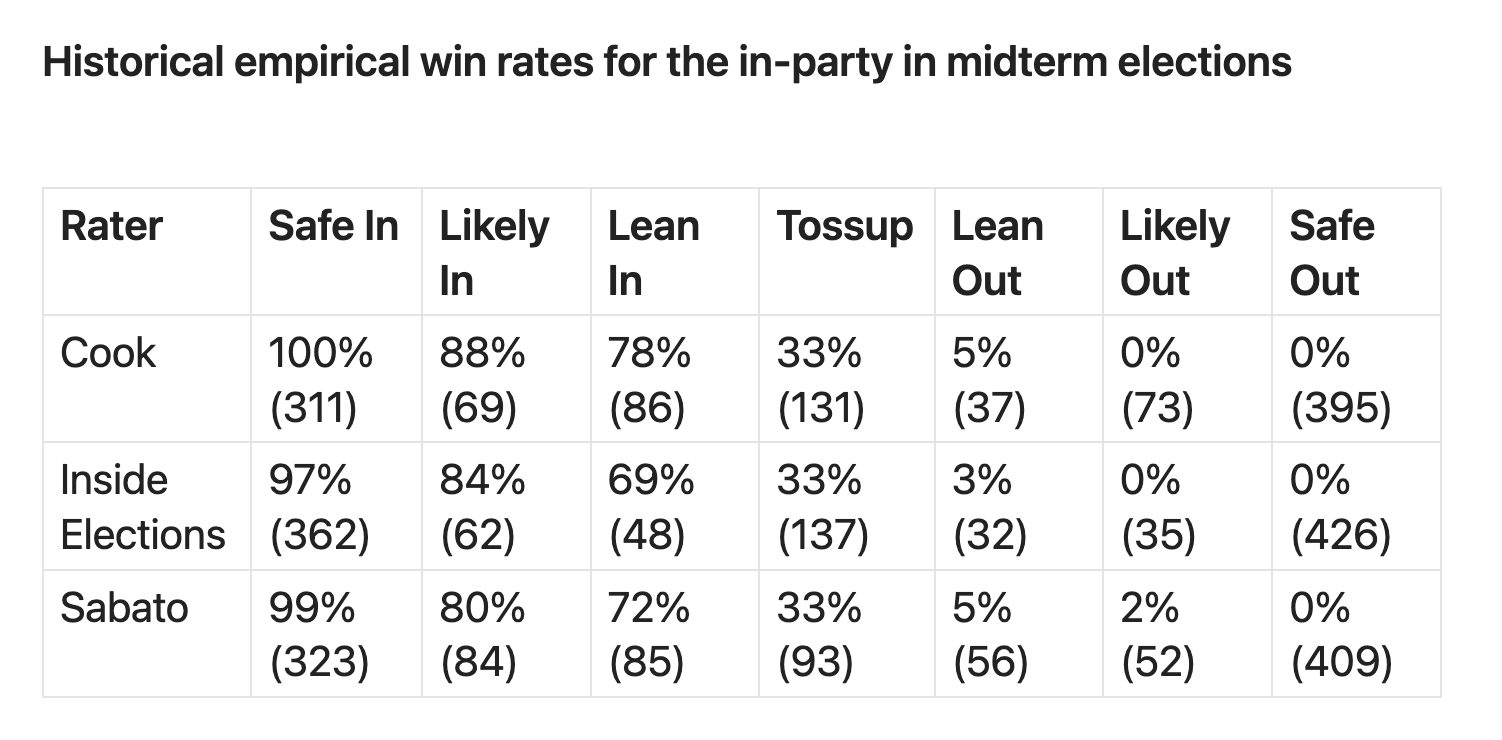
You can see that all the race raters have the same problem. The out-party wins the lion’s share of races that, at 45 days out, experts say are toss-ups or only “lean” toward them.
And this is mostly not a problem that the quantitative models have. Will write more about that next week.
Debiased expert ratings suggest Democrats are 83% to win the House
So we can be reasonably sure the race raters are underestimating the Democrats — at least in the House, if not the Senate too. A useful exercise is to compare the picture of the national House race that is implied by a literal, symmetrical reading of the race raters’ current seat-level forecasts, with the one that you get if you adjust for their endemic underestimation of the out-party.
Today that literal reading gives Democrats 217 seats on Cook’s ratings, 217 on Inside Elections’, and 220 on Sabato’s. Average the three, and you get 218 seats — an exact toss-up for control of the House.
But when we adjust for historical bias in the ratings (the table above), the picture changes dramatically. If we calculate the mathematically implied seat total for Democrats using the empirical historical probabilities of the out-party winning seats in each rating bucket, the number rises from 218 to 228 on the three-rater average. Cook’s own record moves Cook’s total from 217 to 224.
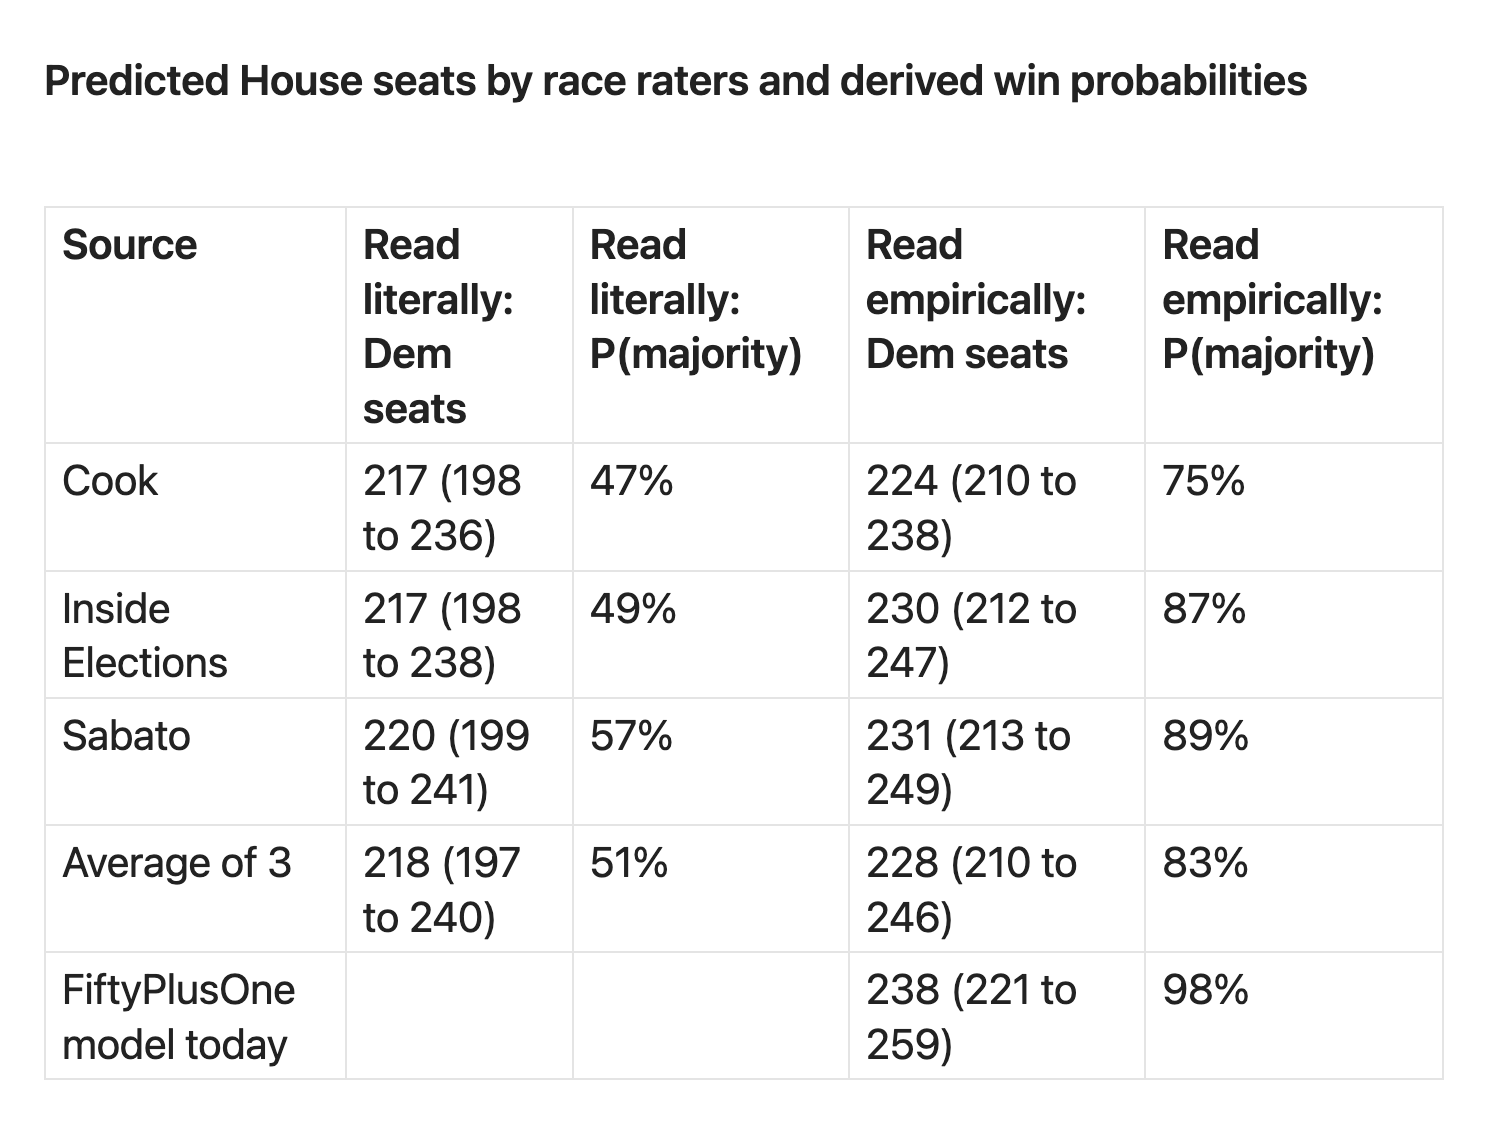
A gain of ten seats may seem small, but it is a huge move in terms of probabilities. I wrote a program to simulate potential error in the race raters’ forecasts based on their historical misses, and then see the distribution of seat totals we might end up with given those errors, and the results are notable. (A description of this program can be found in the footnotes.)
If you assume (wrongly) that Cook et al.’s probabilities translate symmetrically to outcomes, today their forecast is 217 seats for the Democrats and a roughly 47% chance of winning control of the chamber.
But if you assign each seat to the Democrats or Republicans using the win probabilities implied by Cook’s historical errors, that seat total is 224, and the win probability is 75%.
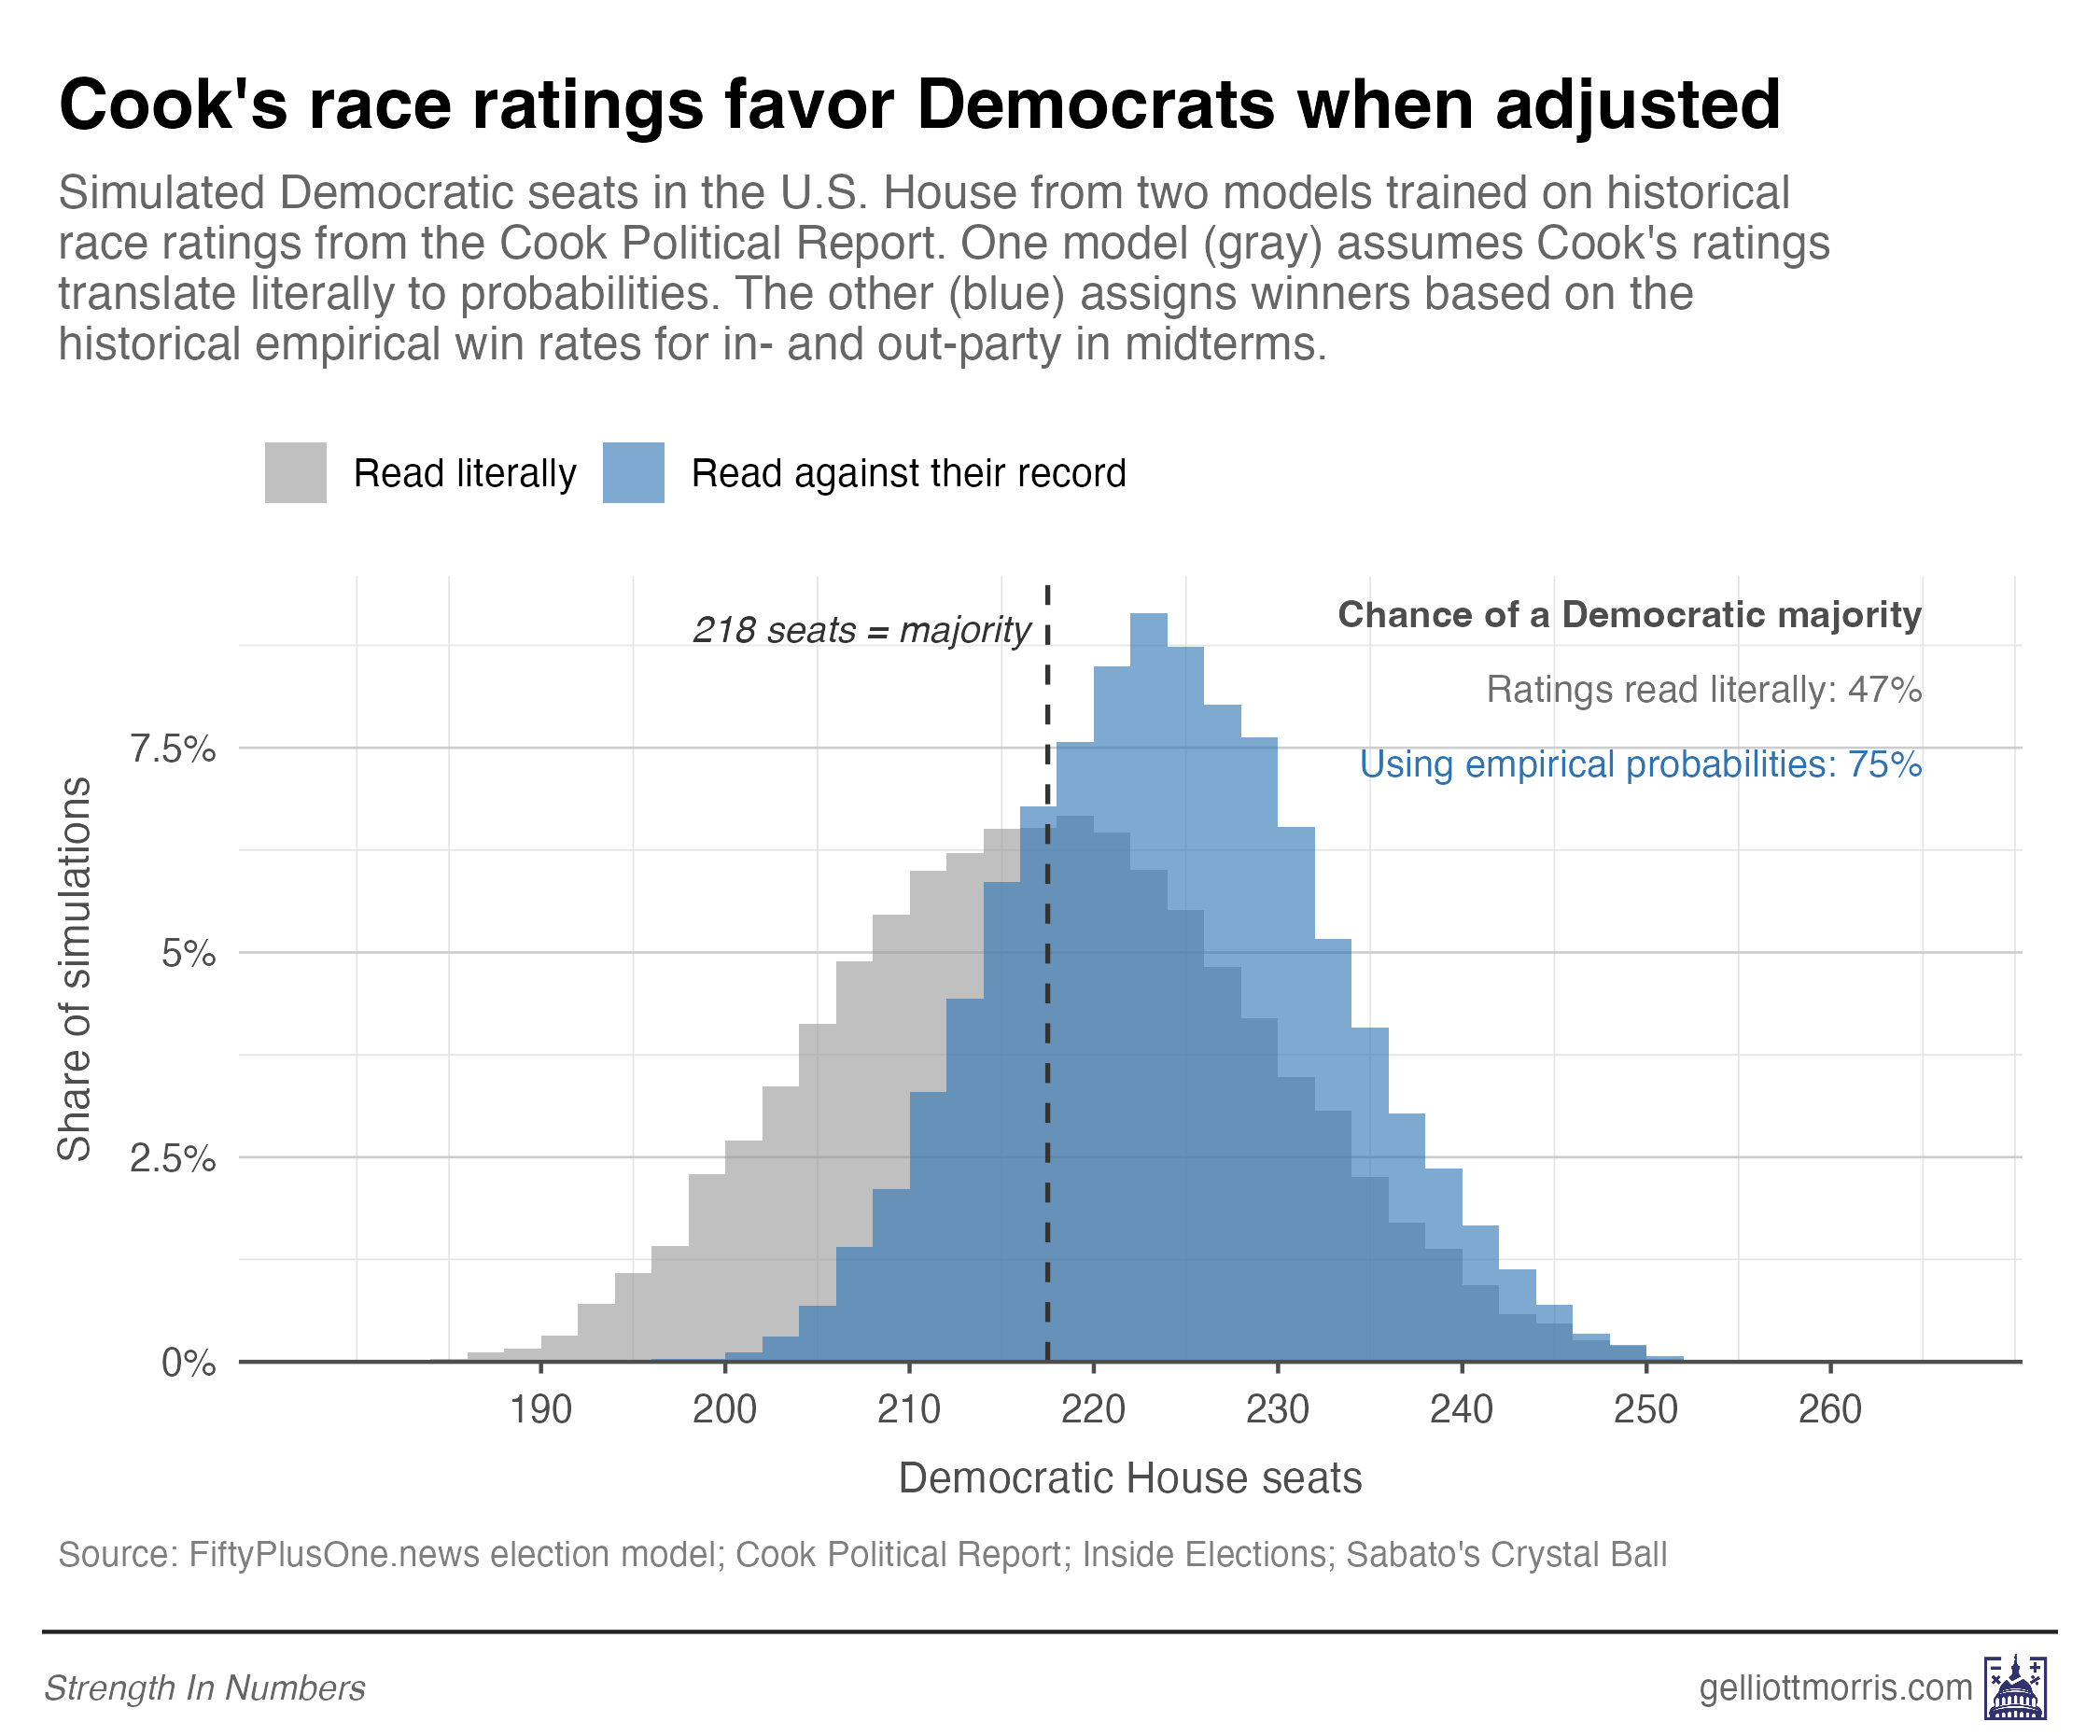
This is still a likely severe underestimate of Democratic win probability, but it’s a big shift in the right direction given the national indicators. And the story is the same for the other race-rating organizations: Inside Elections goes from 217 seats and 49% to 230 seats and 87%. Sabato goes from 220 seats and 57% to 231 seats and 89%.
Pool all three, and the House goes from a coin flip, 218 seats and 51%, to 228 seats and 83%.
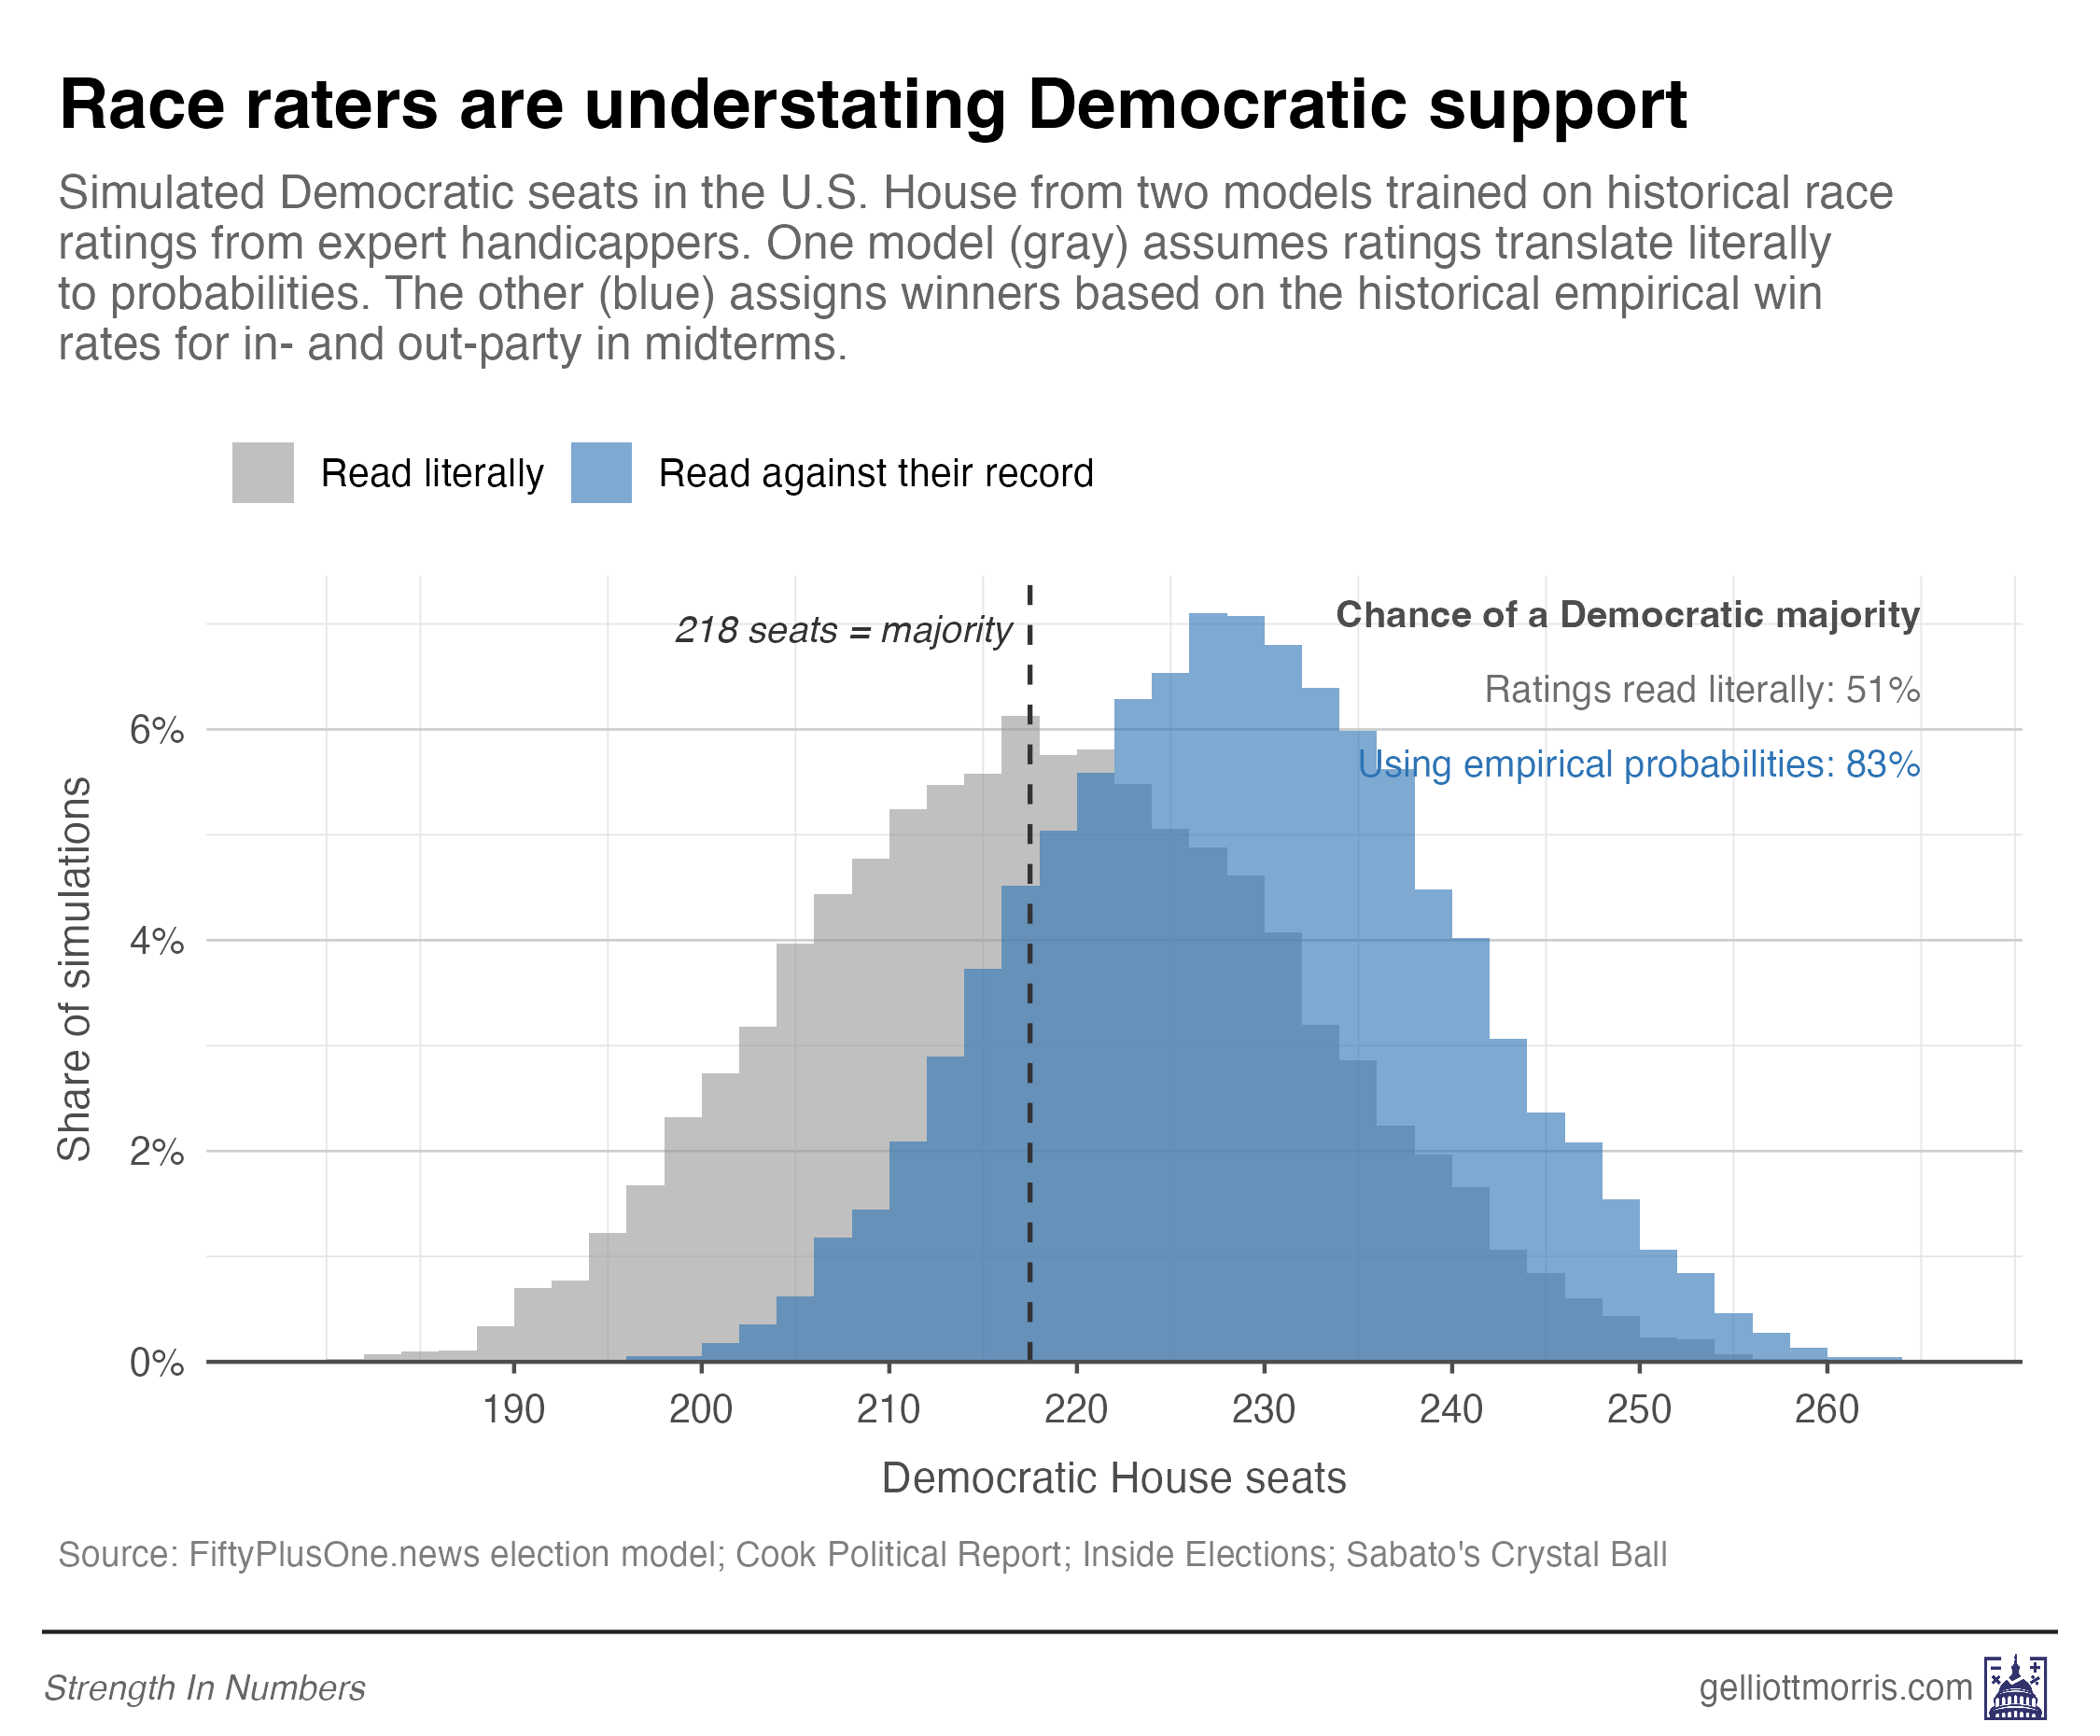
The Senate tells largely the same story, but I’m going to save those findings for another article, since the big difference between the raters and models right now is in the House.
The handicappers still know things
There is still some value to the handicappers, even if they have less alpha compared to more comprehensive models. Rating organizations (especially Cook) get access to candidates and a lot of data that isn’t made public. They have a good track record and are free to put their thumb on the scale when data looks off, a gamble that worked out for them in 2024.
Our election model at FiftyPlusOne uses race ratings as one input to our model, but we do so after processing them for various historical biases and other empirical wonkery.
Maybe that scale-thumbing will work again for the race raters in 2026. But historically, they have always underestimated the out-party in midterms — to the tune of about 30 percentage points in win probability in the House this year. That’s a heck of a bias, and not one that the quant modelers have.
Related Articles


Footnotes
Details of simulation program:
Step 1. Turn each rating into a seat probability. Every one of the 435 House races gets a label from the rater. The symmetric reading maps the label straight to a number: Tossup 50, Lean 75, Likely 90, Safe 97 for the favored party. The empirical reading instead looks up how that rater’s label actually performed 45 days before the 2010 through 2022 midterms, after recoding each label as favoring the president’s party or the opposition. So a Cook Lean R seat in 2026 gets the rate at which Cook’s Lean in-party seats have been held in past midterms, which is 78 percent, meaning a 22 percent Democratic win probability. A Cook Tossup gets 67 percent Democratic, because that is how often the out-party has won Cook’s House tossups.
Step 2. Add the seats up. Summing the probabilities gives the expected Democratic seat total. That is the 217 versus 224 figure for Cook. On its own, this says nothing about the odds of a majority, because it has no error attached.
Step 3. Calculate historical rater error. For each past midterm, the program finds the single nationwide shift that, when applied to every competitive seat’s probability at once, would have actually given the result of the midterm. A year like 2010, when the president’s party did even worse than the average midterm, needs a shift toward the out-party. A year like 2022, when it did better, needs a nudge the other way. The nudge is measured on the logit scale, which is a way of shifting probabilities that keeps them between 0 and 100 and moves a 50 percent seat more than a 90 percent seat. Across 2010, 2014, 2018, and 2022, those shifts were roughly plus 0.8, plus 0.4, zero, and minus 1.5. Their spread, about 1.0, becomes the size of the simulated national error. A one-unit nudge moves a 50 percent seat to 73 percent, or to 27 percent in the other direction.
Step 4. Simulate 20,000 elections. Each simulated election first draws one national shift from a bell curve with that spread and applies it to every Likely, Lean,n and Tossup seat in the same direction. Safe seats are left alone, because Safe-rated seats have not flipped in the record, and shocking 360 of them at once would have widened the uncertainty interval of our simulations beyond the empirical historical range. Then each seat is resolved individually by a coin flip weighted to its adjusted probability. Counting the Democratic wins gives one seat total, and repeating 20,000 times gives us a bunch of simulations we can use to calculate chamber win probabilities (and show that histogram).
Two notes:
Why this moves the probability so much. The two readings differ by only 7 seats in the mean, but the symmetric mean sits right on the 218 line, so half the simulations fall below it. The empirical mean is 6 seats above the line, and with a spread of about 12 seats, 75% of the simulations clear the majority threshold.
I checked historical calibration. For each past midterm and rater, the program compares the actual Democratic seat count after Election Day with what the translated ratings expected. The typical historical miss is 13 seats. The simulation’s implied standard deviation is 12. So the uncertainty intervals from this model are as wide as the raters’ own records say they should be.
You're really putting yourself out there, Elliott. I sincerely hope you are right.
Careful, Elliott: You're analysis is sophisticated but I think there may be a major flaw. In examining prediction-result patterns historically, your (small) set of elections (2010, 2014, 2018, 2022) balances three elections with a Democrat in the White House (2010, 2014, 2022) against one with a Republican (2018).
There's nothing inherently wrong with that, but it contributes strongly to the overall impression that the incumbency bias is nonpartisan -- i.e., bi-directional.
A strong case can be made, however, for regarding 2018 as highly atypical -- essentially a one-off, black swan event. Karl Rove, in a fit of pique over his displacement by Steve Bannon, took the 2018 election off. And I would submit that his talents -- i.e., his dark arts -- were sorely missed. (I'd also note, parenthetically, that the 2018 blue wave yielded a net gain of 40 House seats [and a *loss* of two Senate seats] while the 2010 red wave yielded a net gain of 63 House seats for the GOP -- an asymmetry not fully explained by organic factors.)
If 2018 had as much to do with who was navigating the GOP bus as with purported generic polling bias, then we're left with a series of elections in which pollsters missed to the left. And we can add to that the 2020 election, in which of 27 House contests rated tossup by Cook, the GOP won every single one (and also won 7 Democratic leaners while losing none of their own), and similar, if less egregious misses in 2016 and 2024.
So overall, the clear pattern in the computerized voting era is pollsters overestimating Democratic strength, making corrections, and overestimating Democratic strength yet again (pace 2018). Pollsters don't stay in business by erring repeatedly and consistently *in the same direction*! So it is understandable that Cook et al are lowballing Democratic prospects in these midterms. They have touched the hot stove -- over and over -- and are very wary of doing it yet again.
You can draw your own conclusions on why they keep missing in the same direction -- why, that is, there is a pervasive polling-to-votecount red shift, even after they tweak their sampling methodologies to account for it. Maybe there really is a "reluctant Bush/Trump responder" phenomenon that results in an oversampling of Democrats (but there is demographic stratification to handle that). Or, just spitballing here, maybe unreliable vote counts (from suppression schemes and/or vote-count manipulation) are a factor? Maybe all the red thumbs on the electoral scales have left the pollsters wondering what they keep doing wrong, when they're not doing much of anything wrong at all?
This is worth our consideration as we move toward an election in which Donald Trump has called upon his side (voters, administrators, operatives, vendors...) to "cheat like hell."