

Backlash to Trump has been more severe in his second term
Gallup's latest data shows Republican party identification down 6 points in Trump's second term — three times the decline in 2017

This is my free Chart of the Week — a data-driven look at what’s happening in American politics right now. If you find this useful, consider becoming a paid subscriber to get Tuesday’s premium Deep Dive, access to exclusive polling data, and support independent polling and empirical political journalism.
In the first year of Donald Trump’s first term as president in 2017, the share of Americans calling themselves Republicans (or independents who leaned toward the Republican Party) dropped just 2 percentage points — from 42% in 2016 to 40% by Q4 of 2017. I predict it will surprise many people to hear that the Democrats didn’t actually change their advantage in party ID much at all in Trump’s first term, expanding their advantage to +7 in 2018 from +6 in 2016.
In Trump’s second term, however, the Republican Party is shedding members at a much higher pace. Gallup released its latest party identification data this week, and the numbers show Republican identification dropped from 46% in 2024 to just 40% in Q4 of 2025 — a 6-point decline, triple the 2-point drop during Trump’s first term.
This week’s Chart of the Week is: Backlash to Trump has been more severe in his second term.
I. Democrats rebound in national party identity
Let’s start with the raw numbers. Gallup measures party identification in a two-step process. First, the firm asks Americans whether they identify as a Republican, Democrat, or independent. Then, Gallup asks the independents which party they “lean more to.” (Political scientists and pollsters have found that this “leaned” party identification is a better measure of actual political attitudes and voting behavior than straight party ID, since most independents vote consistently with one party, so this is the number I use.)
Here’s the trajectory of leaned party ID in Trump’s second term, quarter by quarter:
Q4 2024: R+4 (before inauguration)
Q1 2025: Tied
Q2 2025: D+3
Q3 2025: D+7
Q4 2025: D+8
And here’s Gallup’s chart:
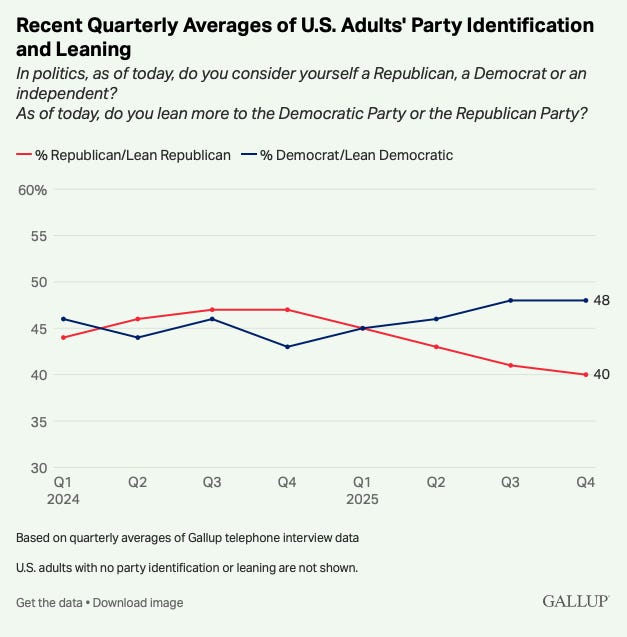
I wrote about this trend in an October article back when Gallup’s Q3 reading showed Democrats at +7. I noted that this was already higher than at the equivalent point in Trump’s first term. The trend has only continued since then, with Democrats now holding an 8-point advantage.
That D+8 reading is now a recent record for the Democratic Party. If it holds for all of 2026, D+8 will be the largest lead for the party — the largest lead for either party — since 2009.
Trump’s 12-point decline in party ID margin (a 6-point decrease in share GOP) since Q4 2024 is 3x the decline in his first term.
To put that in more historical context, I compared each president’s party identification at the end of their first year to the previous year’s average:
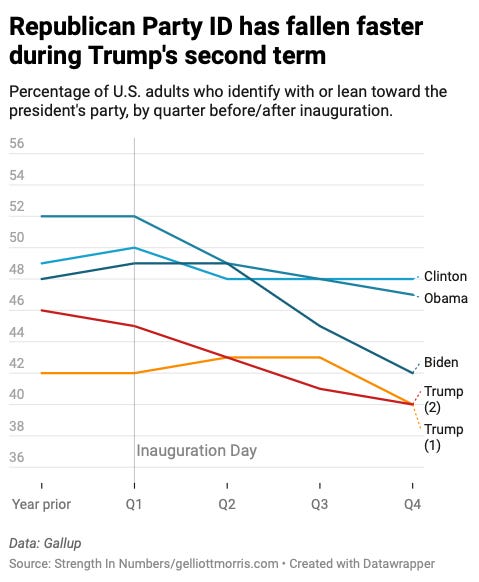
Data: Gallup. The chart shows the percentage of adults identifying with or leaning toward the president’s party. George W. Bush was excluded due to distortions from a 9/11 rally effect.
Two lines stand out in this chart. First, Trump’s second term: The 6-point drop in Republican identification is three times larger than the 2-point decline during his first term. While Trump started his second term with more Republicans in the electorate, he has ended up at the same place as in his first term, at 40% GOP identification.
At the rate this trend is going south, however, Republicans could end up at a much larger deficit than they had in 2020. Trump has really squandered the GOP’s political position circa December 2024. He is a point away from setting a new record low for party ID for the president’s party at this point in their term!
Second, note that Trump’s 6-point decline matches Biden’s 6-point drop from 2020 to Q4 2021.
II. Why is the swing larger this time?
I have been pretty critical of media coverage that painted Trump’s victory in 2024 as a huge, mandate-qualifying defeat of Democrats and progressivism. On election night 2024, Trump went on TV and claimed an “unprecedented” mandate for an agenda of tax cuts, tariffs, mass deportations, and revenge against his partisan opponents.
The media was generally happy to repeat those claims, even though they were obviously wrong. Trump’s victory was not large and his agenda was not popular. Journalists were playing right into his marketing scheme.
This helps explain Trump’s decline since. Trump won the 2024 election for two reasons. First, he won a good amount of soft support relative to 2020 from people who didn’t like Biden and wanted a solution for high prices. Second, a lot of Democrats stayed home. His victory was small, but he overplayed his hand.
Voters gave Trump a second chance in 2024, and now feel betrayed by his policy agenda. From tariffs to mass deportation and many attempts to circumvent the courts, from the DOGE chaos to harsh Medicaid/ACA cuts, and now the transparent grifting in Venezuela — pretty much every official action of Trump’s second term has been opposed by a plurality to a clear majority of the American public.
Of course, it’s natural for a party to lose support over time. Every policy a government enacts marginalizes some number of voters, decreasing the party in power’s base of support as they pile on changes to policy, regulations, and the like. But as the data indicate, Trump is speed-running this process. Voters are reacting to the first year of his presidency the way they reacted to 20% cumulative inflation in prices under Biden’s whole term.
Compared to 2017, many voters then were still in “wait and see” mode with Trump. He was still a relative governing unknown, and voters who had taken a chance on him were willing to give him time to prove himself. Especially because the economy was doing well. The chaos of that first year — the travel ban, Charlottesville, the failed health care repeal — eroded support slowly. Democrats held a large margin in the generic ballot from early on, but that was mostly from persuading independents to join them, not because Trump shed a lot of Republicans.
In 2025-2026, there has been no such grace period. The share of Americans identifying as Republican/lean R increased by 1 point from 2016 to 2020. From 2024 to Q4 2025, it fell by 6. Voters know now exactly who Trump is.
While many pundits covered Trump’s 2024 win as a new dominance for the right in American politics, it’s clear now that the apparent new apex of GOP loyalty was more of a phantom swing, perhaps an election-year shock driven by inflation and an unpopular Democratic president. There were a lot of soft Trump supporters who were willing to identify with the GOP in a moment of incumbent backlash, but didn’t stick around when Trump inevitably did what was all very well predictable ahead of time.
III. Will 2026 be another blue wave?
The question now is whether Democrats can convert this party ID advantage into a big midterms victory. They will need to do that if they want to deliver on their promises of reining in Trump. But party ID advantages don’t automatically translate into votes — ask Democrats circa 2010 or 2014. In both years, Democrats held advantages in party identification but lost badly because their voters didn’t show up.
But when you combine a 6-point decline in Republican identification with strong generic ballot numbers (and a tendency for the party in the White House to lose ground over the election year — see my post from Tuesday!), sustained special election overperformance, and an engaged base showing up to protests, you have the ingredients for a wave. Redistricting is the big unknown variable for 2026, but of course, that wouldn’t blunt a big Democratic popular vote victory, just the number of seats they win.
Related Articles
Data Portal: Track Trump’s issue approval rating, economic growth, and more
October article: Where I first wrote about the Q3 party ID shift
Polls show voters trust Democrats more on the economy: Another sign of shifting political winds
Like what you’re reading? This Chart of the Week is free for everyone — but paid subscribers get Tuesday’s Deep Dives, access to our monthly polling, and more. If you want to support independent, data-driven political journalism, consider subscribing.
Thanks for putting the strength in Strength In Numbers.
Thank you for evidence based and data-driven coverage. There's a lot of vibes in our political news and discourse and op-eds. Vibes with no data is like cheese but no grits.
Excellent piece. I have you in my preferred blogs right there with Heather Cox Richardson and Paul Krugman and I cannot think of a higher honor from me. I have a question regarding: "Second, a lot of Democrats stayed home." 2024 was the second largest turnout (in post Voting Rights Act, before that doesn't really count, LOL) history. The highest was 2020 when mail in voting dominated--most people "stayed home" in 2020 and voted from there. While Republicans in key states curtailed vote by mail in 2024, which naturally limited turnout, though I have no idea how much. To me, the "a lot of Democrats stayed home" seems like the stock Democrat self flagellation and internal finger pointing ("If only you did what I said you would have won!" pouty face emoji) that happens whenever they lose that isn't backed up by the numbers. Clearly, Dems needed to show up more, no matter the reasons that people didn't vote, that's moot. The question I have is: In the second highest turnout election in American history why is the "Democrats stayed home" narrative supported by the numbers?