

I graphed every president's approval rating during "rally around the flag" events
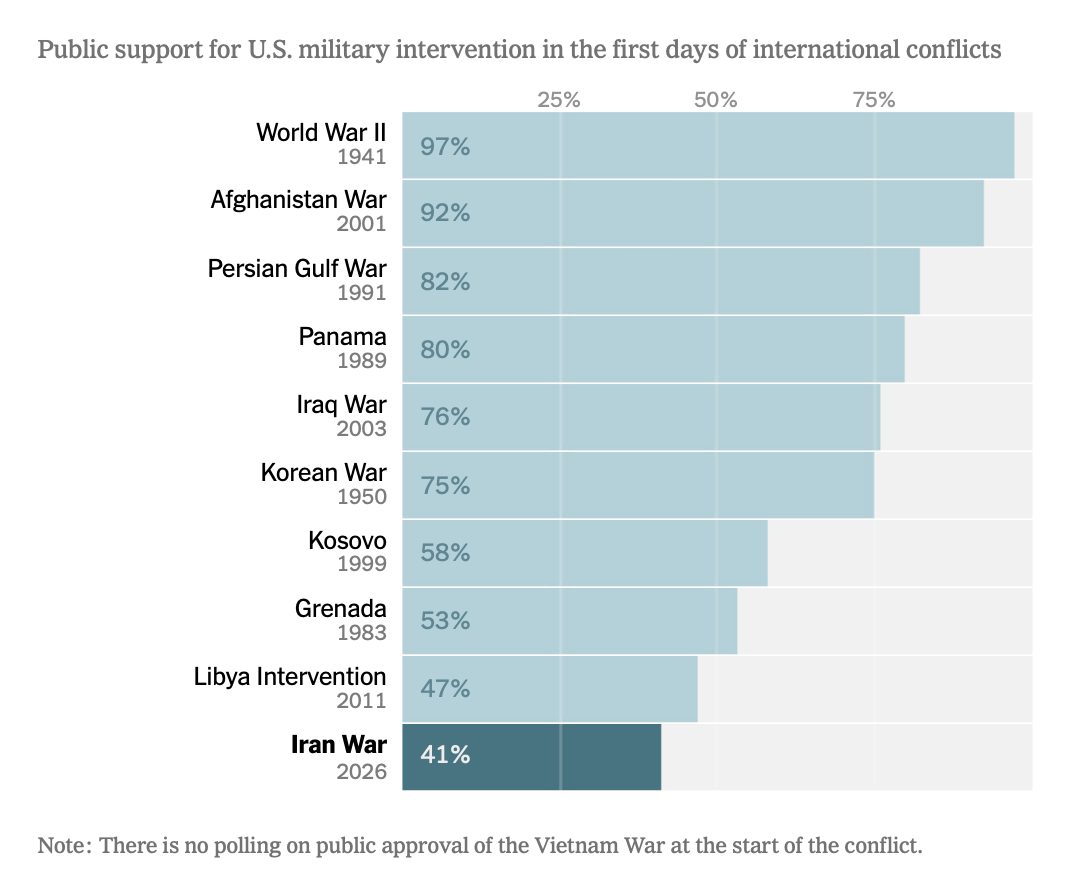
From World War II to Trump's bombing of Iran, only a handful of historical conflicts produced clear jumps in presidential approval. The Iran strikes look like the latest case of a non-bump

Donald Trump launched airstrikes against Iran on Feb. 28, 2026. In the two weeks since, I’ve already written about how the public opposed the strikes from the start and how nearly every poll on the war so far confirms this trend.
Another question I’ve seen people ask is whether the war will impact the president’s overall approval rating at all. Political strategist Karl Rove wrote in the Wall Street Journal last week that it looked unlikely Trump would see a so-called “rally around the flag” effect in his rating — the surge in presidential approval that typically follows the start of a military conflict.
But does it? Many in the media refer to the rally effect as a reliable pattern in American politics. But when you look closely at the data, genuine rallies are rarer and harder to detect than the conventional wisdom suggests. Only three conflicts since WWII produced clear, double-digit bounces in net presidential approval: the Gulf War (+29), WWII (+19), and Iraq (+17). Several others — Panama, Korea, Grenada, and Afghanistan — are ambiguous. Polls after these events were confounded by recessions, noisy polling data, or baselines so high there was nowhere to go.
For Trump’s Iran strikes, it indeed looks like another non-rally. There has been no detectable change in his polls in nearly two weeks. The president’s approval has barely moved, from -20 to -19 in the 50+1 average (when rounding), a gain of less than a point. In an era of deep polarization, Trump’s approval didn’t even twitch.
A simple explanation for Trump’s non-rally is that his war is unpopular. I found that on average, just 38% of voters said they approved of the U.S. strikes in Iran.
But a full accounting of why polling rallies have happened historically reveals a more interesting story of public opinion about presidents and their wars.
I compiled approval data for every major U.S. military conflict since 1941 and compared the change in net presidential approval after the onset of hostilities. Then I went back to the political science literature on rally effects to figure out why Trump’s numbers haven’t moved. Scholars have identified roughly five conditions that produce a rally. Trump’s war fails on nearly all of them.
This week’s Chart of the Week is: What is the “rally around the flag” effect, really? And why didn’t Trump get one after attacking Iran? Below, I chart presidential approval around every major U.S. military conflict since 1941 — and then dig into the political science to explain why Trump’s approval has been so stable so far.
Historical approval averages
In the charts below, I show the president’s average approval rating from 30 days before to 60 days after the start date of 11 key conflicts. These 11 conflicts include the 10 from this graph that the New York Times published, plus Vietnam.
Here are my historical averages of presidential approval around each of those conflicts.
World War II (December 1941)
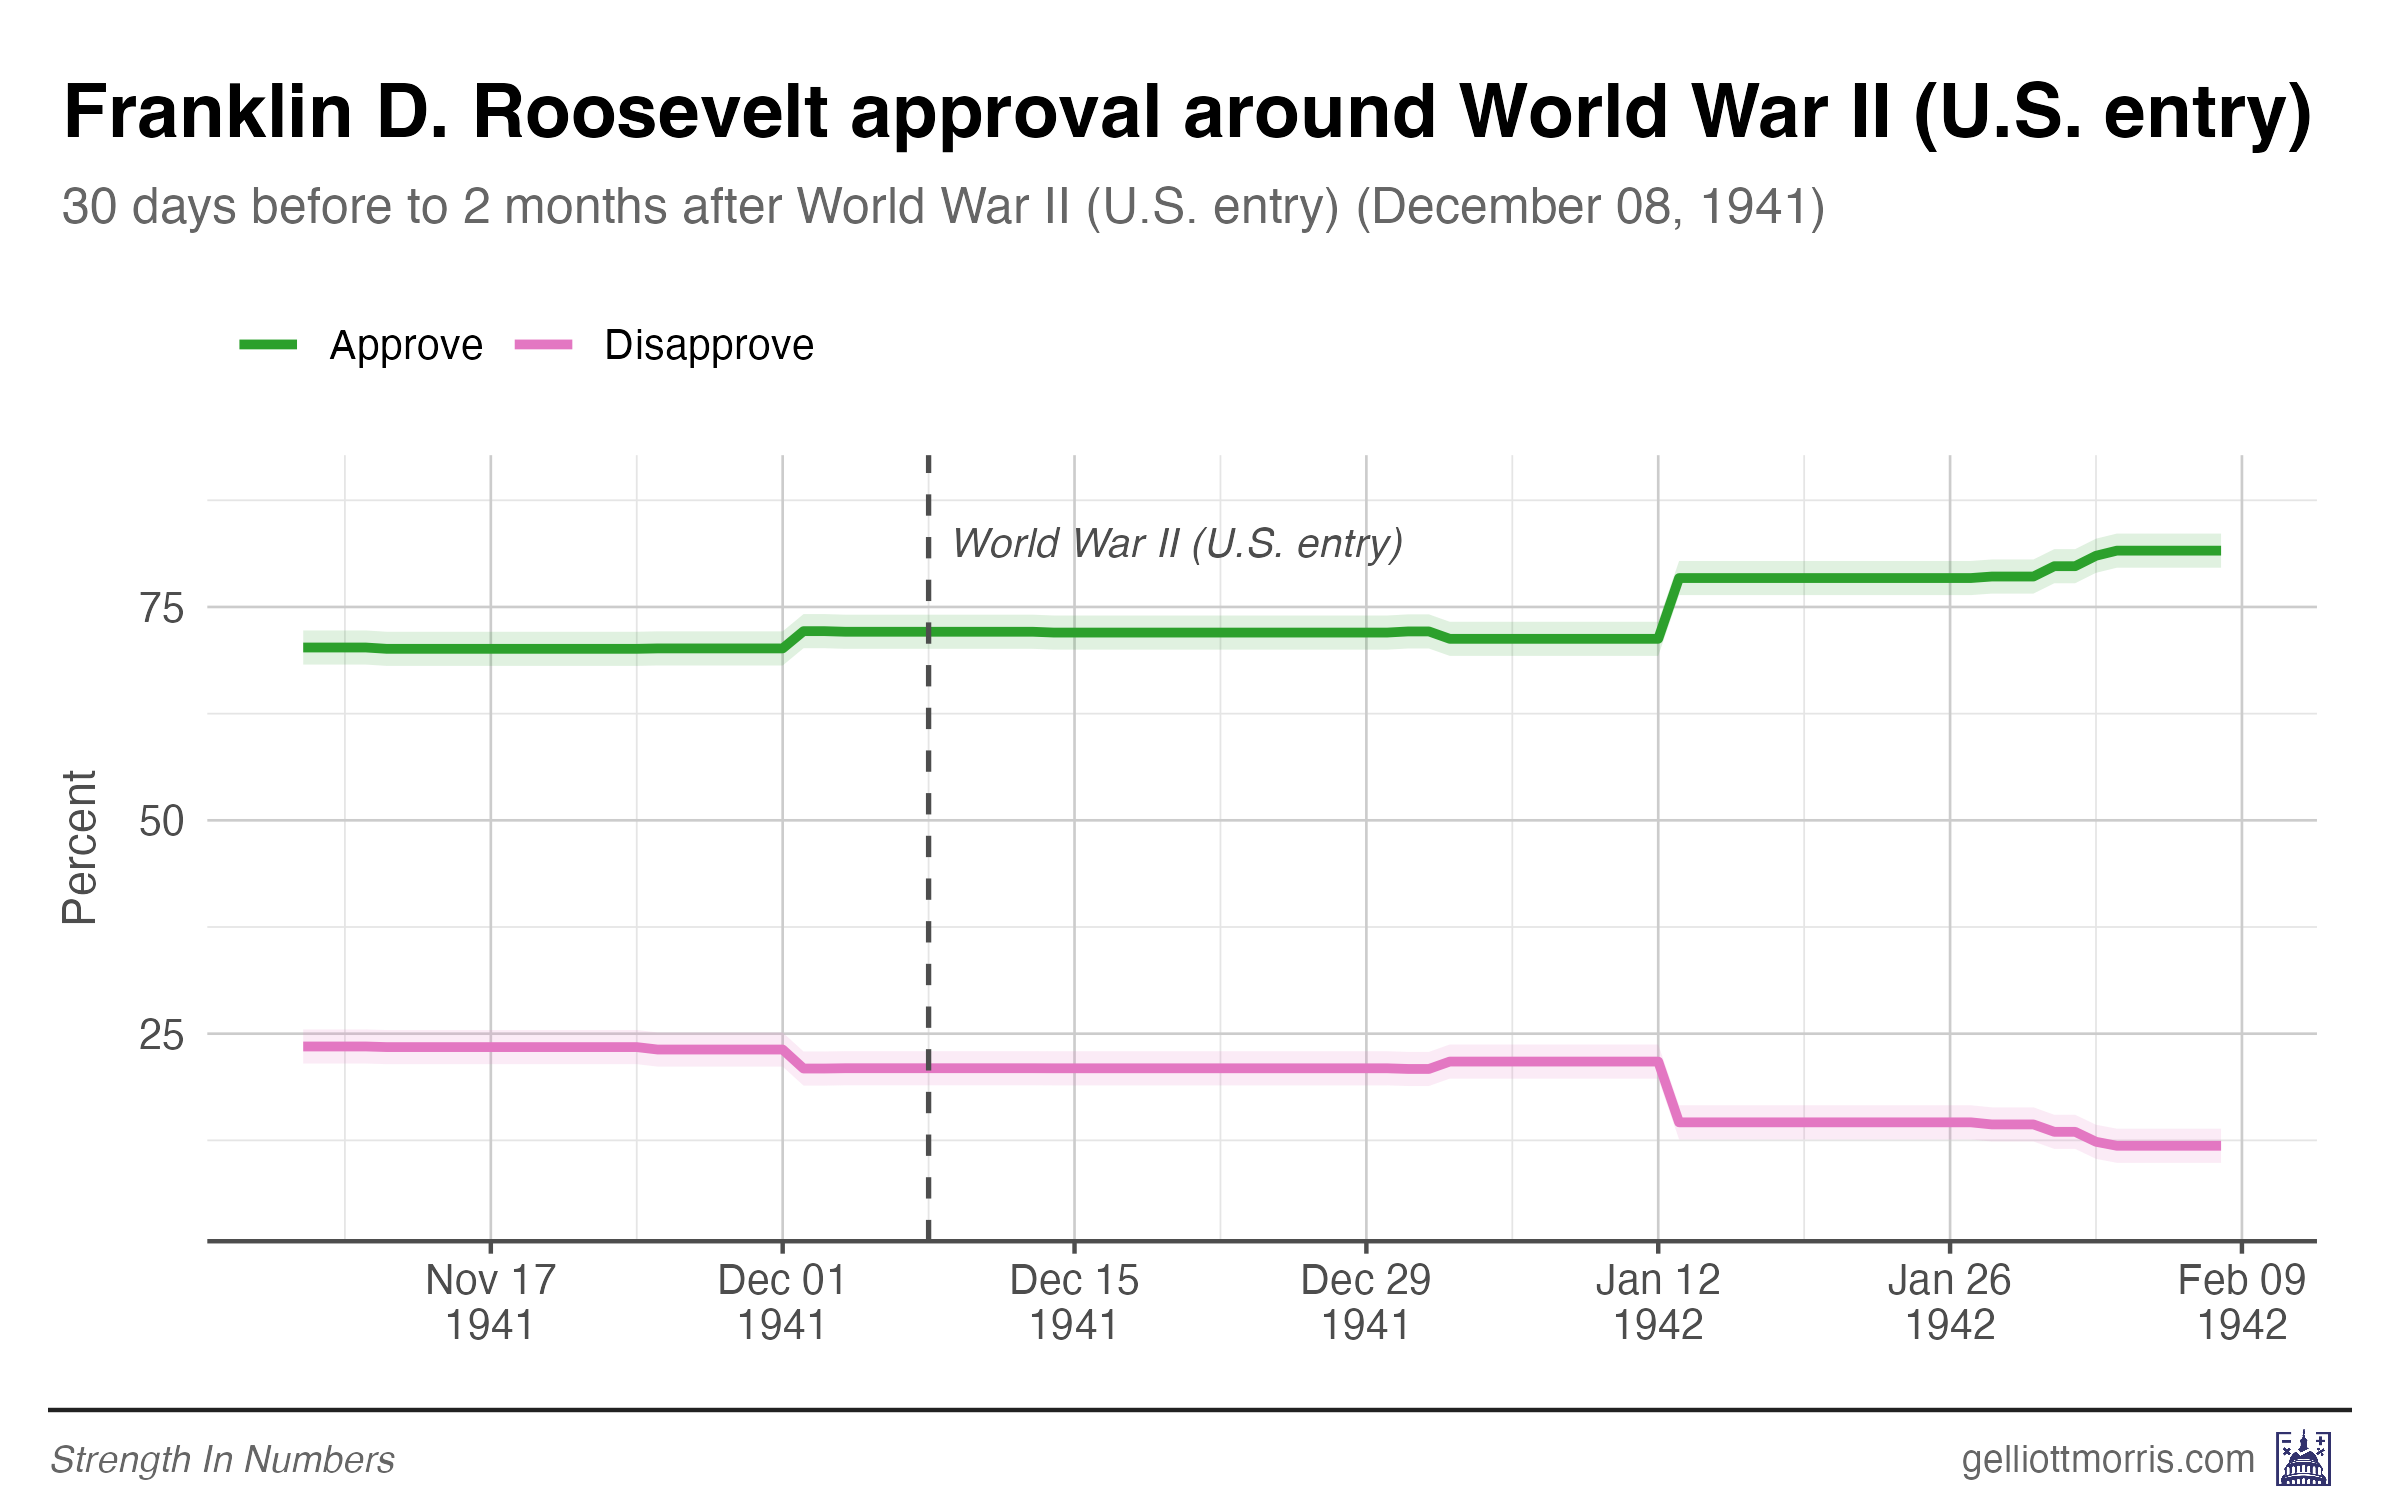
Franklin D. Roosevelt already had massive approval when the U.S. entered the war after Pearl Harbor (at a net rating of +51). His numbers held steady for the first month, then surged to +70 by two months out, a gain of +19. The delayed bounce likely reflects the slower polling cadence of the 1940s rather than a delayed public reaction.
Korean War (June 1950)
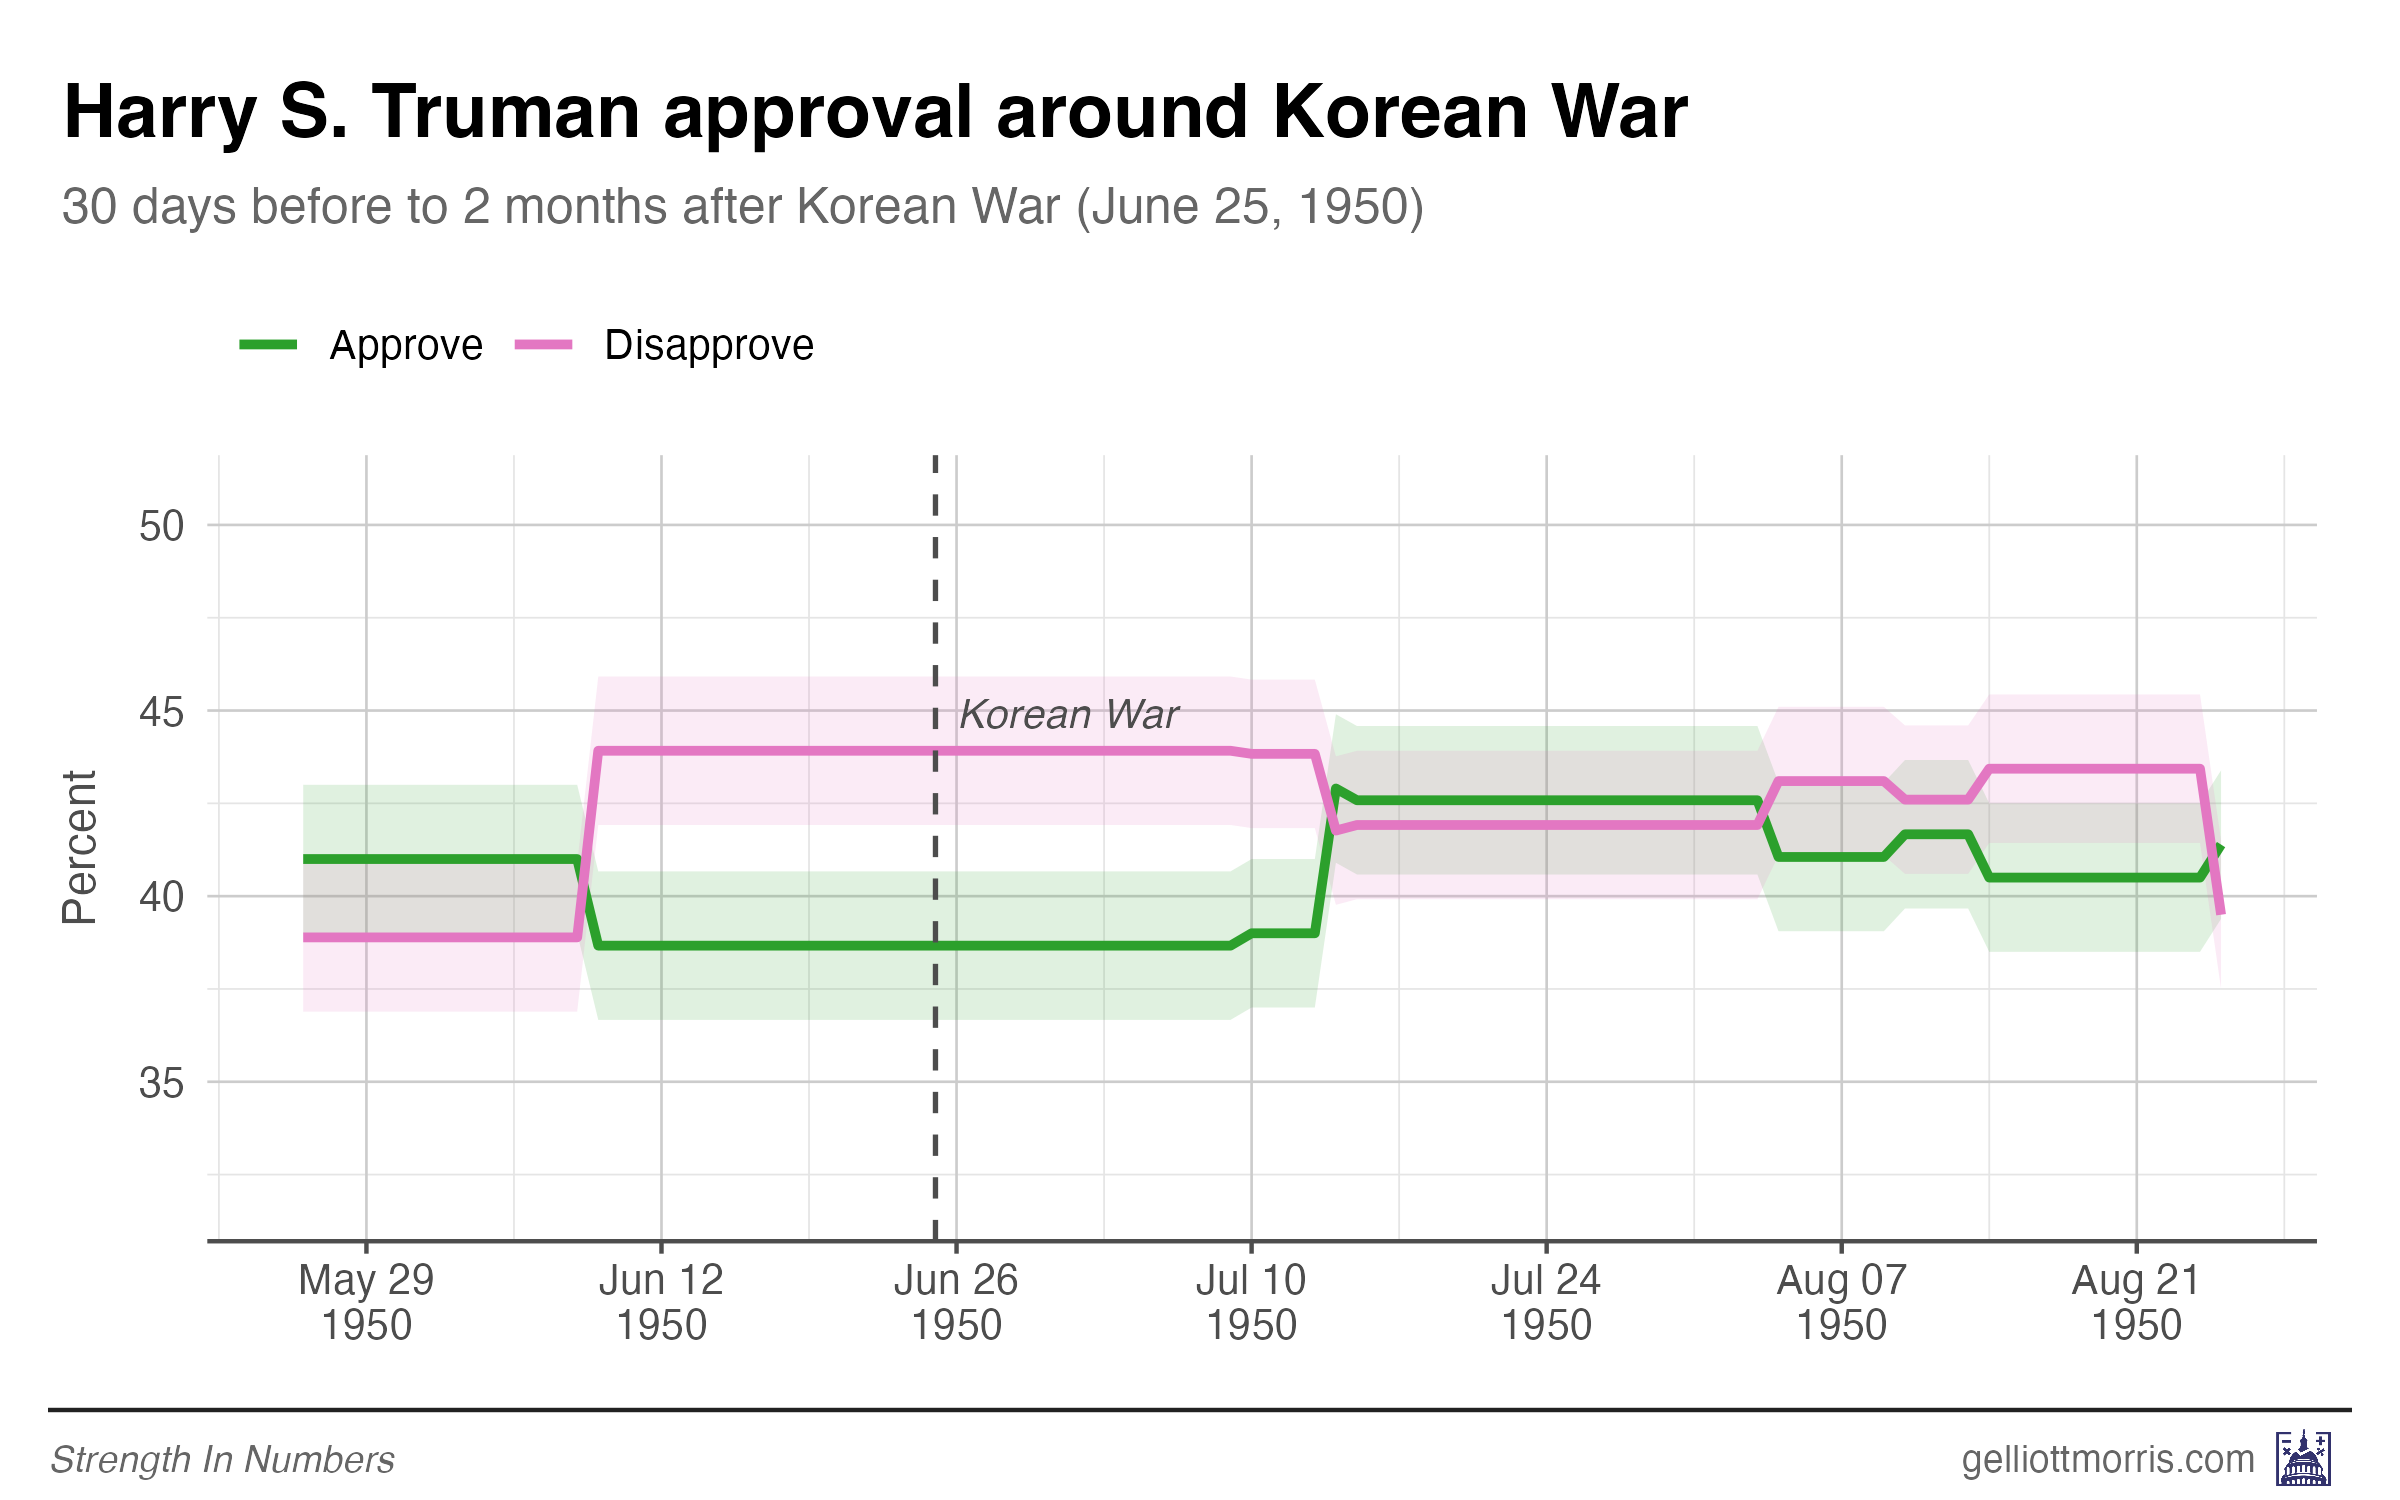
Around the time of the outbreak of the Korean War, Harry Truman was in slightly negative approval territory, with a net approval of -5. He clawed his way back to +2 by two months out, a gain of +7 points.
As with World War II, there’s a caveat about polling cadence: 1950s polling was far sparser than today’s, with fewer polls and larger margins of error. The +7 gain could partly reflect measurement noise rather than a clean rally signal.
But if it was real, the rally was unsteady and short-lived anyway. Korea quickly became unpopular; Gallup polls showed support for the war declining rapidly. By early 1951, after Chinese intervention turned the conflict into a stalemate, a plurality of Americans told Gallup the war was a “mistake.” Truman’s approval cratered to the low-to-mid 20s by 1952 — some of the lowest presidential approval ratings ever recorded.
Vietnam War (November 1955)
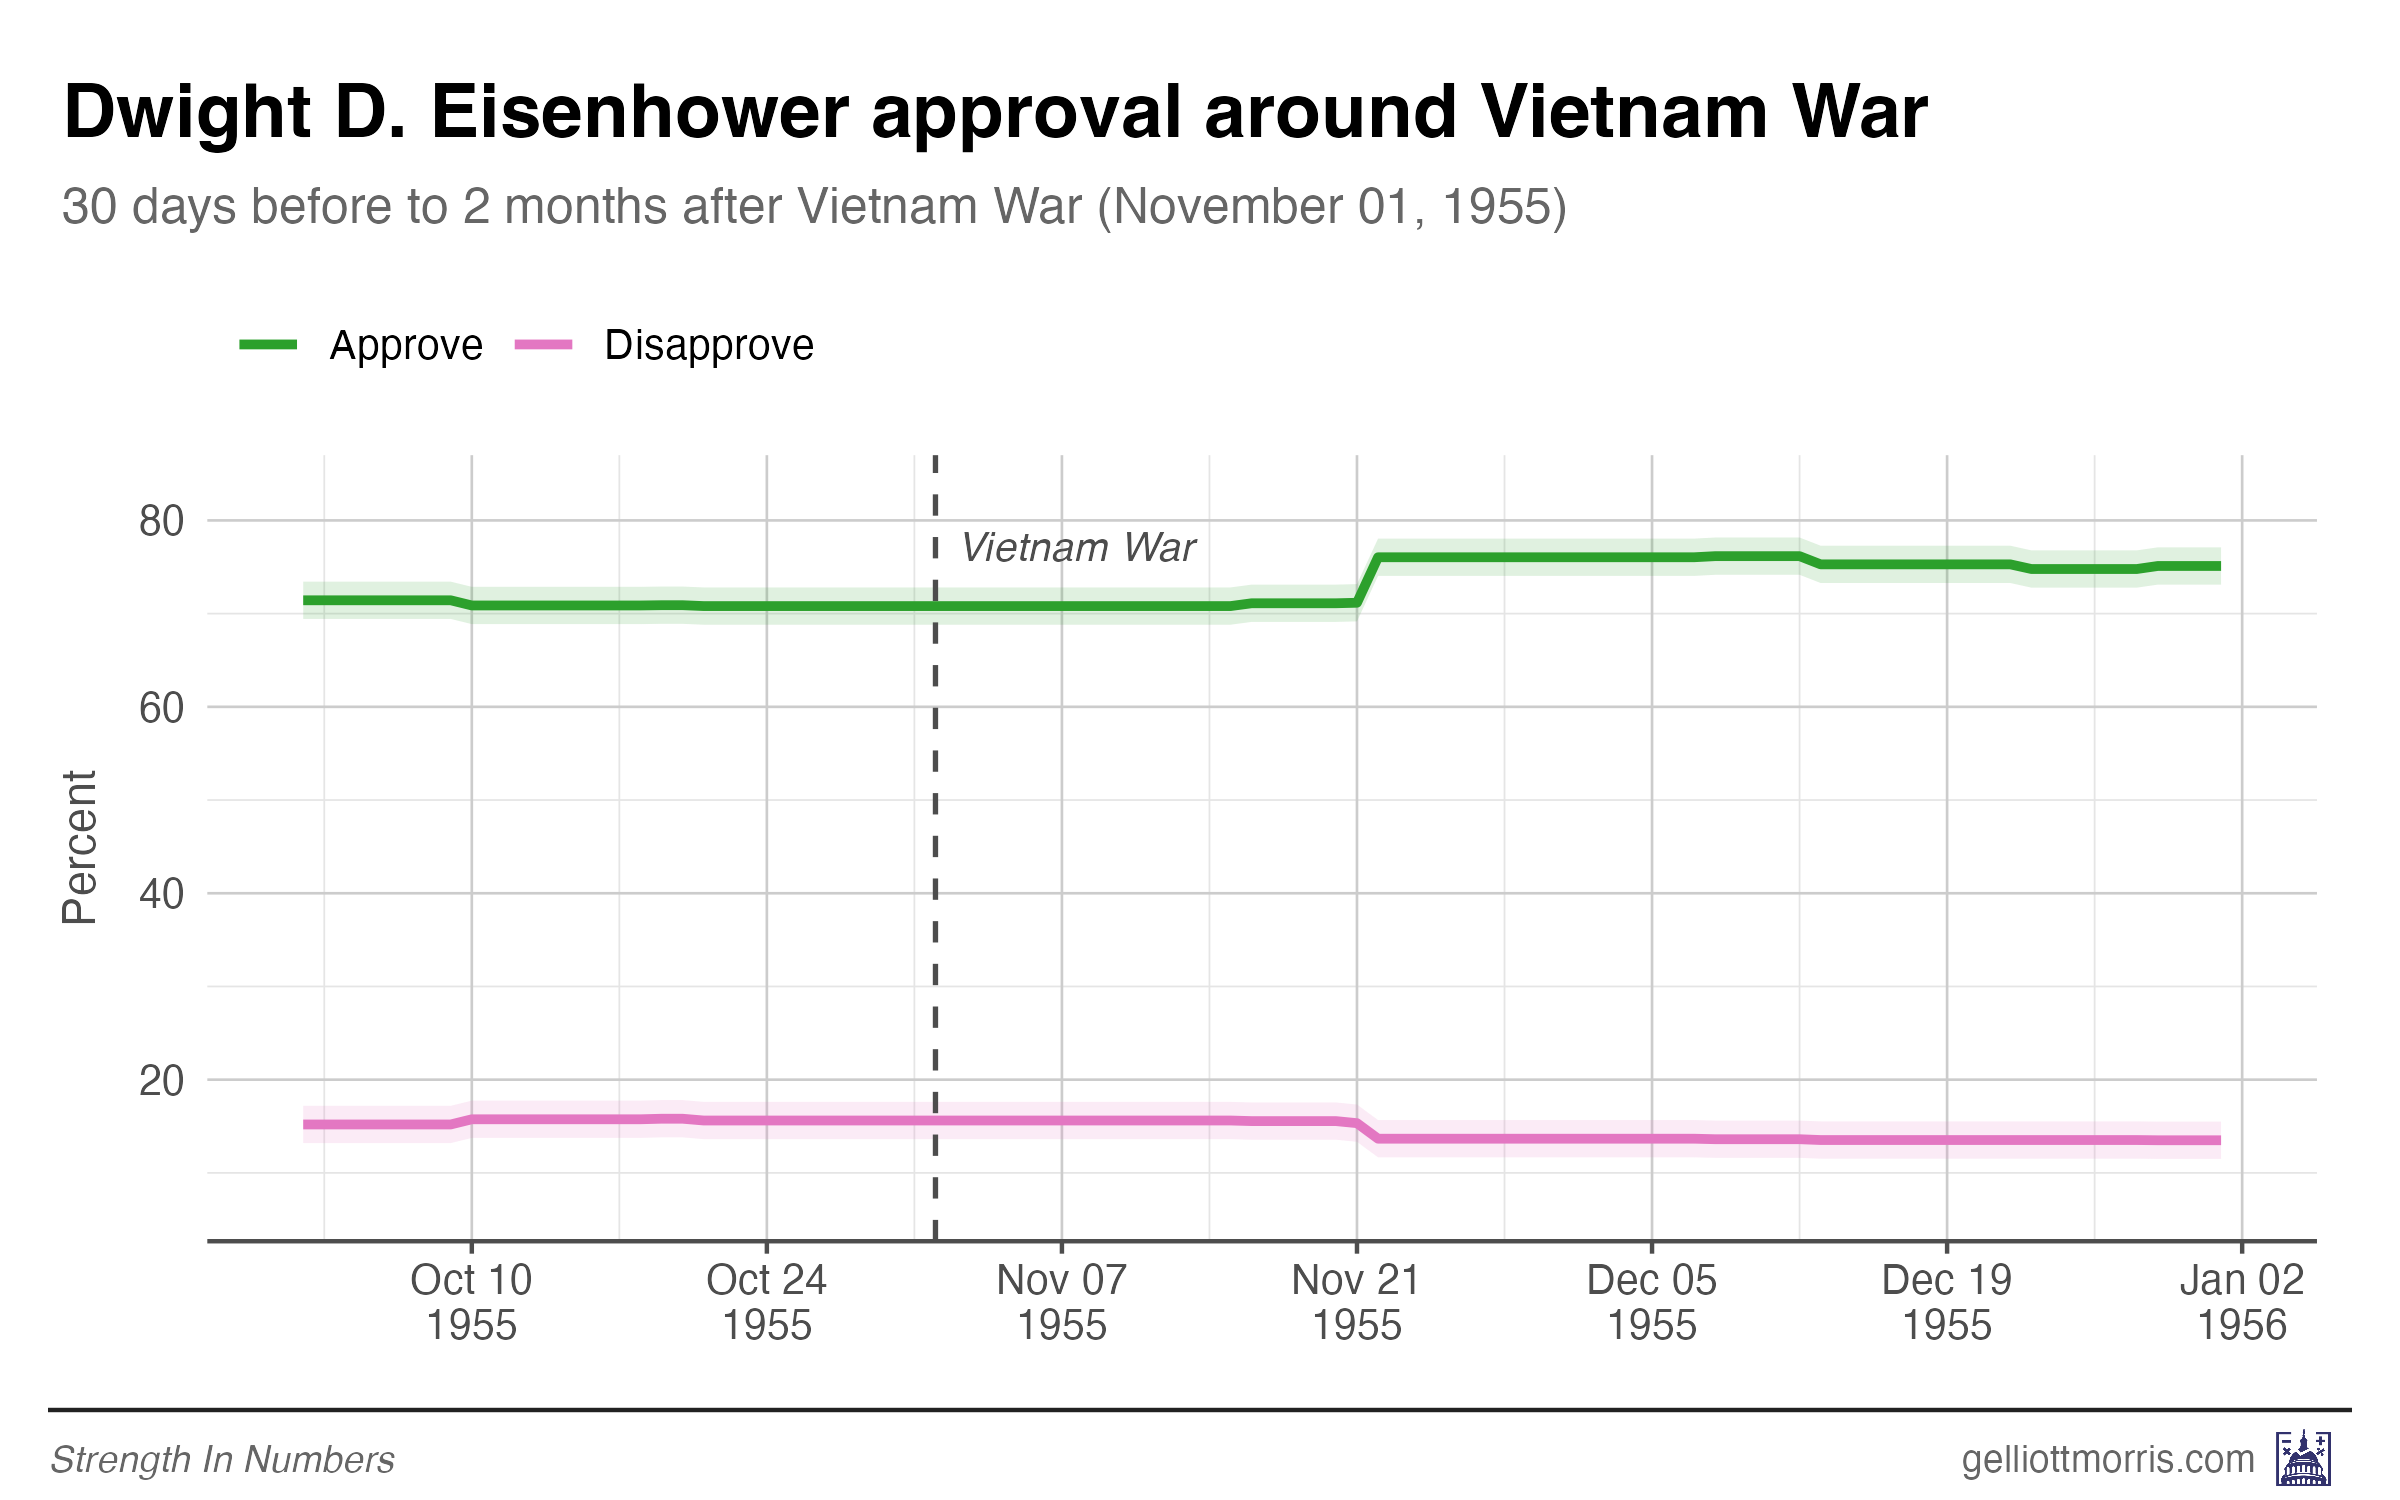
Dwight D. Eisenhower was enormously popular when the U.S. began its military advisory mission in Vietnam (net +55). By two months out, his approval drifted up to +62 — a gain of +6 points.
Ike’s upside was potentially capped by the fact that 75% of Americans already approved of his job performance. The early Vietnam commitment was also gradual, with only a few hundred troops playing a role, and it did not prompt much reflection from the press or public. For what it’s worth, I also looked at approval for Lyndon Johnson in 1964 after the Gulf of Tonkin Resolution passed, and there was no change in his approval rating.
UPDATE March 13, 11:08 AM Eastern: Some readers have emailed to ask about Lyndon Johnson’s approval around the time of the Gulf of Tonkin incident, which could also have been a potential rally event for Vietnam. That graph is below.
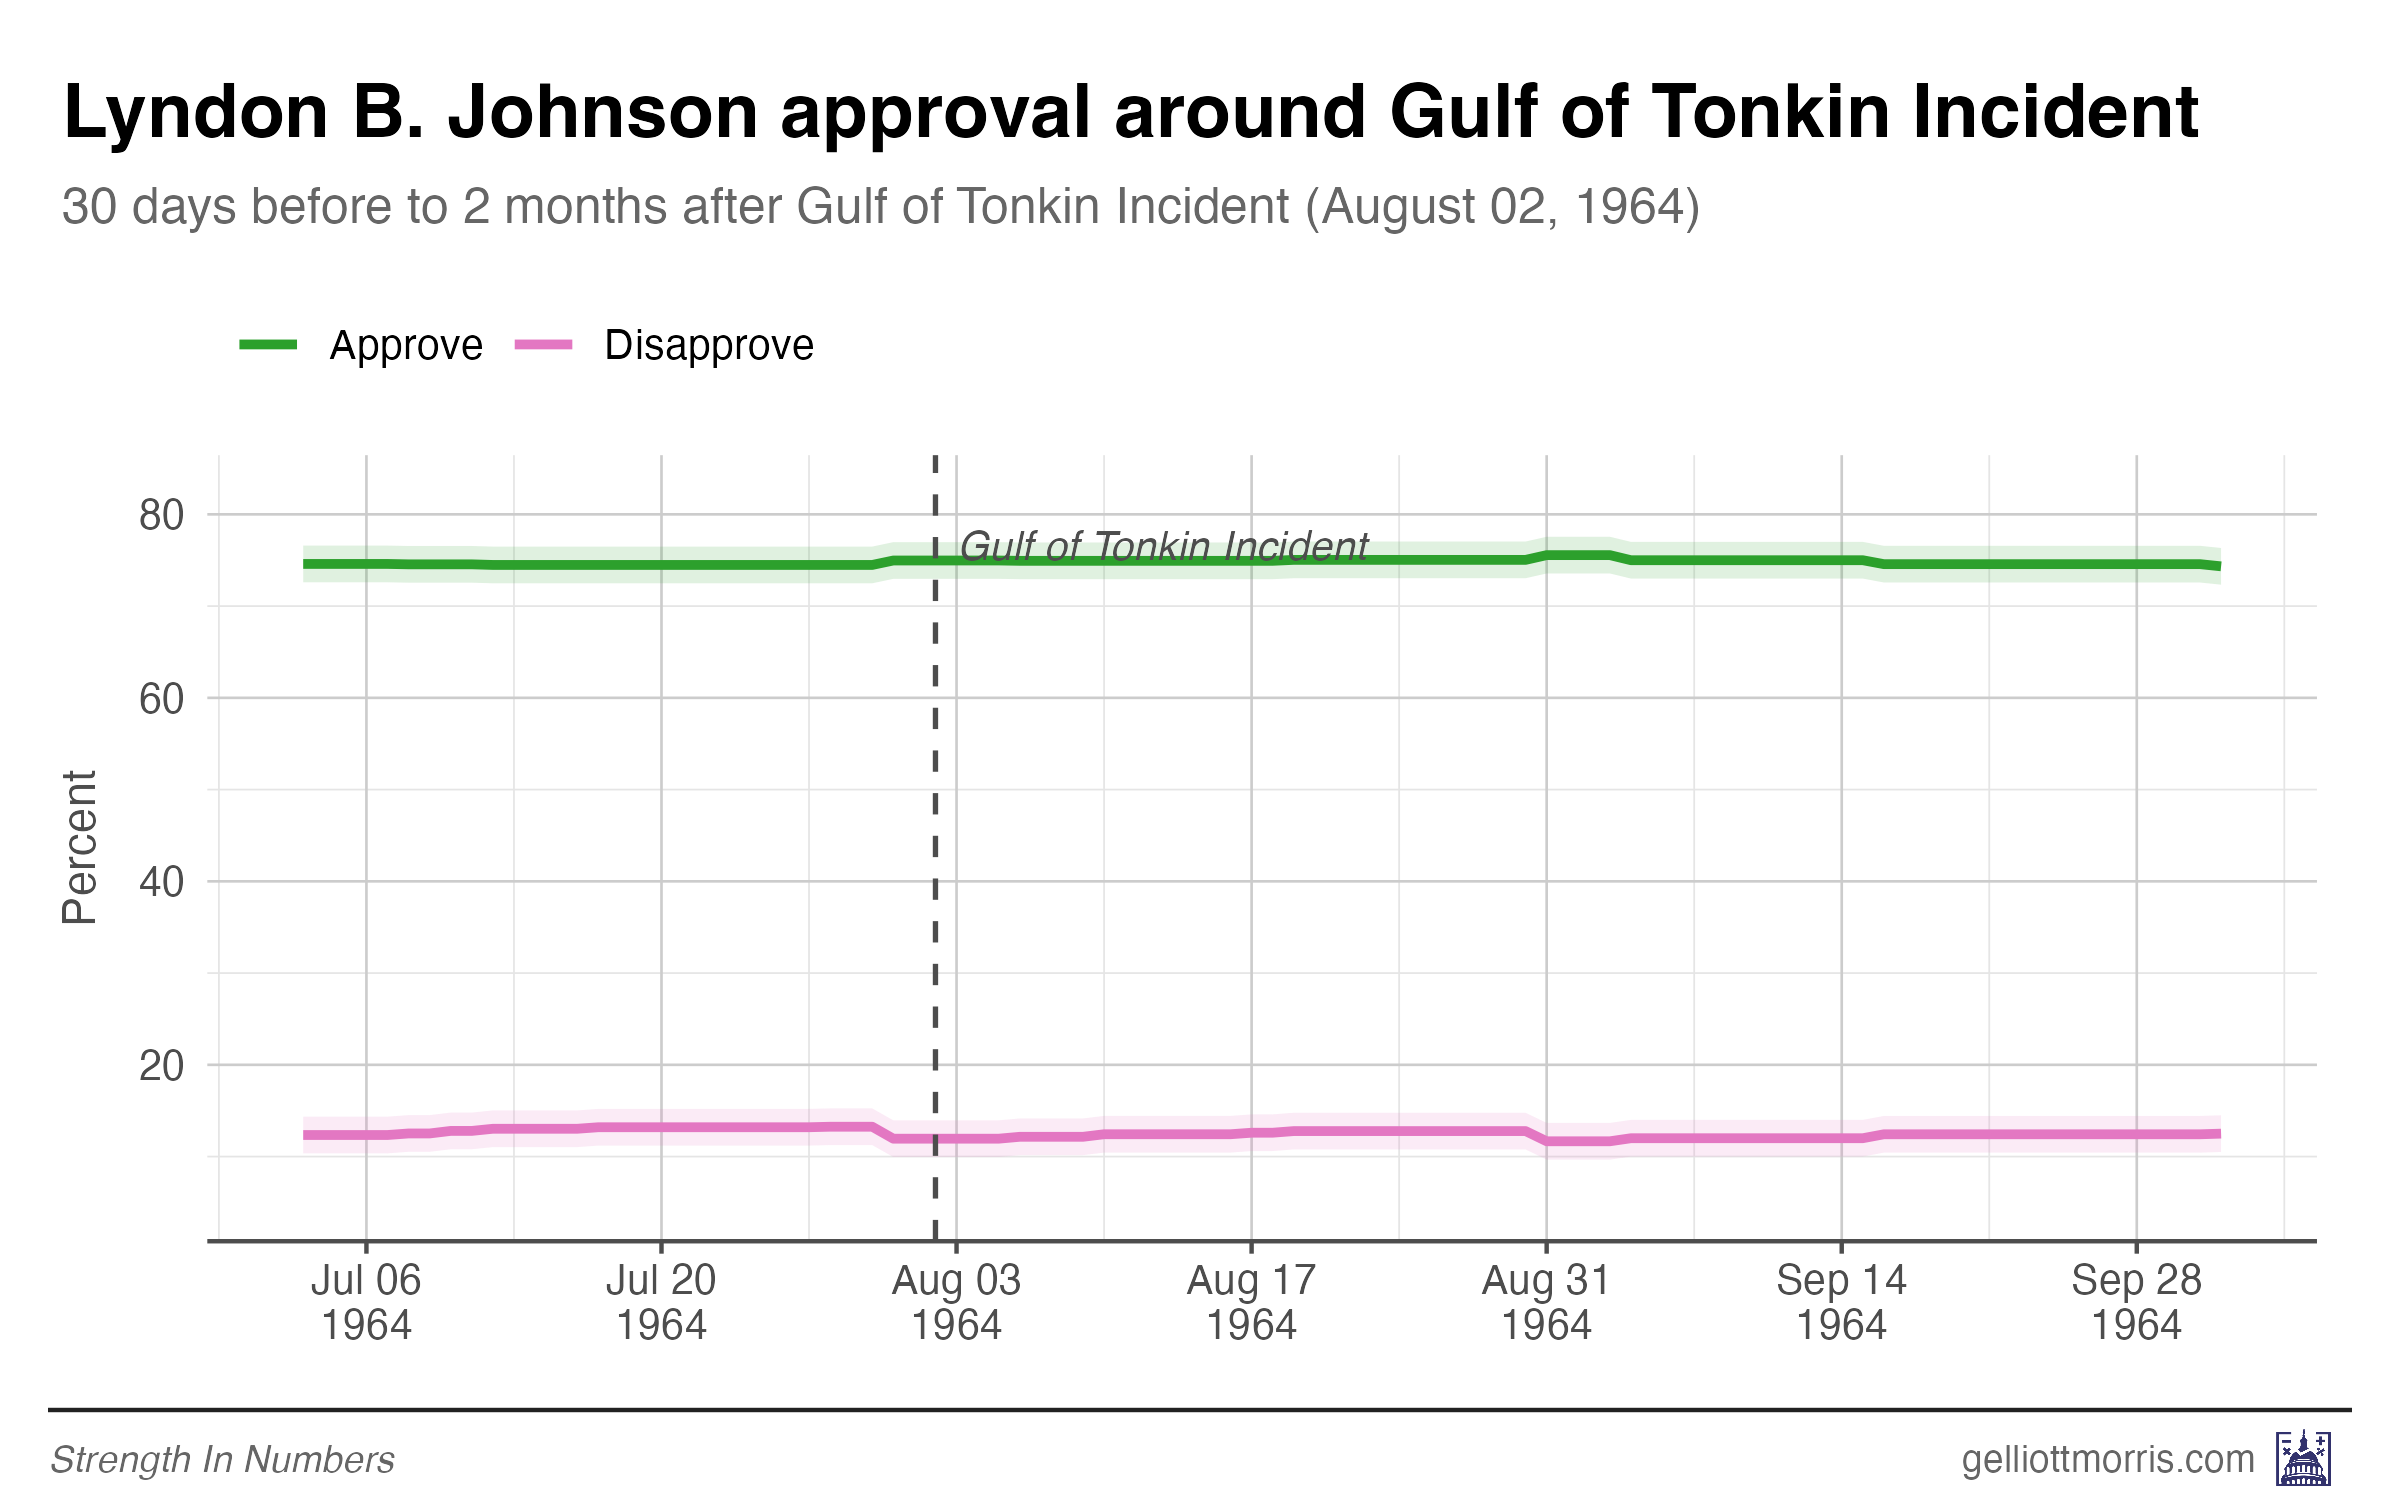
The Vietnam War is, frankly, a mess to poll, given (1) that it ramped up over time so there’s no single moment it entered American consciousness, and (2) that our post-hoc recollection of the war was that it was an unpopular quagmire, but that’s not how voters felt until 1968, 13 years into the conflict began and 4 years after the first troop surge in 1964.
Grenada (October 1983)
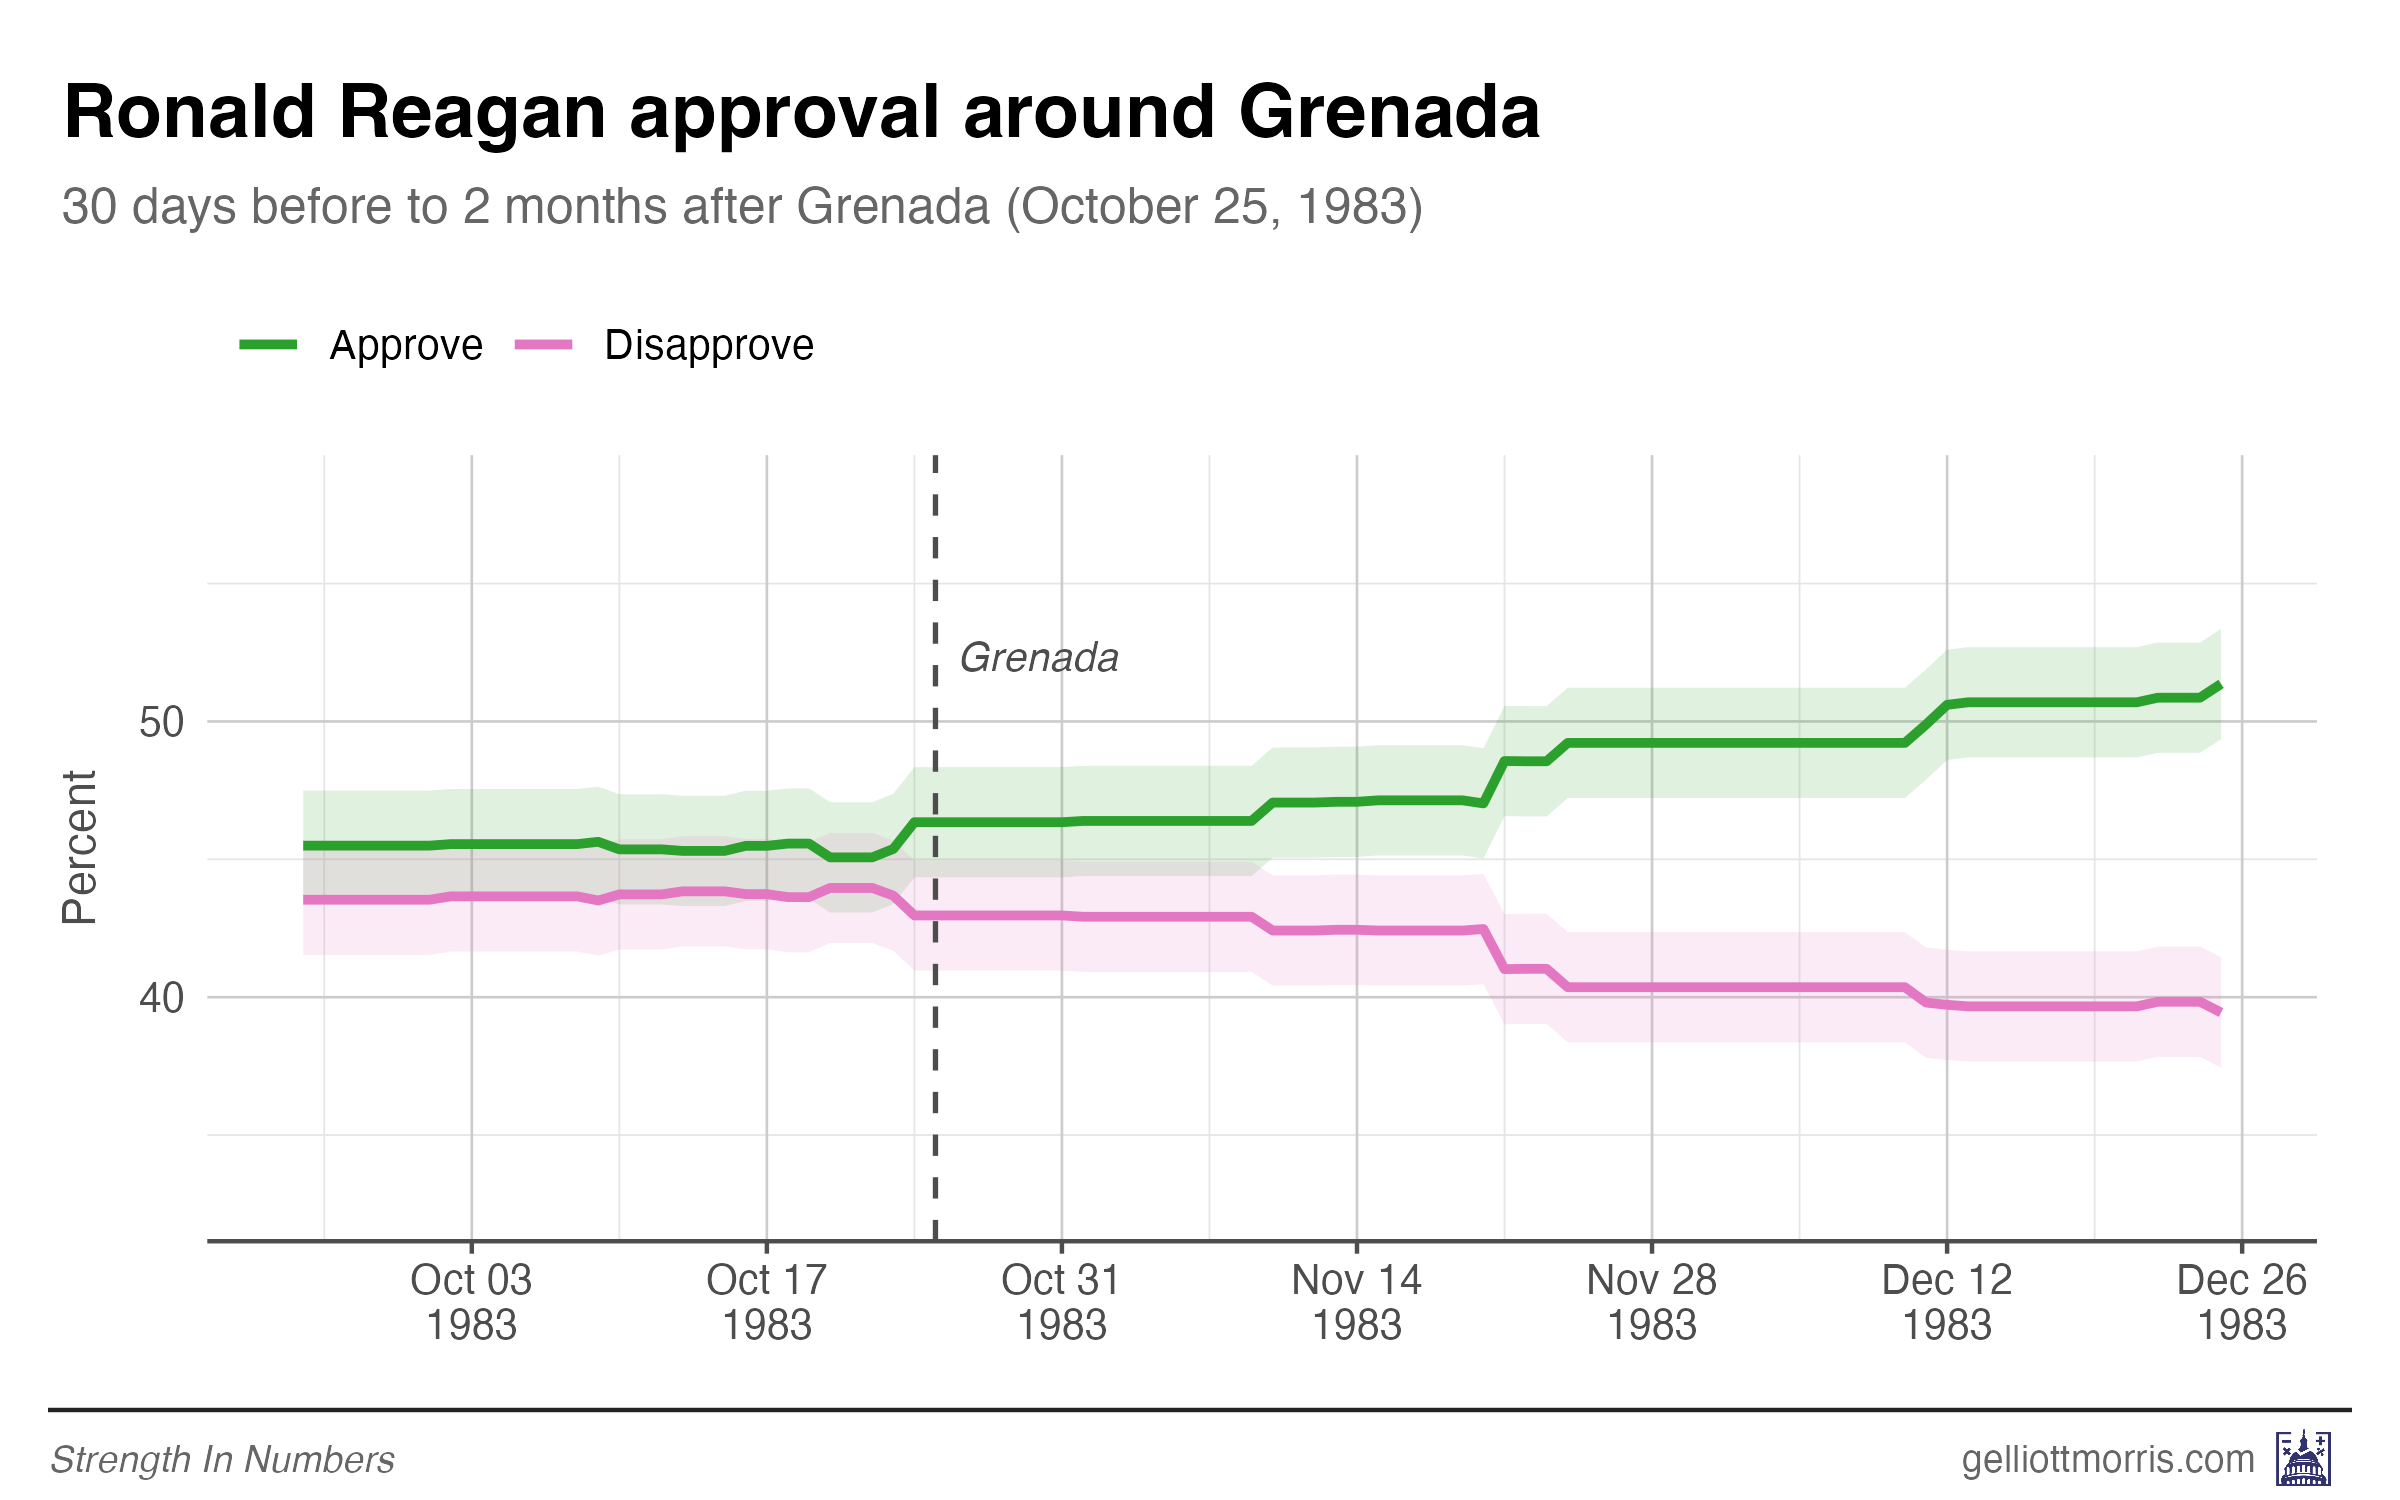
After the U.S. invaded Grenada, Ronald Reagan’s net approval climbed from +3 to +11 over two months — a gain of +9. The quick, successful operation appears to have produced a durable bump.
However, there’s a confounder in the time series: the U.S. economy was recovering sharply from the deep 1981-82 recession in mid to late 1983, and Reagan’s approval had been trending upward before the invasion. It’s hard to isolate how much of the +9 was Grenada and how much was the economic upturn happening simultaneously.
Panama (December 1989)
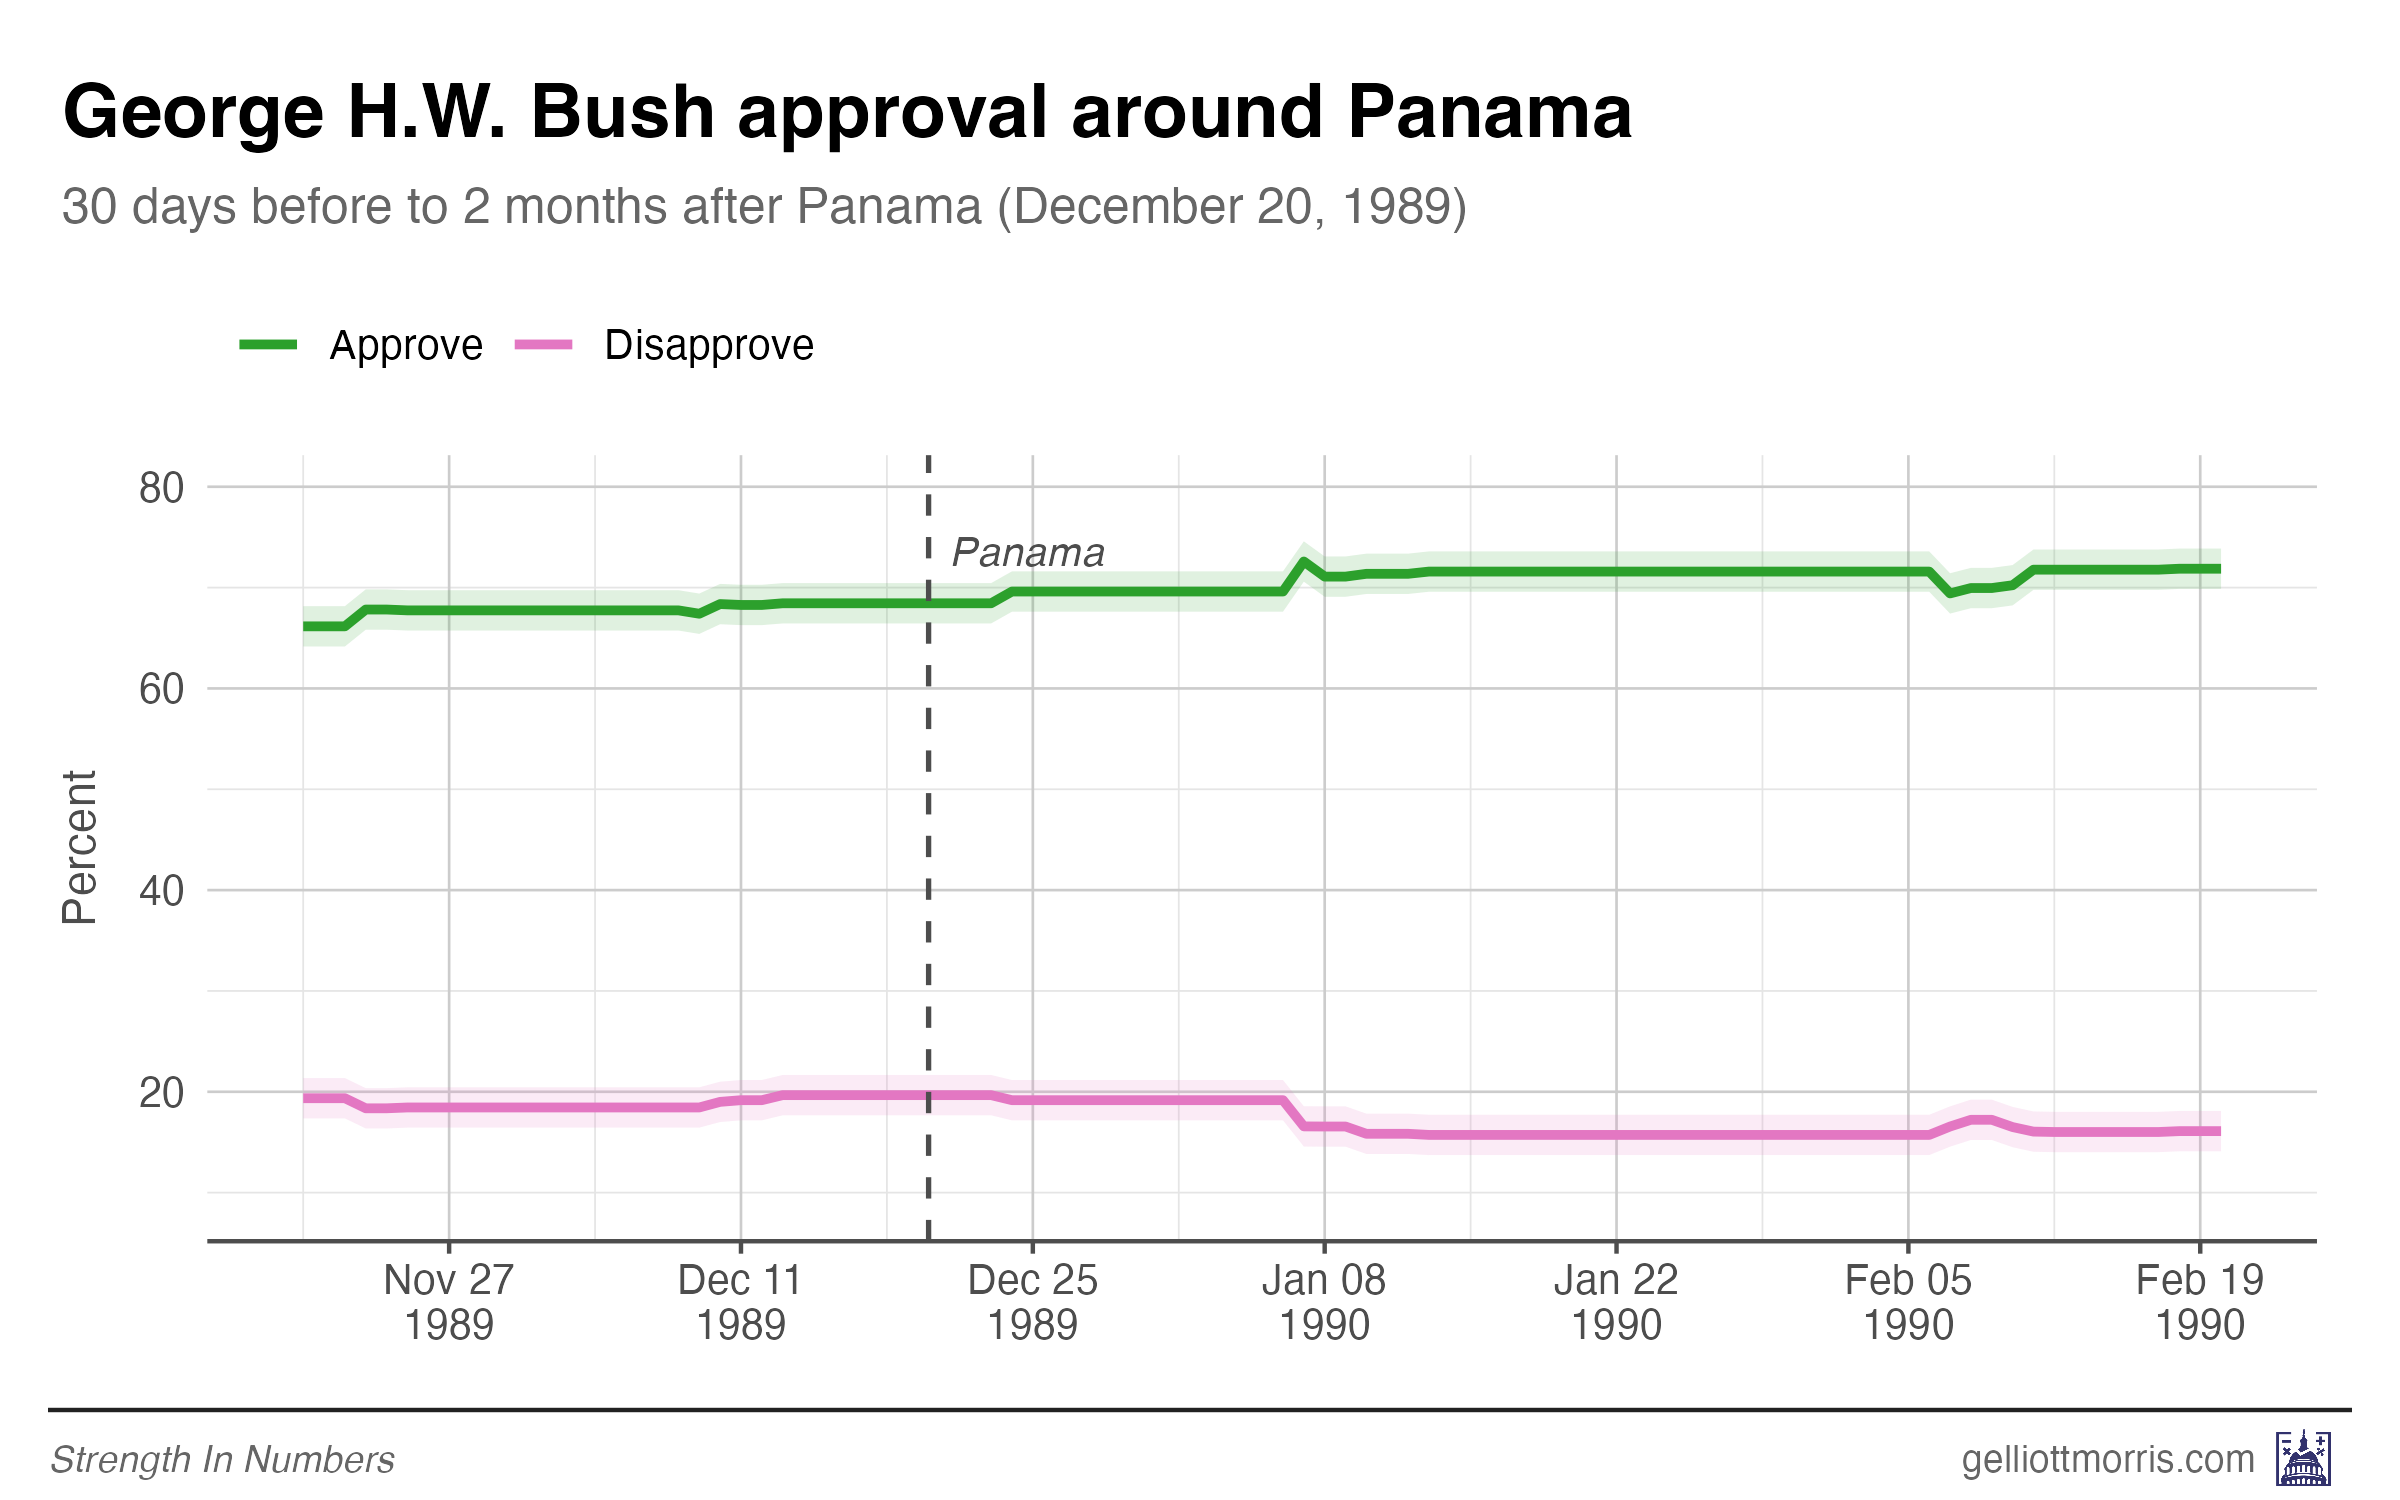
George H.W. Bush was already very popular (+49) when the invasion of Panama began in 1989. His net approval rose to +56 at two months — a +7 gain. But look at the chart: there’s really no detectable change in the immediate aftermath. Bush was at roughly 70% approval before Panama, and he stayed at roughly 70-71% after.
Like Grenada, it was a short ground operation with clear objectives and a quick resolution — but the case for a meaningful rally is thin.
Persian Gulf War (January 1991)
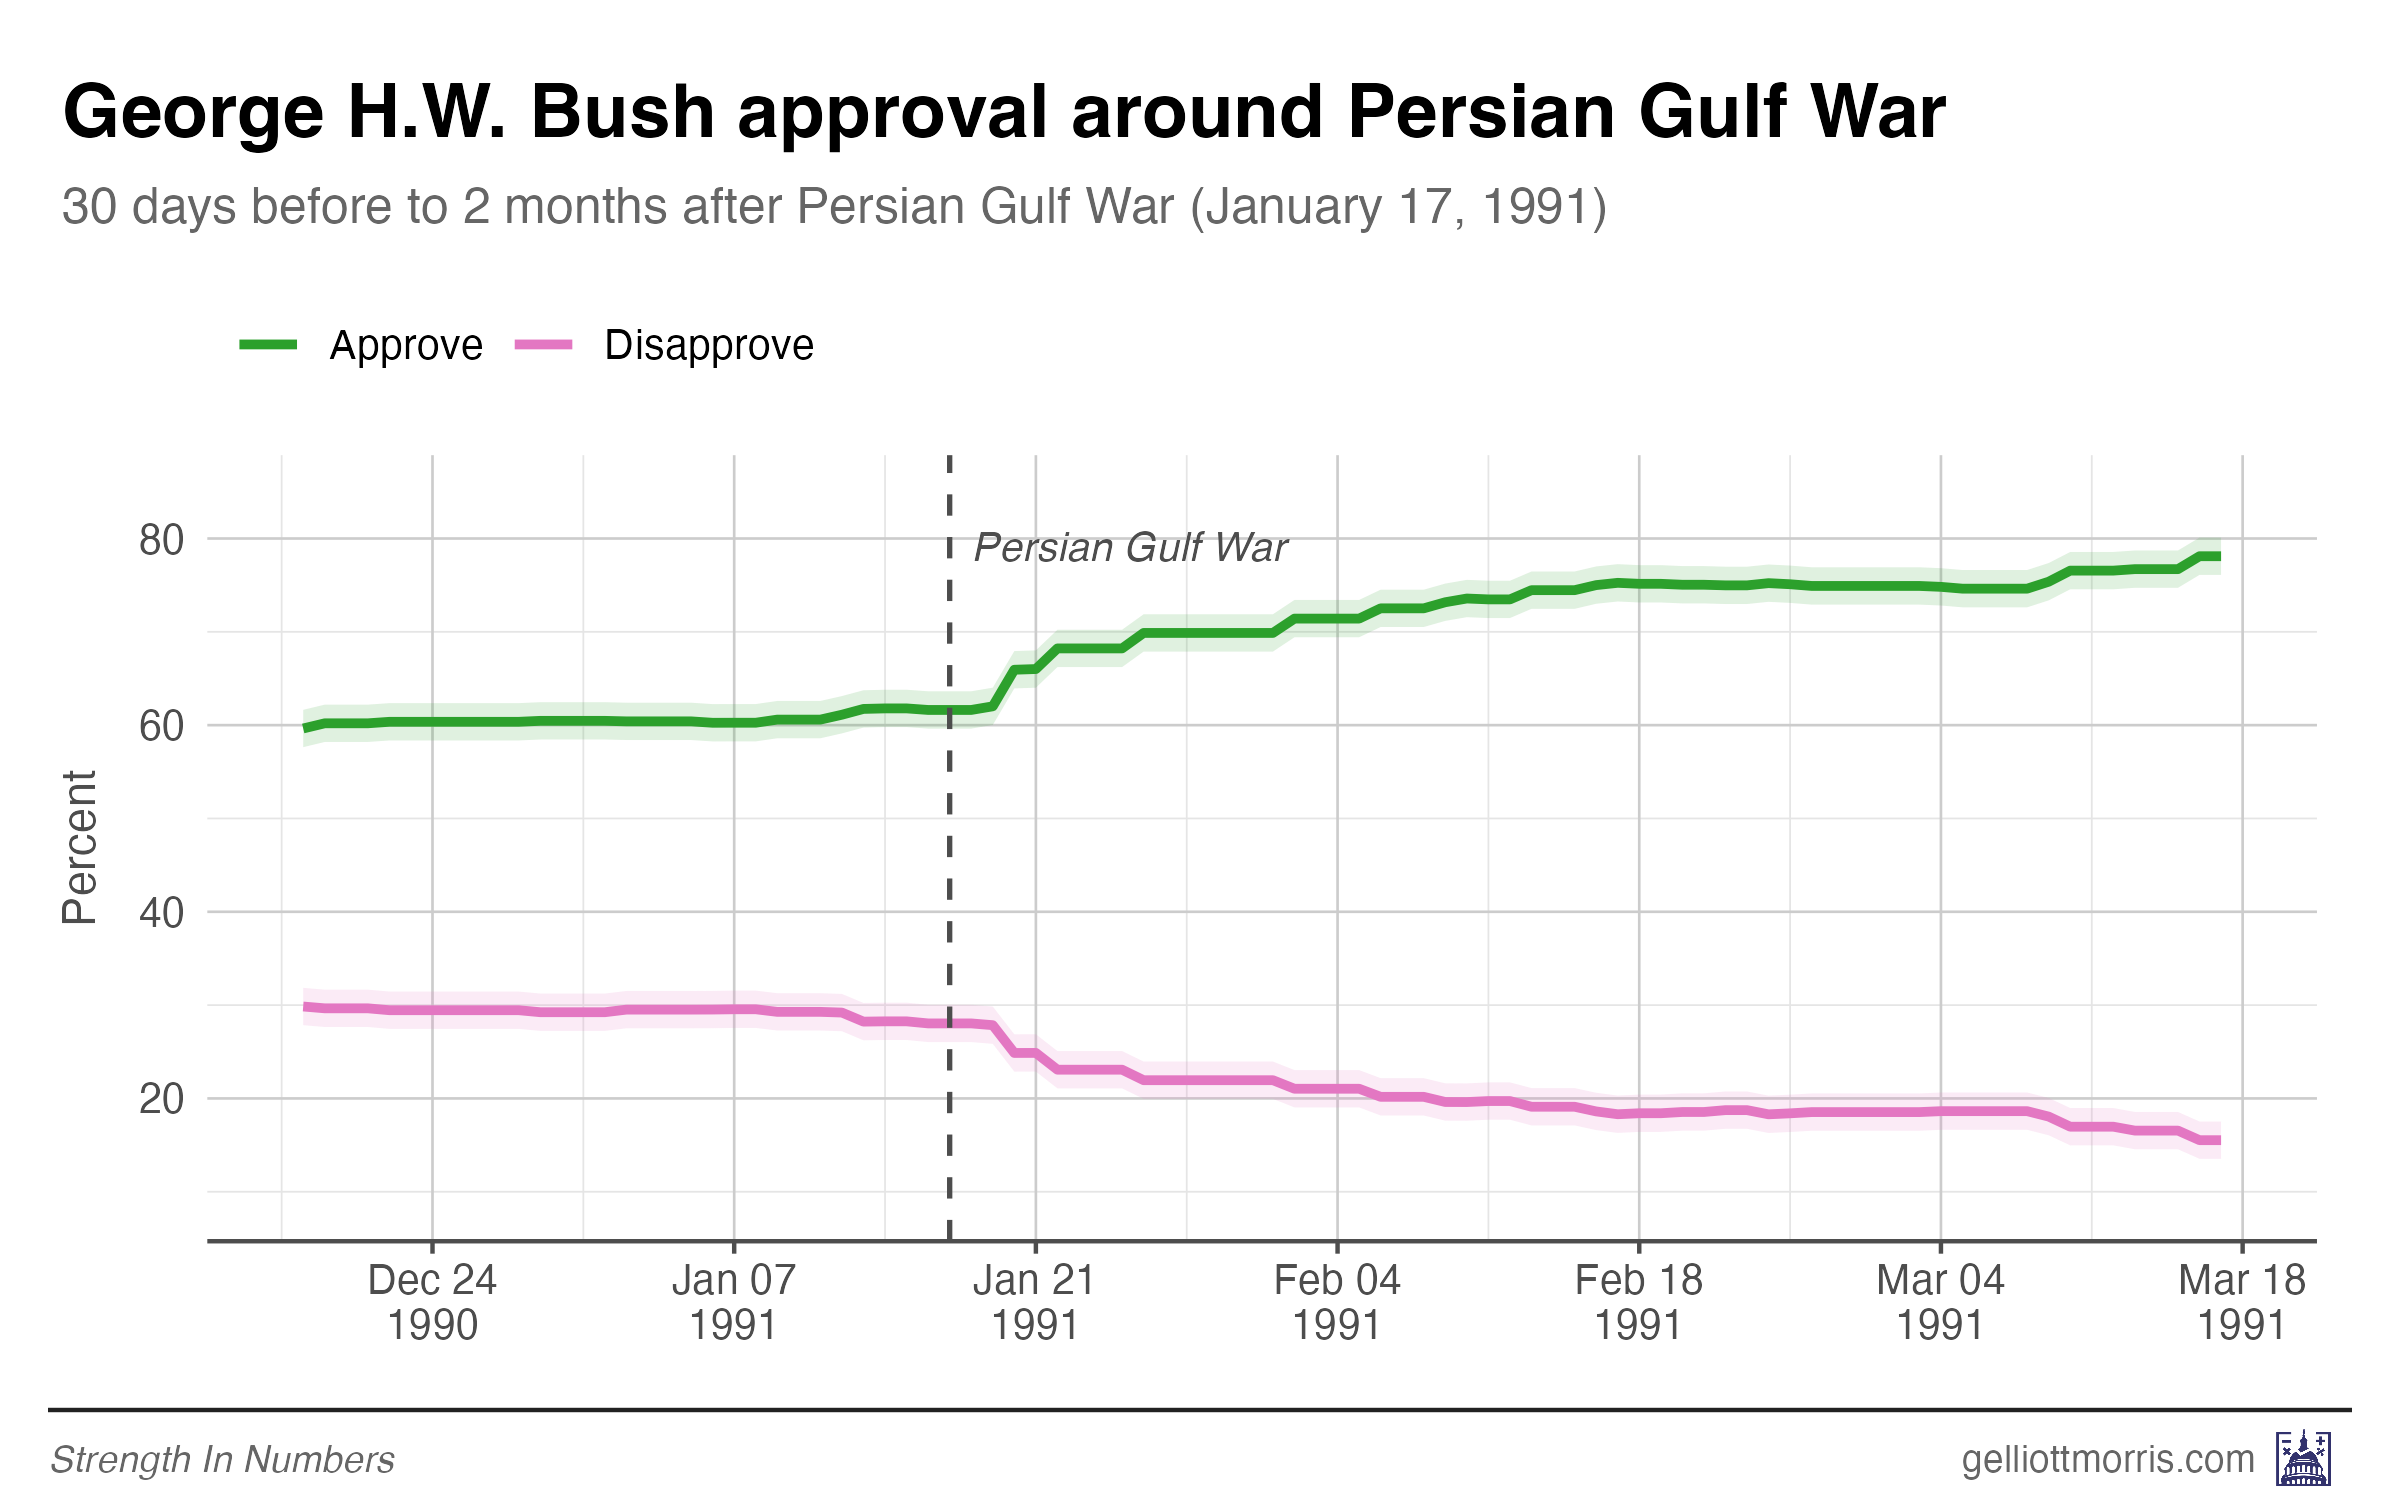
The first Gulf War represents the largest historical rally effect in our dataset. Bush Sr.’s net approval surged from +34 to +63 over two months — a gain of +29 points. He peaked at +65 in April 1991, with 79% approval and just 15% disapproval. The rapid, decisive victory drove Bush to some of the highest approval ratings in modern polling history.
Then, it all evaporated. Thanks to an economic recession in 1992, by Election Day, Bush was at -20 and lost to Clinton. The Gulf War rally is the best argument that even the biggest bumps don’t last.
Kosovo (March 1999)
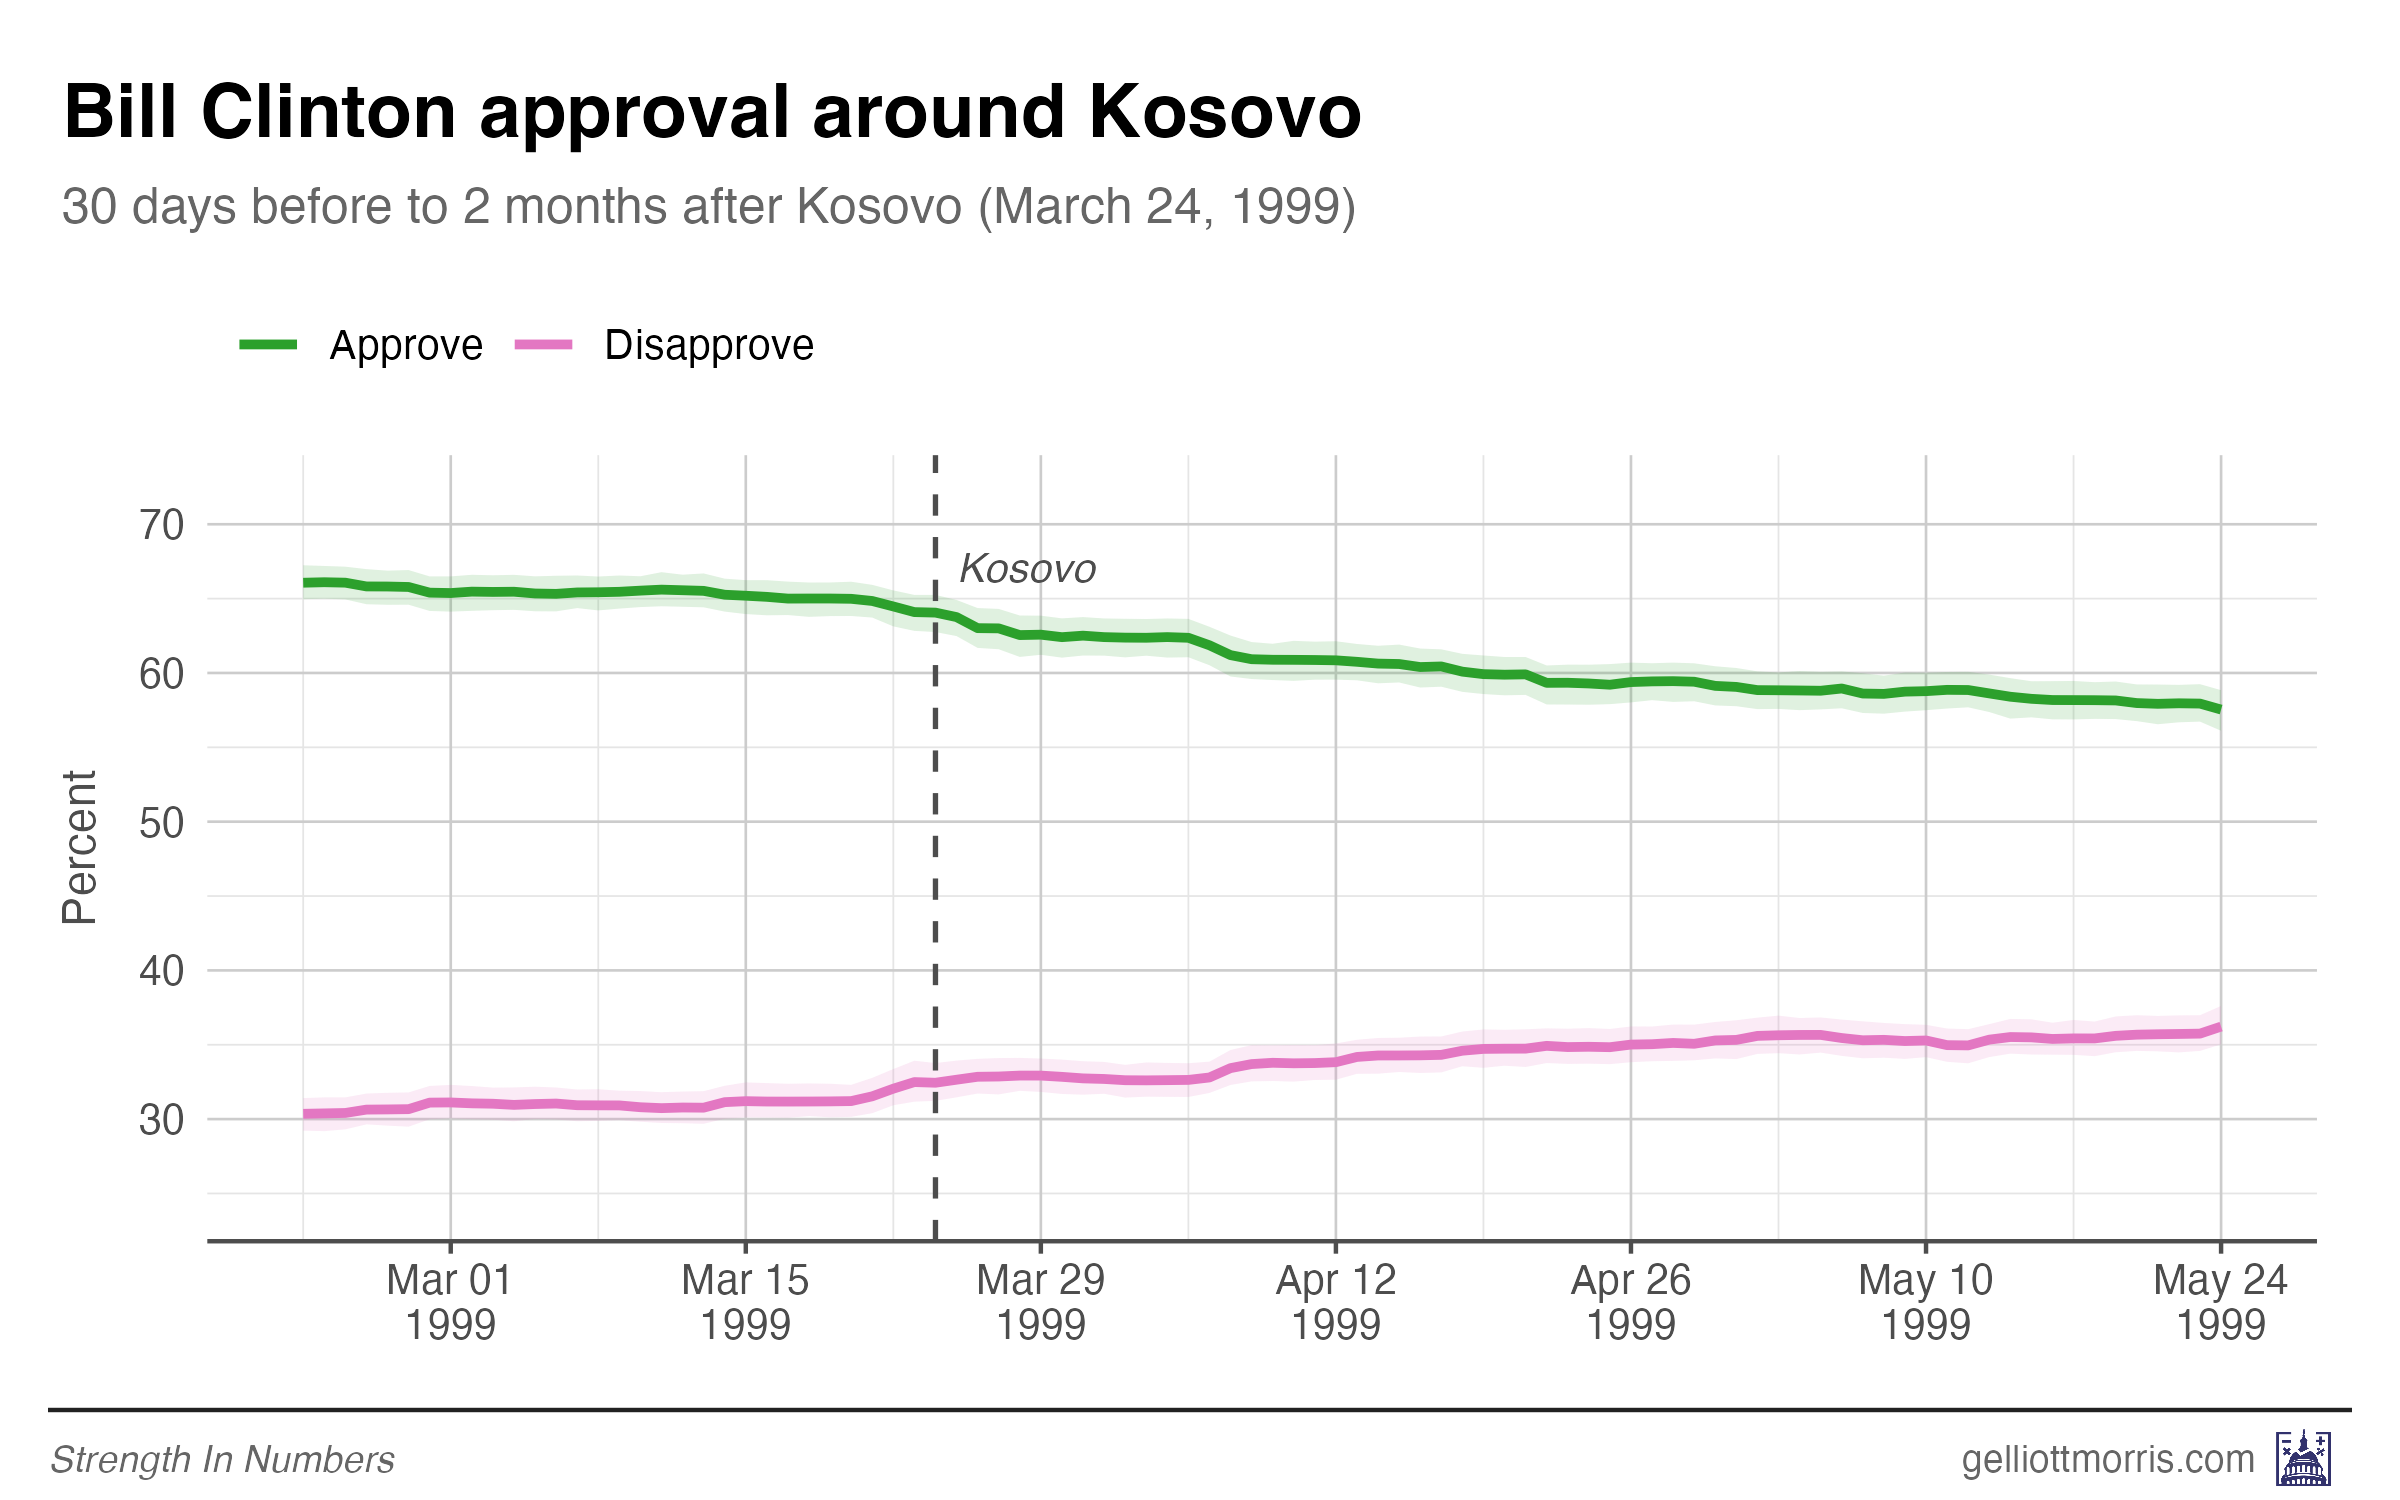
Now here’s an interesting chart. The public’s response to the U.S. involvement in Kosovo is the first “rally” that appears at first glance to be negative. Clinton’s approval sank by about 10 points in the 2 months after the U.S. joined joint NATO operations in the Balkan state.
However, the decline may have been caused by multiple factors. First, Clinton entered Kosovo near his all-time high in approval: Gallup had him at 68-69% approval in late January and mid-February 1999, so it may have been natural for him to lose some support as the trend reverted to the mean.
Second, around this time, the Senate also acquitted Clinton on charges of perjury and obstruction of justice related to his relationship with Monica Lewinsky. During impeachment, the Miller Center notes many voters separated Clinton’s personal misconduct from job performance — his ratings were near 70%, Miller speculates, because Americans were happy with the economy and saw the Republican impeachment push as overreach.

If you want more reporting like this — grounded in polling, historical data, and political science instead of cable-news mythology — become a paying member of Strength In Numbers to receive exclusive content — including the weekly Tuesday Deep Dive, access to the Strength In Numbers/Verasight monthly poll, and more.
But Kosovo was still definitely unpopular. It’s likely the U.S. involvement accelerated Clinton’s declining ratings — or, at the very least, Clinton got no bounce. Pew found in April 1999 that Clinton’s foreign-policy approval fell from 56% to 51%, and his overall job approval dropped from 62% to 56%. Pew explicitly said the situation in Yugoslavia was “taking a toll” on his rating.
So the Kosovo shock for Clinton was really a combination of post-impeachment normalization, foreign-policy drag from the air campaign, and broader fatigue with Clinton’s presidency (74% told Pew in April they were tired of the problems associated with his administration). But the chart is still striking, showing a steady downward slope across two months, from +32 to +22.
Afghanistan (October 2001)
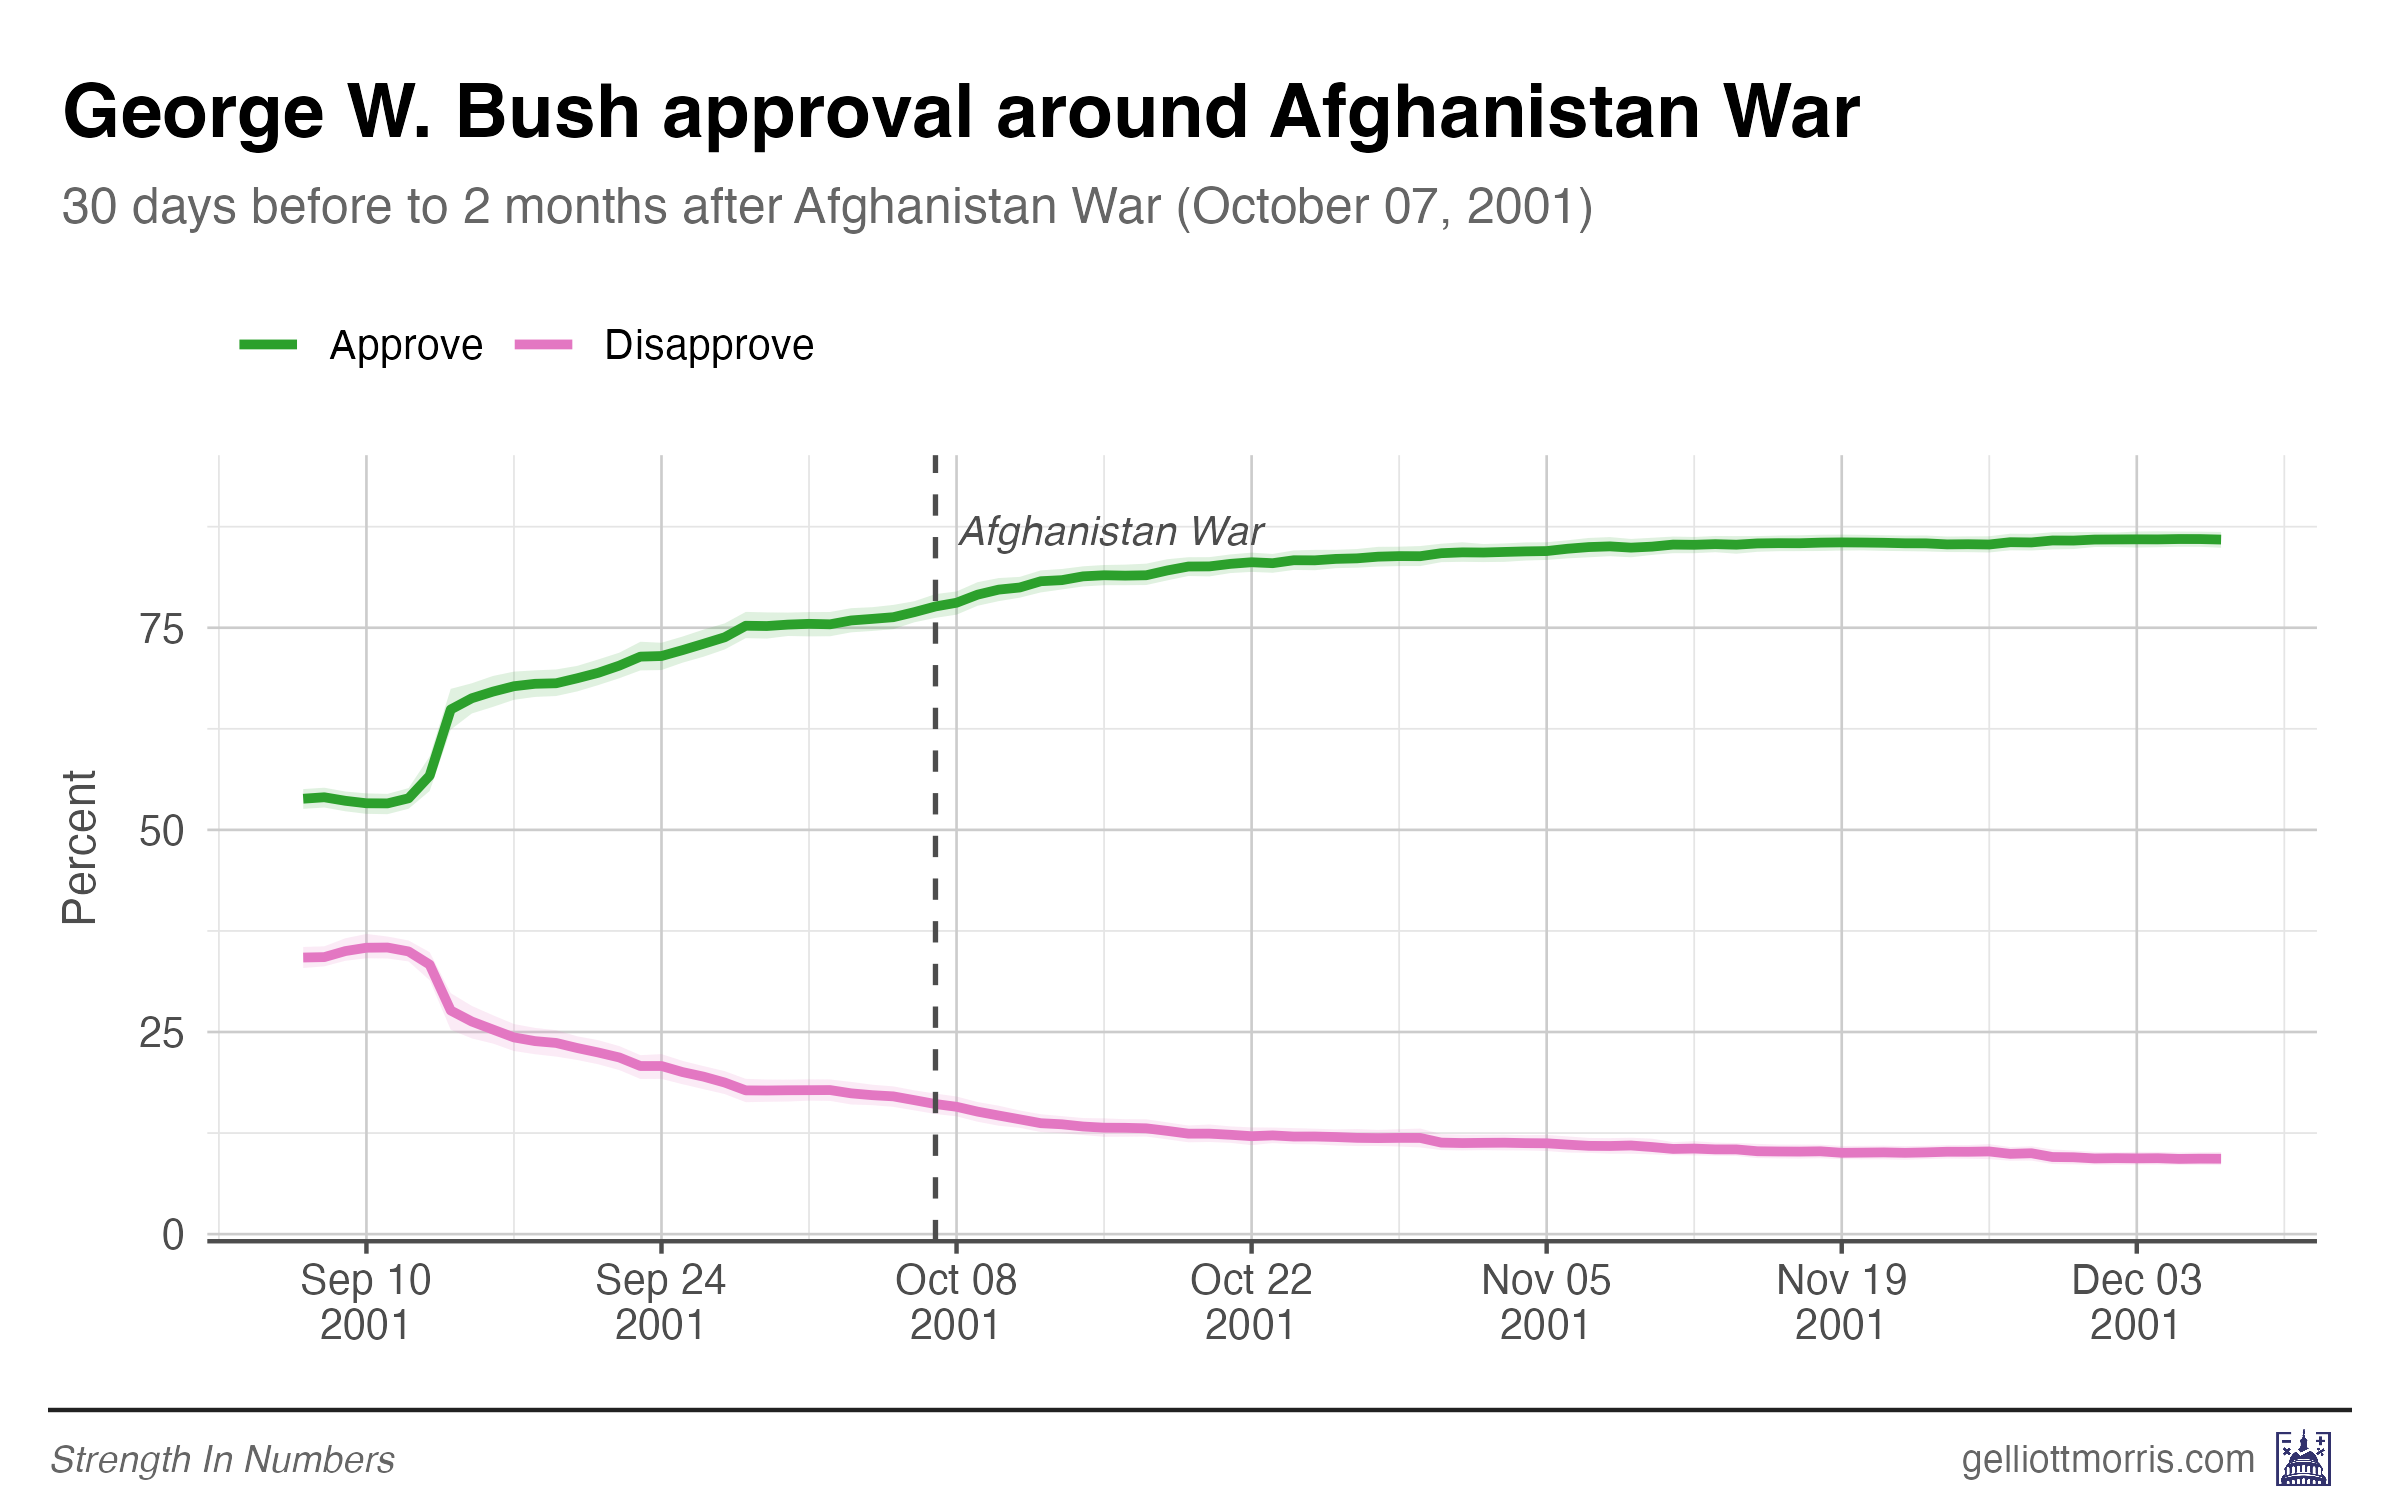
The post-9/11 rally in Bush’s approval rating was already well underway by the time the U.S. launched military operations in Afghanistan on October 7. George W. Bush had surged from +18 on September 10 to +62 by the war’s start. On paper, the conflict appears to have pushed him even higher, to +77 at two months after.
Bush’s +77 is actually the highest average net approval rating ever recorded for a U.S. president (86% approve, 9% disapprove). It rivals Harry Truman’s rating in May 1945 after the defeat of Nazi Germany, and Franklin D. Roosevelt’s rating in early 1942 shortly after Pearl Harbor.
But here’s the problem with counting Afghanistan as a “war rally”: the massive surge in support for the president after 9/11 takes some time to get factored into a polling average. You can’t cleanly separate the effect of the war from the effect of the attack. The rally was enormous, bipartisan, and powered by the kind of national shock that the literature says is required. But how much of it was the invasion of Afghanistan vs. 9/11 is unknowable.
If you look at individual approval polls instead of averages, the Afghanistan “rally” vanishes:
Iraq War (March 2003)
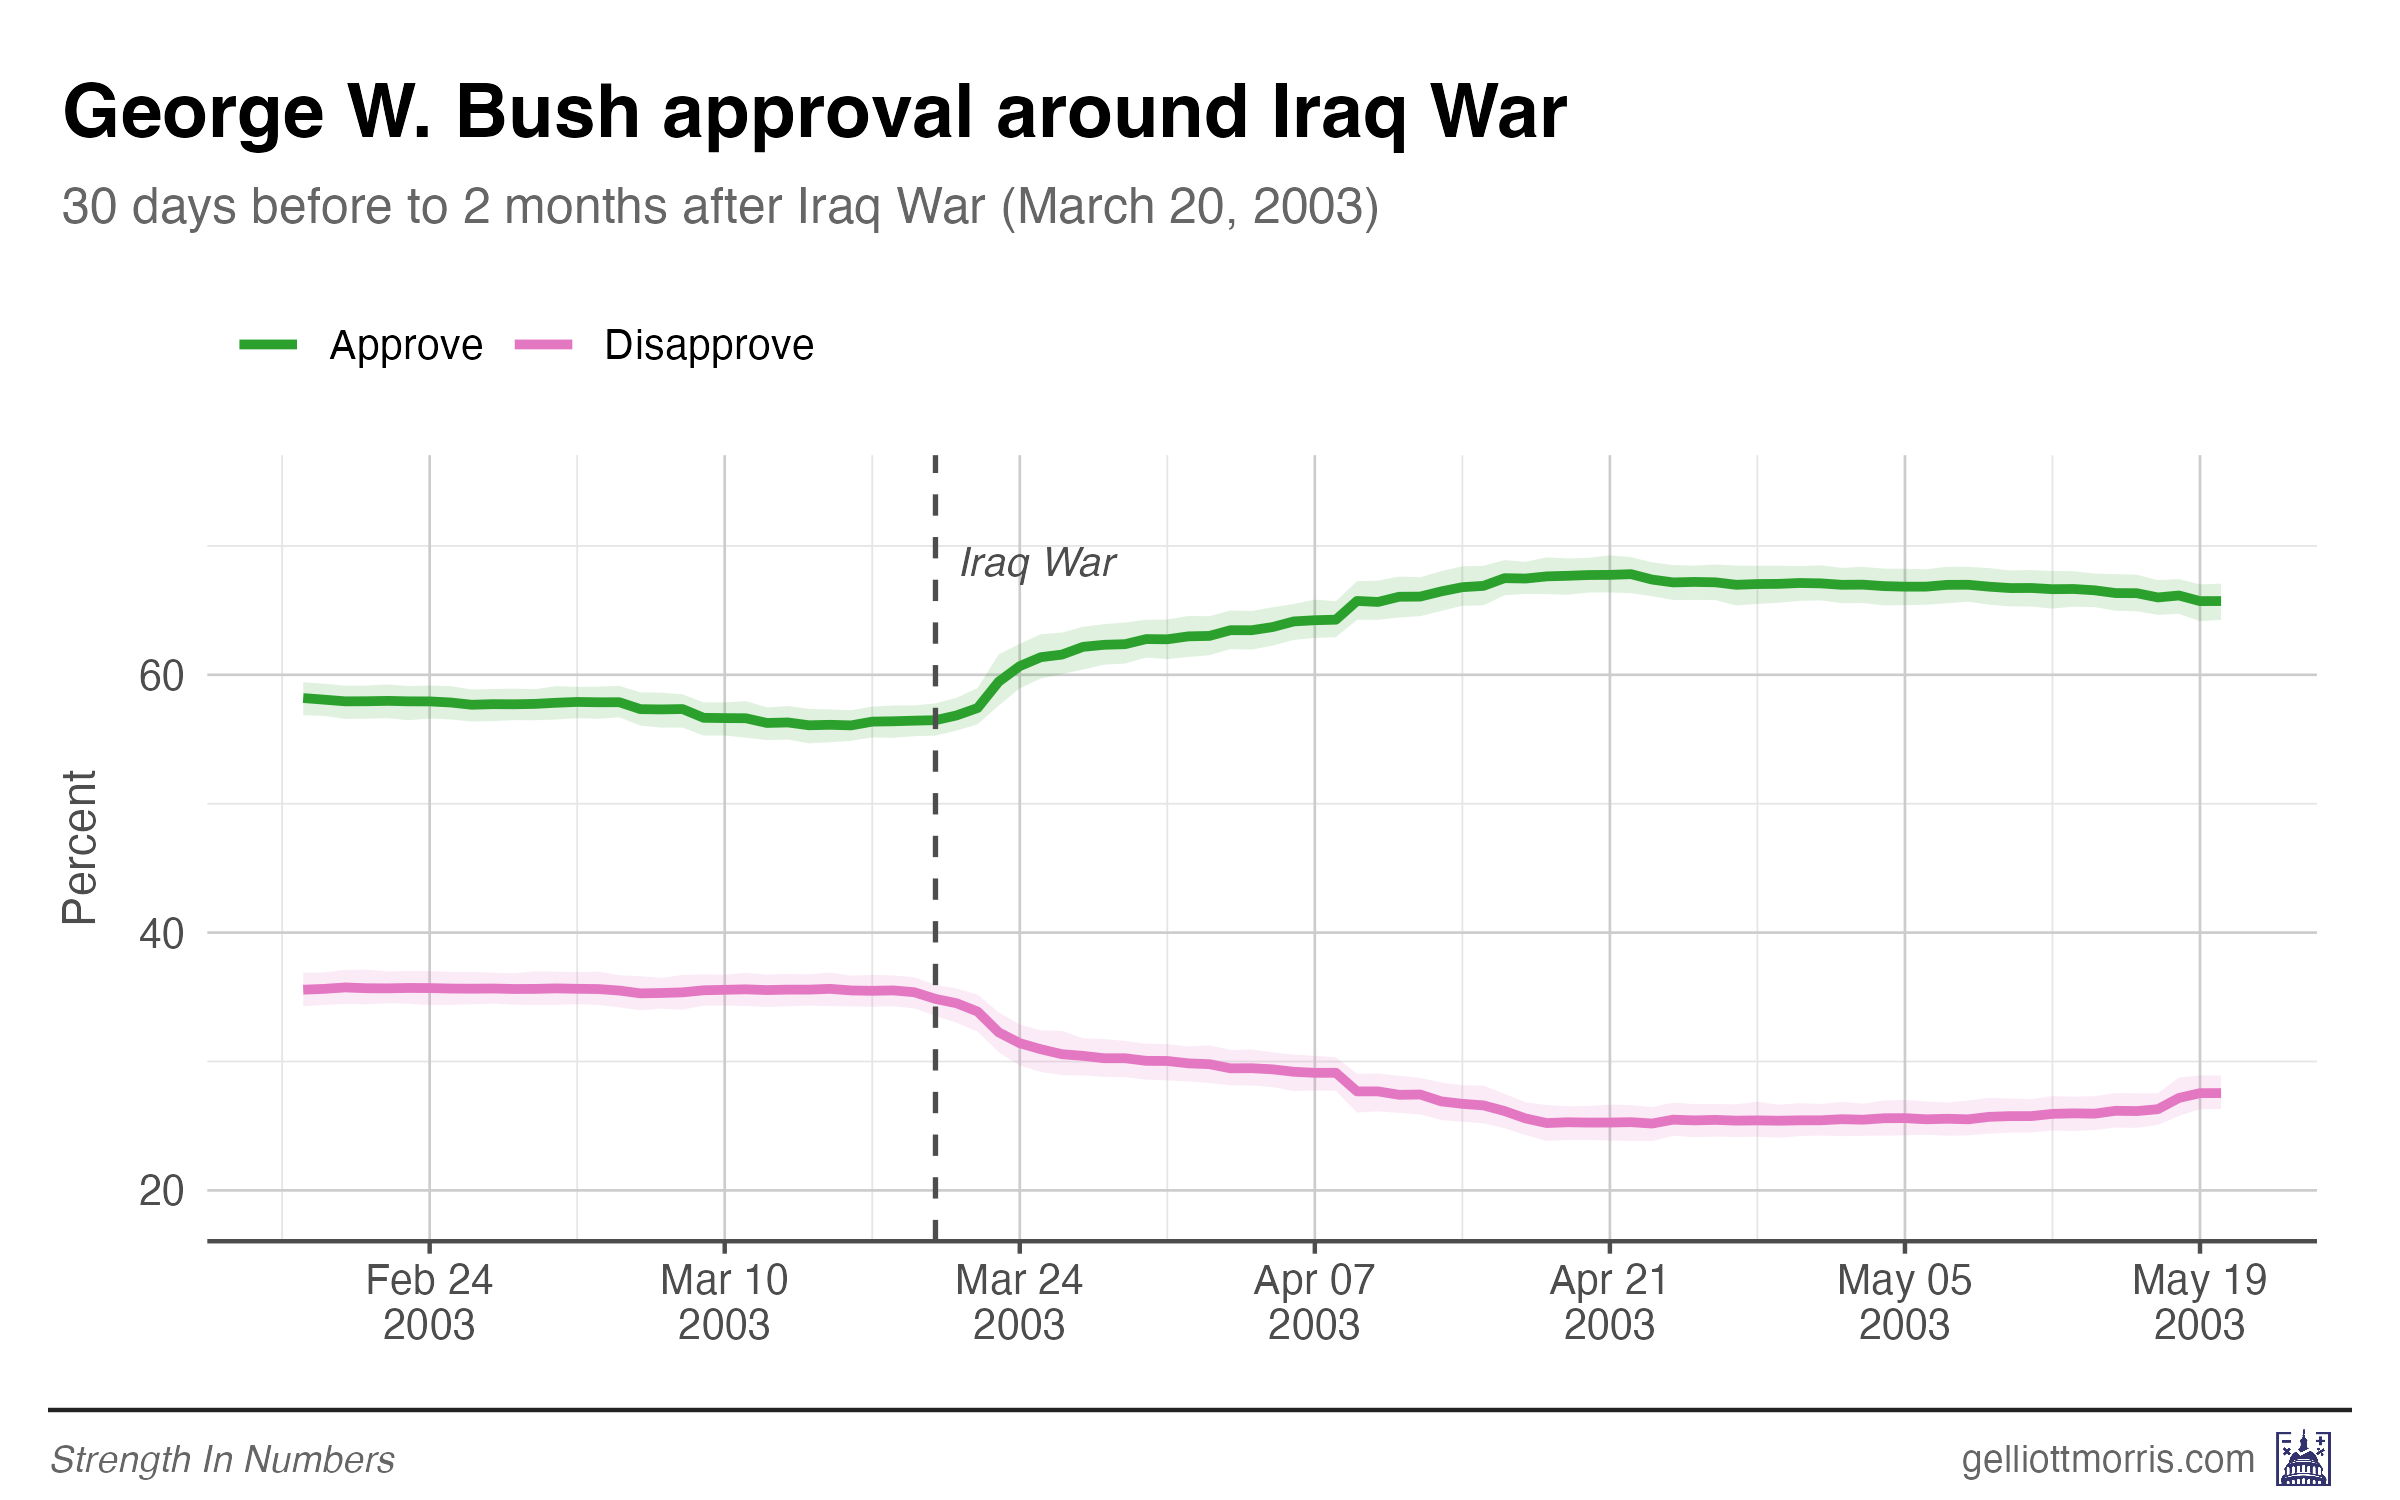
After the invasion of Iraq in March 2003, Bush’s net approval surged from +22 to a peak of +43 one month after. But it was already fading by day 60 (+38). By six months, he was nearly back to pre-war levels (+14).
This may have foreshadowed the long-term decline in popularity of the Iraq war. Bush’s approval rating eroded significantly as the U.S. occupation dragged on, and the rationale for going to war fell apart.
Libya (March 2011)
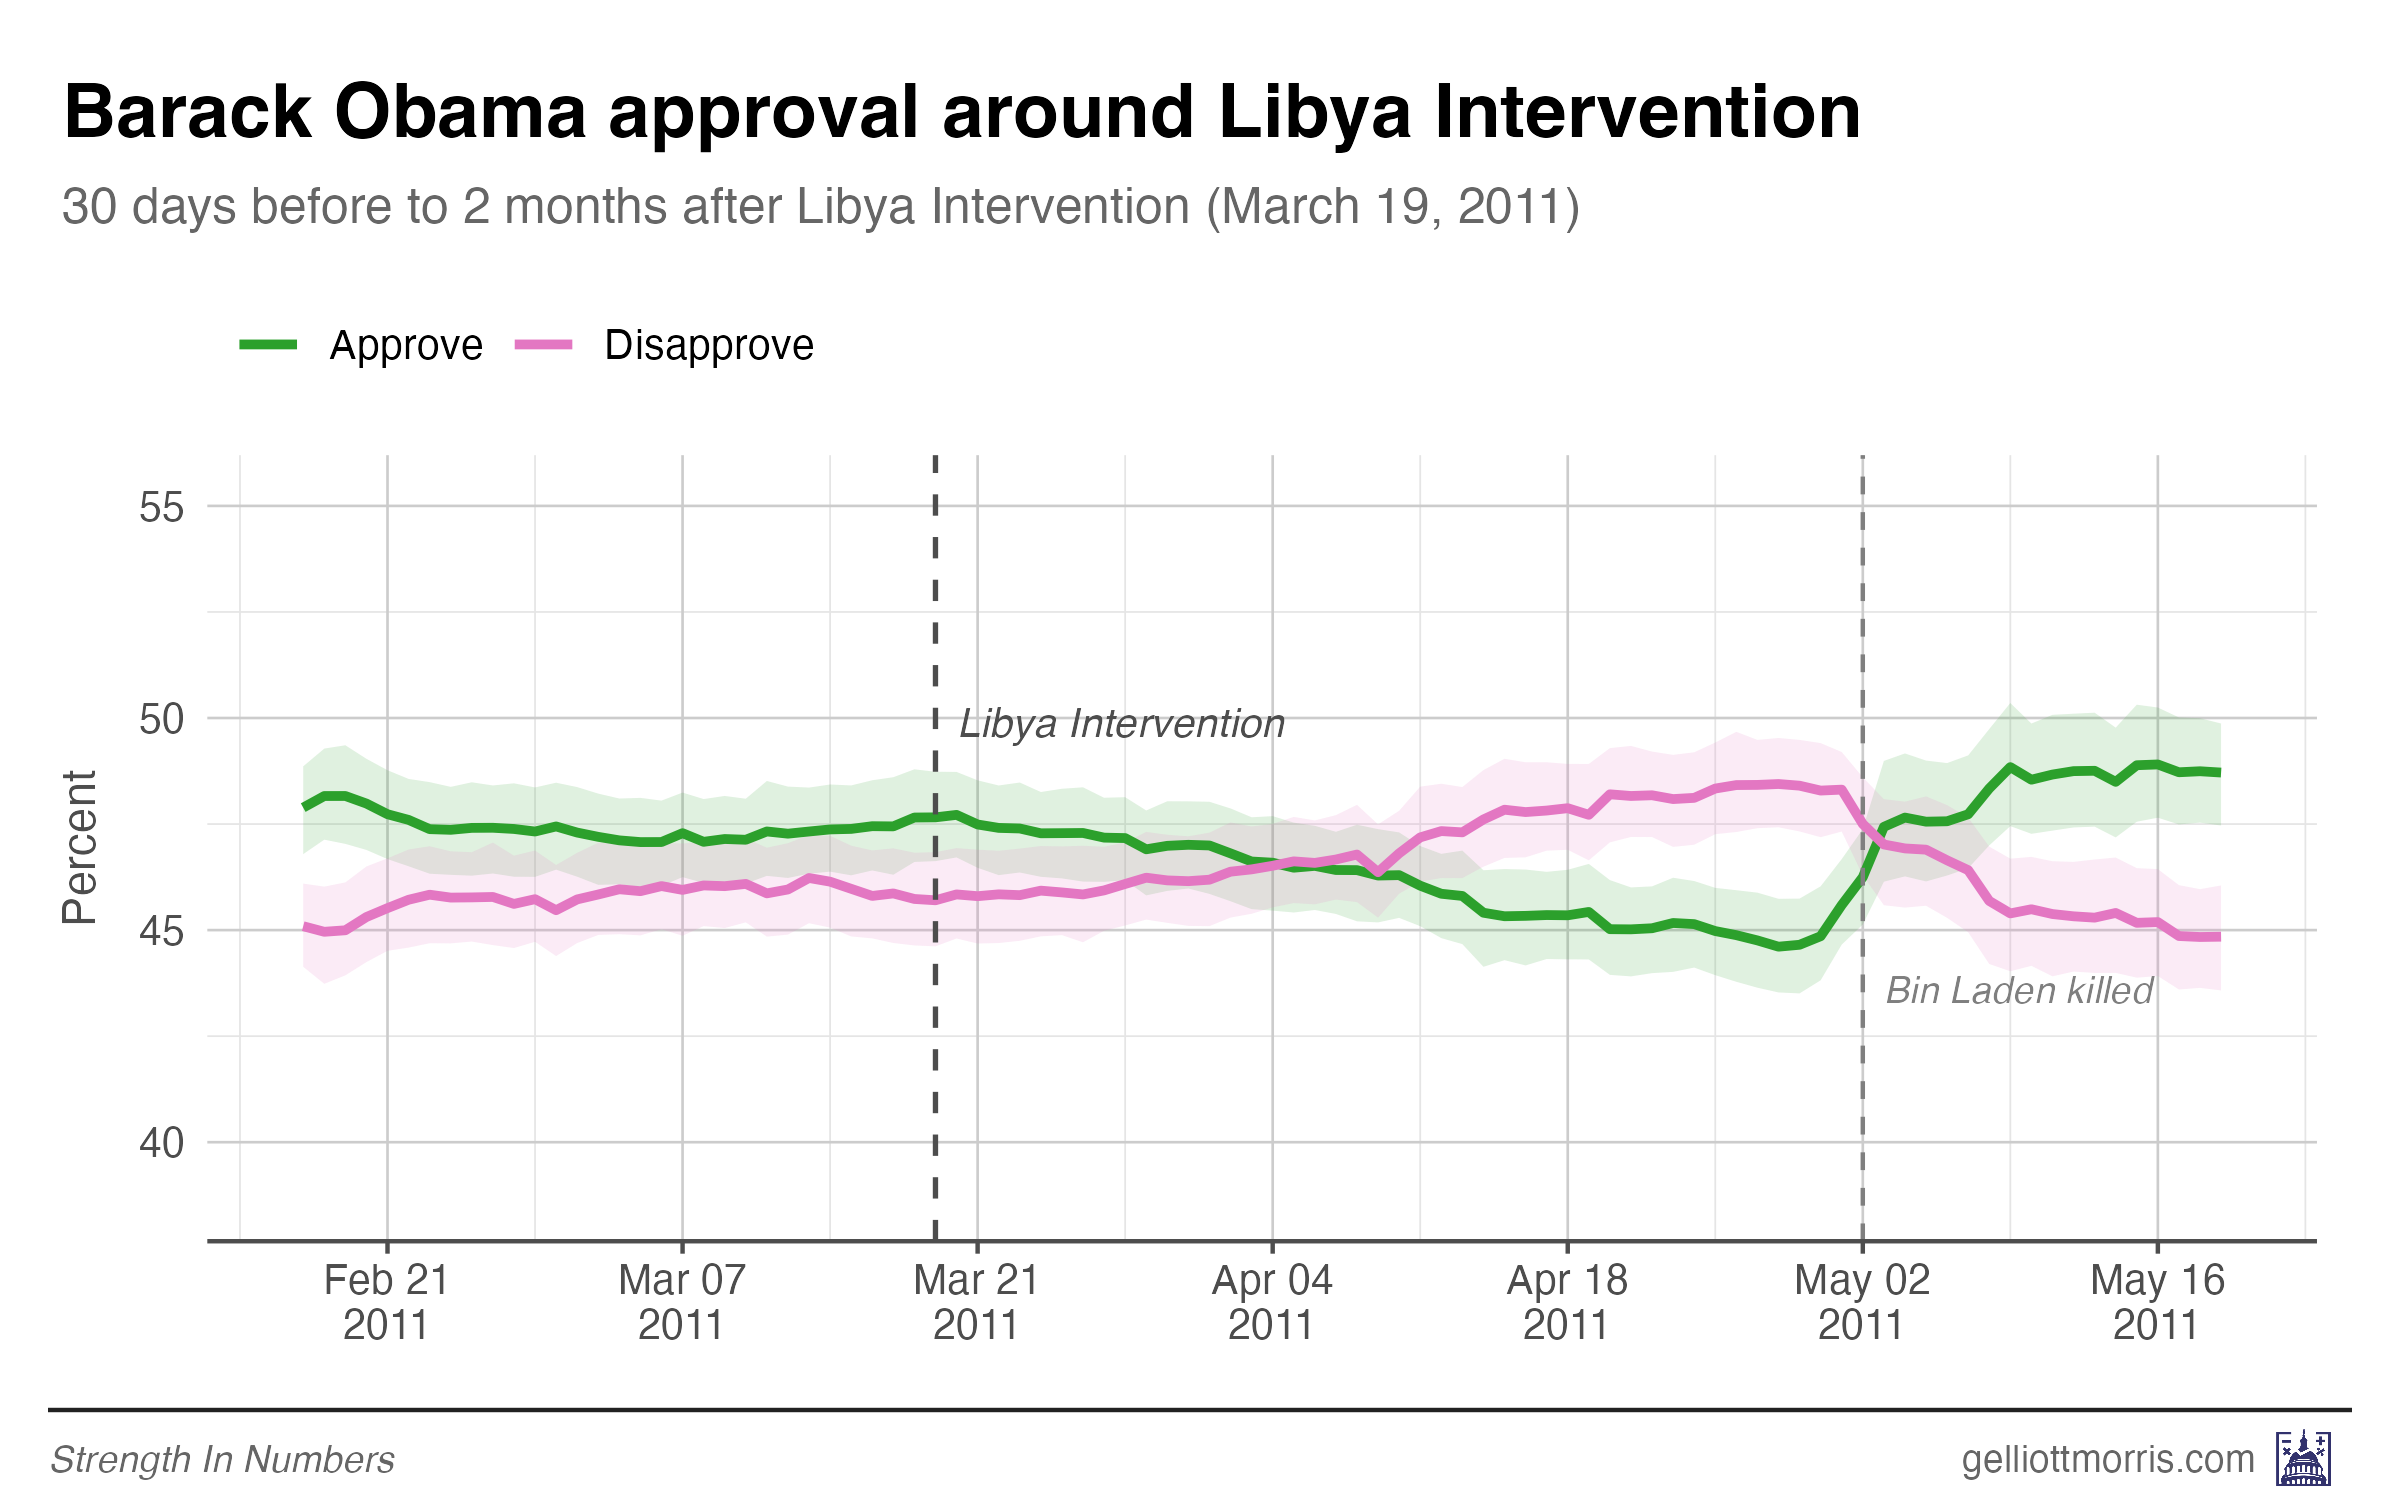
Finally, for historical events, we get to Libya in 2011. Barack Obama started the Libya intervention at a net approval rating of +2 and saw a slight decline to -2 at one month. Then, he saw an increase to +4 at two months. This coincides almost exactly with the killing of Osama bin Laden on May 1, 2011.
We don’t know what Obama’s approval would have been without the bin Laden killing. But the Libya intervention itself was another air campaign — like Kosovo before it and now, Iran — and failed to produce a sustained approval bounce.
How Trump’s war in Iran stacks up
And now we get to Trump’s war in Iran. There has been functionally no change in the polls in the two weeks after the conflict started.
Iran (February 2026)
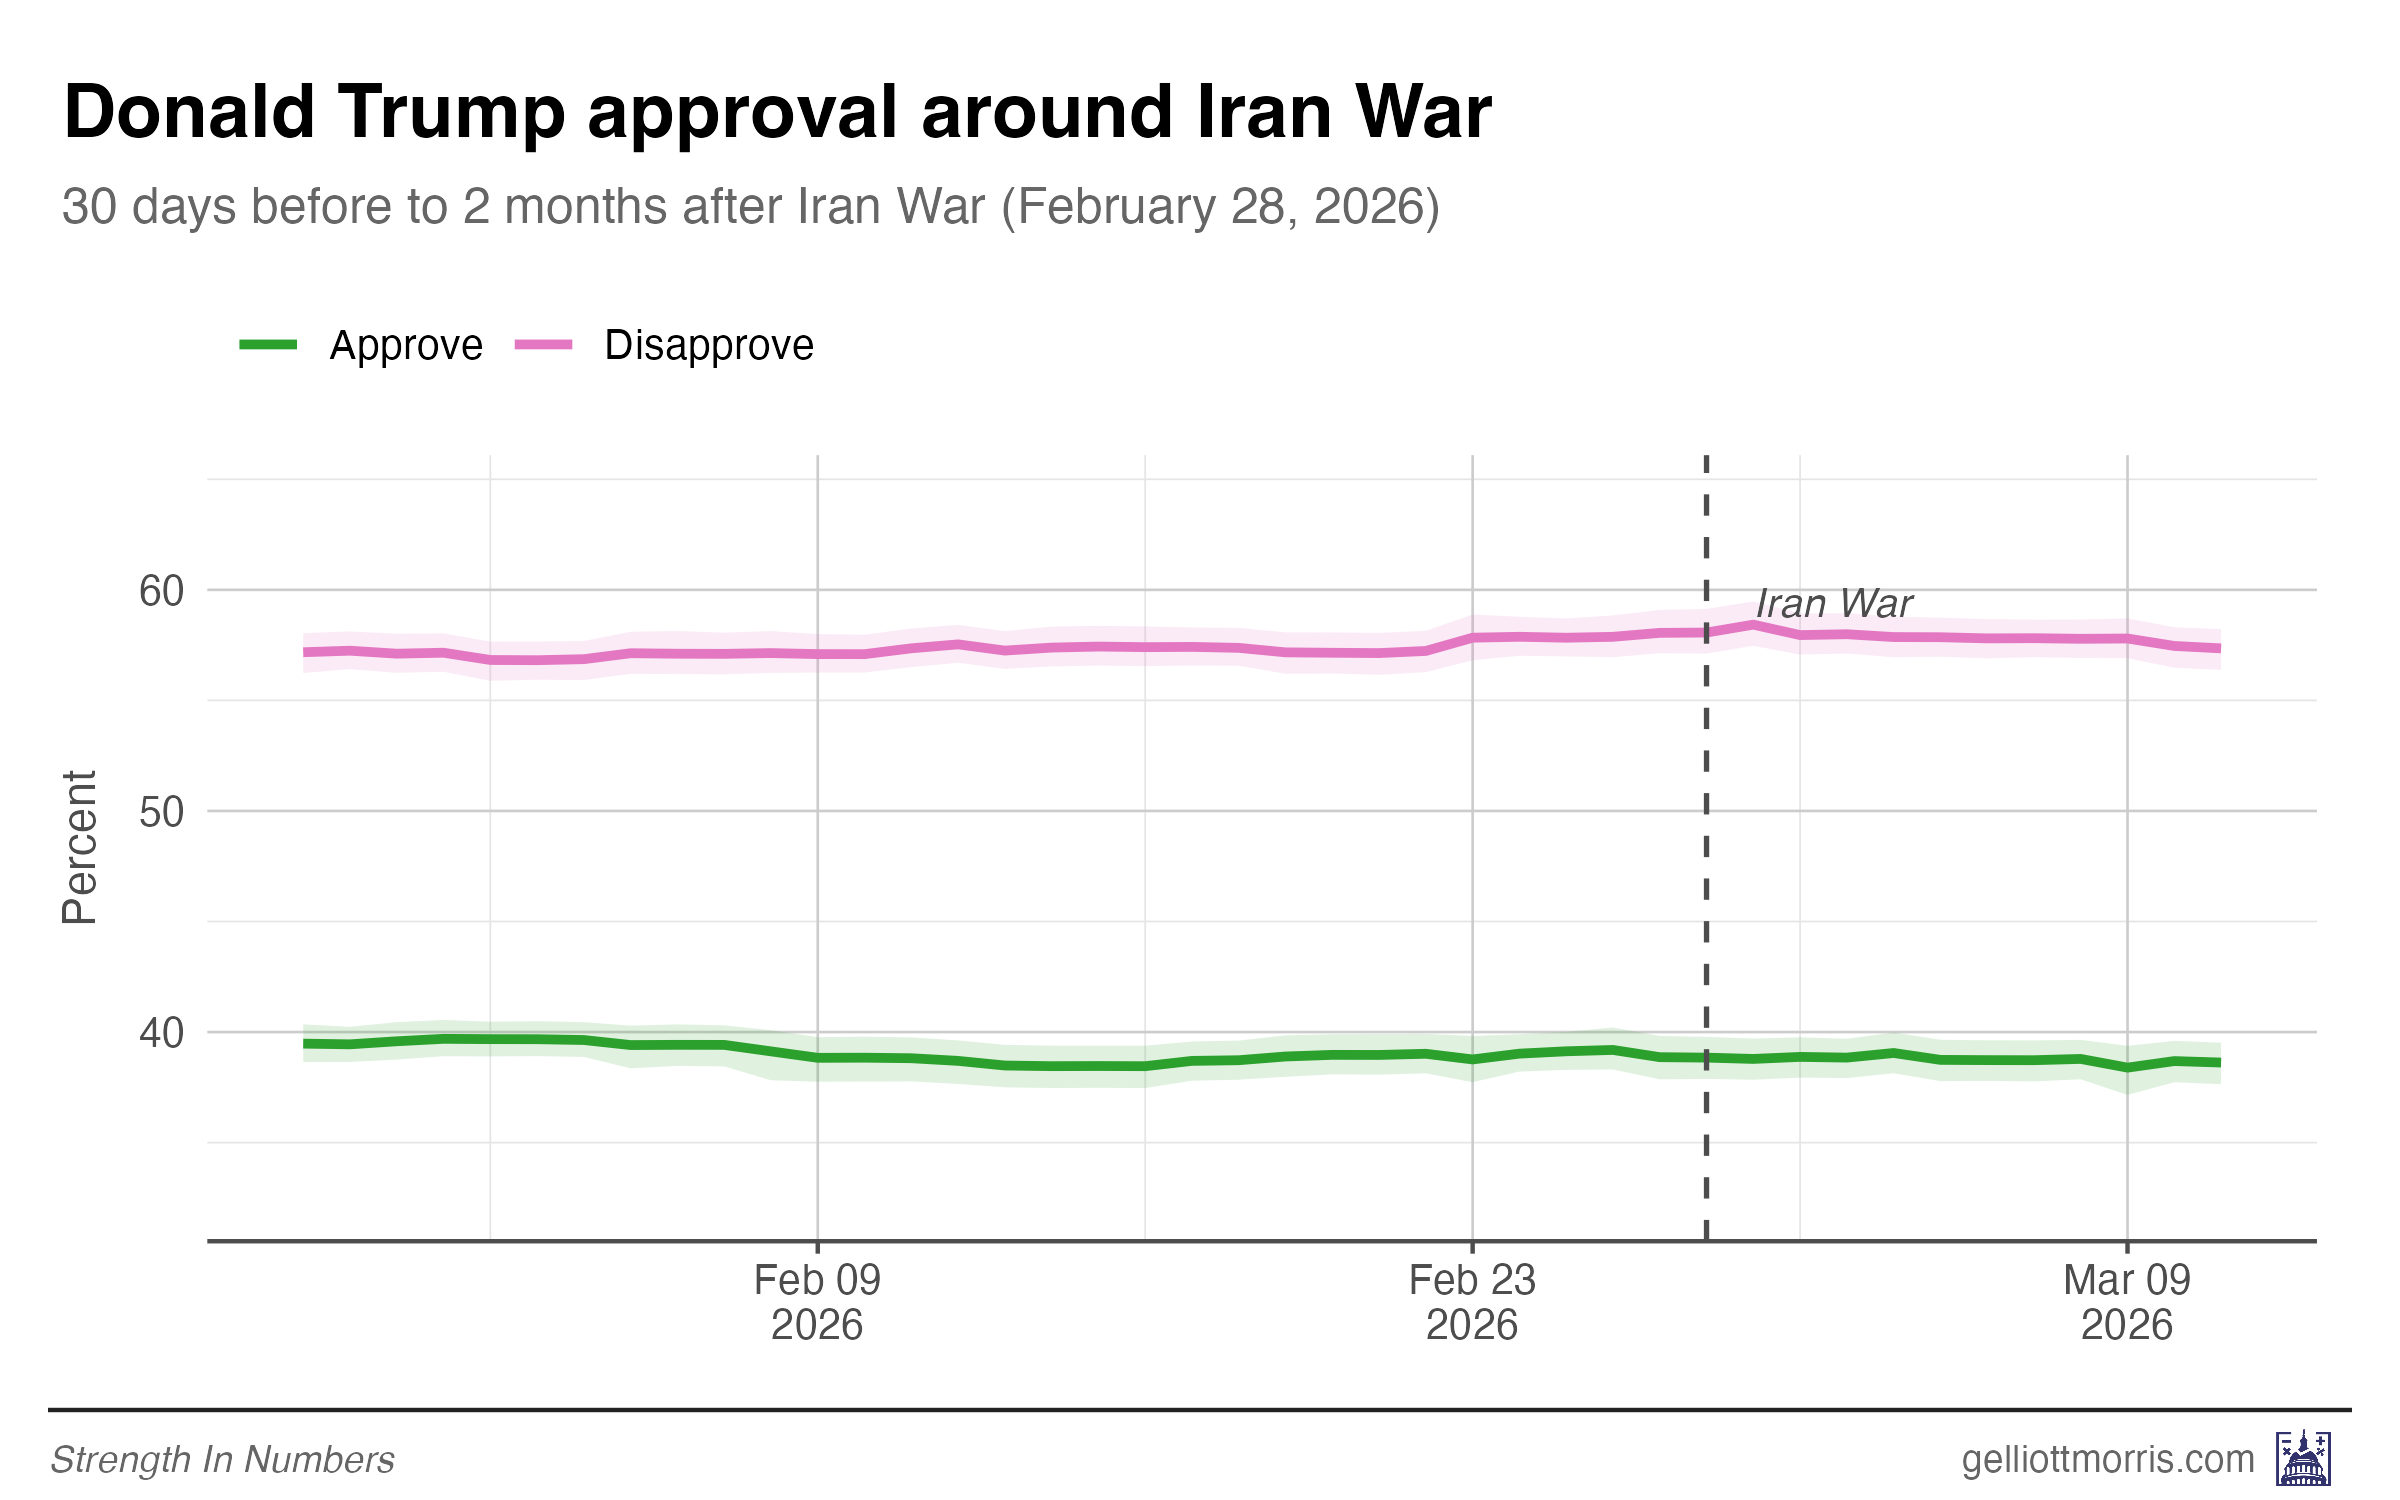
The chart above does not show a rally around the flag effect; it shows two flat lines. Trump’s approval rating ranged from 38% to 39%, and his disapproval was between 57% and 58%. In other aggregators, he has even slightly lost support.
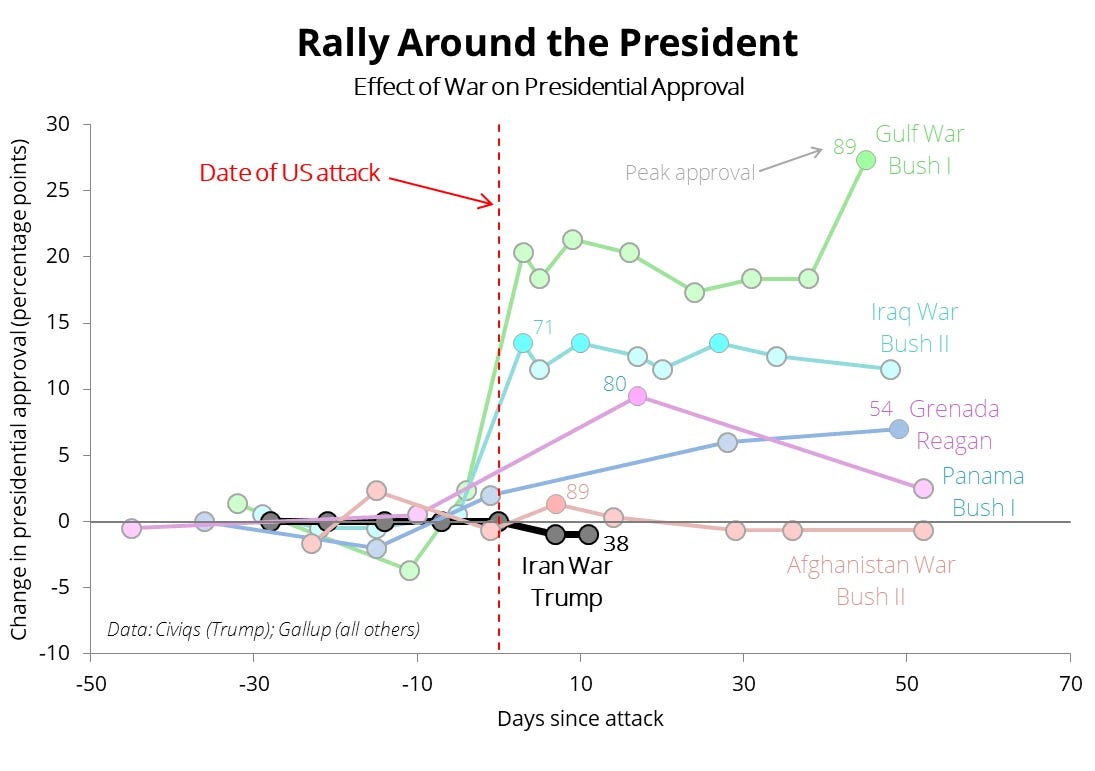
The chart below shows the full historical picture. I chart the change in net presidential approval after the start of every major U.S. military conflict since 1941.
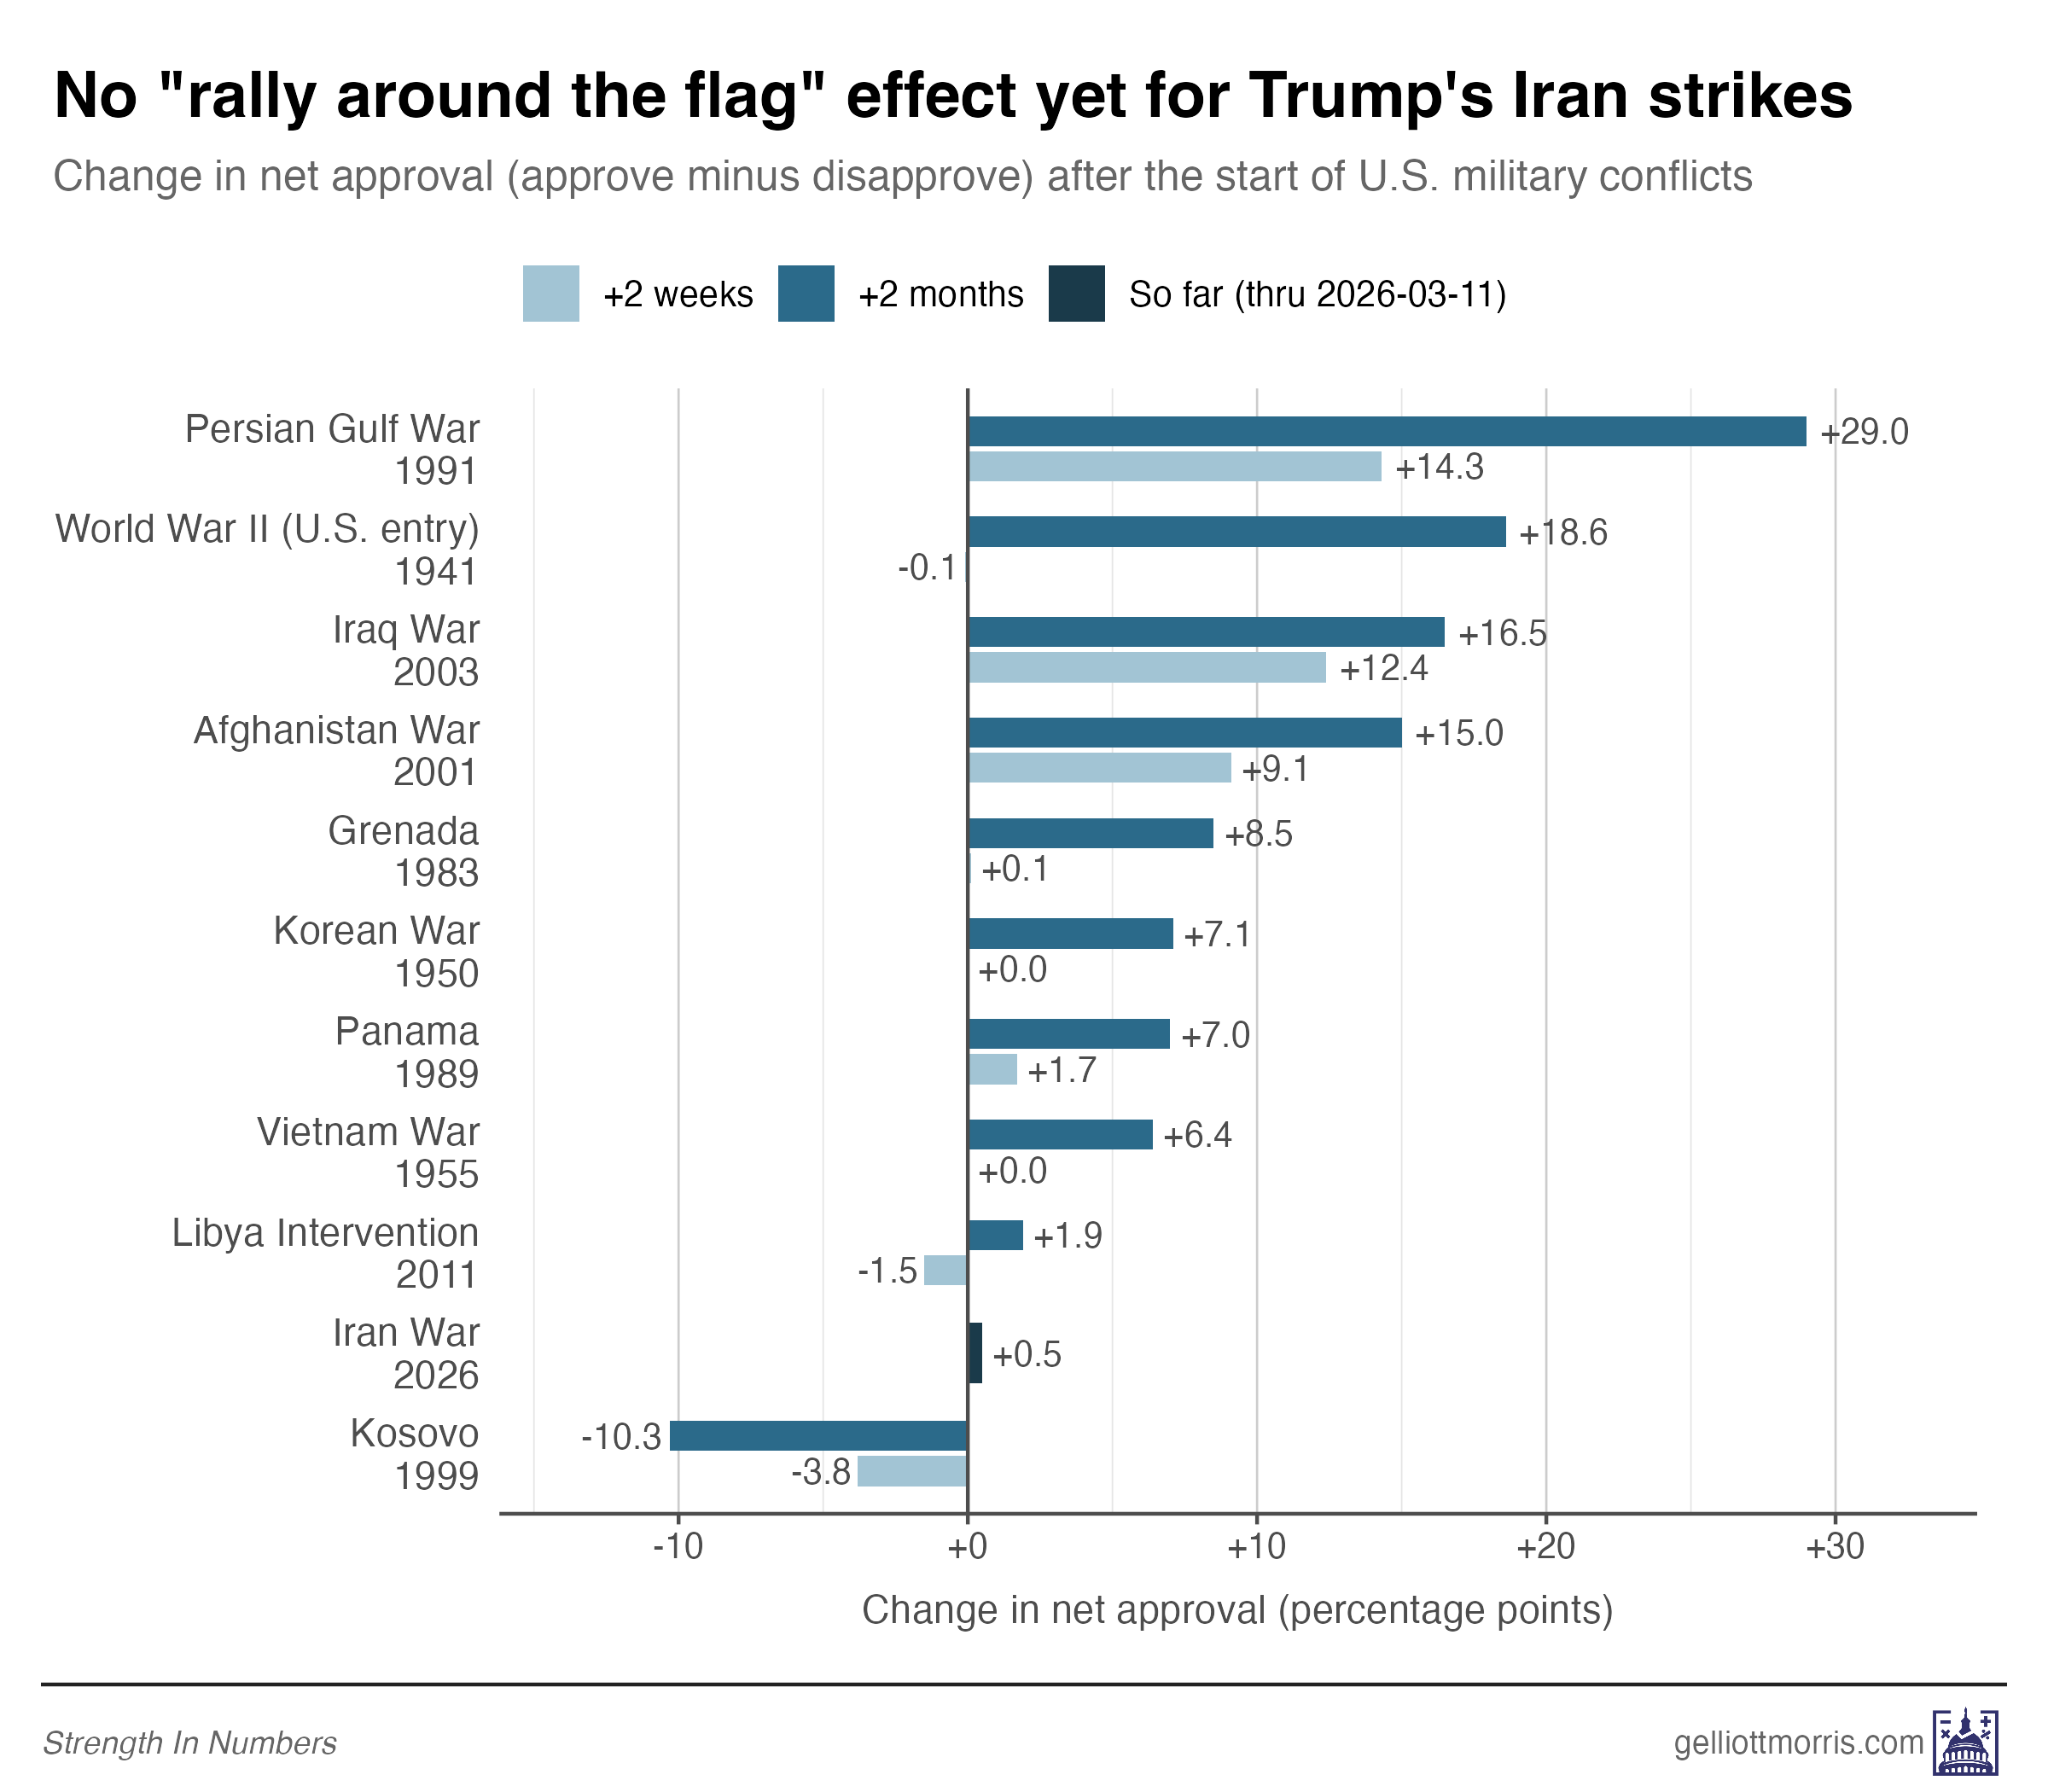
These events can be sorted into roughly three buckets. The Gulf War sits at the top, with a net gain of +29 points, followed by World War II (+19) and Iraq (+17). Afghanistan (+15) follows, but as discussed, that number is “polluted” by the post-9/11 surge in Bush’s rating that was already underway.
Below those big three, the picture gets murkier. Grenada (+9), Korea (+7), Panama (+7), and Vietnam (+6) all produced bounces, but each came with an asterisk and was short-lived. These bounces were confounded by recessions, noisy data, sky-high baselines, or gradual escalation — and were not treated the same by the government or press (this is important for the conditions section, we’ll get to it.)
And finally, there are the clear non-rallies: Trump’s Iran bump is less than 1 point; Libya was -2 after two weeks (-6 after a month); and Kosovo was -10 at the two-month mark.
The conventional wisdom is that when presidents go to war, their approval goes up. But the historical record is a lot messier than that. Sometimes, as for Trump so far, opinion doesn’t move at all.
What political science says about rallies
So why didn’t Trump get a rally? I’ve read the political science literature on rally effects and identified five conditions that need to line up for a meaningful bounce in presidential approval. Trump’s Iran strikes fail on nearly all of them.
Condition 1: A dramatic, sudden shock
The “rally-round-the-flag” effect was first described by political scientist John Mueller in 1970. He found that presidential approval tended to surge after dramatic international events — military interventions, major diplomatic crises, sudden confrontations with foreign adversaries. Mueller’s original insight was that rallies require a focused event that jolts public attention. Pearl Harbor, 9/11, the seizure of American hostages in Iran in 1979 — these were sudden shocks that focused the nation’s attention on the president and his unique role as commander-in-chief.
Condition 2: Bipartisan elite consensus
Richard Brody argued in his 1991 book Assessing the President that rallies persist only as long as opposition elites refrain from criticizing the president. When opposition leaders rally to the president or run for cover, the public receives an implied message that the president is doing his job well. The moment partisan criticism becomes prominent in media coverage, the rally fades — or never materializes at all.
Hetherington and Nelson showed in 2003 how this worked after 9/11: Congressional Democrats rallied behind Bush almost immediately, and his approval surged from 51% to 90%. But by late 2002, persistent Democratic criticism on domestic issues was already peeling away Democratic and independent supporters.
Condition 3: Unified media coverage
Baker and Oneal found in 2001 that when a president’s “crisis response” was reported on the front page of the New York Times, the rally effect was more than 8 percentage points larger than when it wasn’t. Dominant, unified media coverage, they find, focuses the attention of low-information voters on the president. Without that spotlight, the rally doesn’t reach the people who would produce it.
Condition 4: Perceived legitimacy
It is also important for presidents’ actions to be approved by other state actors, such as Congress or the United Nations. Chapman and Reiter found in 2004 that UN Security Council support for a proposed use of force increased the rally effect by as much as 9 points, even after controlling for other factors. Support from the international community serves as a cue to the public that a president’s actions are justified, not just partisan or self-serving.
Condition 5: A public willing to rally
Finally, Matthew Baum disaggregated the rally effect in 2002 and found something crucial: rallies are driven primarily by independents and opposition-party identifiers shifting their support to the president. That’s because the president’s own partisans are already supportive and have little room to move. It’s the less-attentive independents and soft partisans who produce the bump.
No bump for Trump
Trump’s Iran strikes didn’t produce a bump because they didn’t meet these conditions.
No sudden shock. The U.S. initiated the action — this wasn’t a response to an attack on American soil. Trump had been escalating his rhetoric for weeks. And it’s an air campaign, not a ground invasion.
No bipartisan consensus. Democrats called it a “war of choice” on day one. There’s been no closing of ranks, no “we have only one president” dynamic.
Fragmented media coverage. This one is more debatable. There’s been plenty of coverage of the war, but it’s been split between the strikes themselves, civilian casualties, Congressional opposition, and protests. The 2026 media environment doesn’t produce the kind of wall-to-wall, rally-generating coverage of a bygone era in U.S. politics. There’s no single dominant headline.
No perceived legitimacy. Trump didn’t seek UN or Congressional authorization for his strikes. (A March 9 Quinnipiac poll found 59% of Americans said he should have.)
No public willing to rally. Trump entered the conflict at a net -19 approval rating, 14 points more unpopular than any other president at the start of a military conflict. And the electorate is locked in by party; Averaging across polls, Democratic disapproval of the strikes is between 85 and 90% in most polls, while about 60% of political independents say they oppose and 75-85% of Republicans approve. There are simply very few votes for Trump to gain.
Another forever (unpopular) war?
The rally-round-the-flag effect is supposed to be one of the most reliable patterns in American politics. But the historical record shows it’s more fragile than the conventional understanding I see in the media. Genuinely large rallies are rare, and many of the smaller ones are confounded or ambiguous.
Looking at the past conditions under which large rallies happen, Trump’s war with Iran is set up to be unpopular. He launched an air campaign that a majority opposed from day one, without Congressional or UN authorization, with the most polarized electorate in modern polling history. And the military made key strategic errors (bombing an elementary school, for example) that sucked up space in headlines.
Trump went looking for a rally-around-the-flag moment to shore up his approval rating, and instead found a public that was hostile to foreign action and had already made up its mind about him.
Related Articles


If you want more reporting like this — grounded in polling, historical data, and political science instead of cable-news mythology — become a paying member of Strength In Numbers to receive exclusive content — including the weekly Tuesday Deep Dive, access to the Strength In Numbers/Verasight monthly poll, and more.
And if a paid subscription isn’t in the cards for you, or you just found this useful, send it to a friend or post it somewhere people are still pretending war always helps presidents.
terrific post: excellent evidence, well-articulated interpretation
This makes the decision by Gallup to stop asking presidential job approval all the more painful