


This post is part of The Data Lab, a new section of Strength In Numbers for extra charts, general polling wonkery, and methods work that doesn’t fit into the normal editorial vertical. If you’re the type of person who wants to know how our polling is done or reads election forecasting methodologies, the Data Lab is for you.
Emails for posts on the Data Lab vertical are off by default, but you can easily toggle them on here. If you have a post to contribute to the Data Lab, email me.
Most Data Lab posts are free, but the occasional deeper ones are for paying subscribers, whose support makes all of this possible.
The feedback to my Thursday piece re-analyzing Wisconsin polling microdata has been overwhelming and positive. I have received more emails and texts about this survey than anything I’ve written in a while. I consider this a huge win, not only because I am a millennial/Gen-Z and crave your validation, but because it shows the utility of explaining the ins and outs of polling in public.
I did want to issue a short follow-up post about this. What about the vampires? This post is going in the Data Lab, because it’s for the real sickos out there.
I re-analyzed the raw data from Wisconsin's primary polls. Here's what actually went wrong.

This is a follow-up post to yesterday’s article about the polls in Wisconsin. In that piece, I argue that polling primaries is a big challenge, and distinct from polling general elections – and people need to lower their expectations of accuracy in the primaries to come.
Do not invite the vampires into your poll
The Wisconsin voter file is notorious for having a lot of missing and incorrect data. One of the variables that is particularly errant is the age variable. In their methodology report, for some added context, State Navigate wrote:
“many voters in Wisconsin have a birth year of 1800, and we don’t believe in vampires. These generally are newer voters who skew very young; about half of voters who we polled with a birth year of 1800 say they are in the 18-29 age bracket. Thus, if you were to simply take the voter file’s birth year data, you’ll get a Democratic primary electorate that is majority 65+ and has less than 2% of voters under the age of 30. Absentee requests for the Wisconsin primary (which includes requests for Republican ballots) are 5-6% 18-34. Given that this age group has been notorious for voting late/on Election Day, we find it hard to imagine a Wisconsin Democratic primary electorate that is <8% 18-29. Maybe it is; we don’t know for sure due to the ridiculousness that is the Wisconsin voter file”
Well, I am more than a little wary of using polling data that had too many responses from young people to make any sort of predictions about what age numbers would be on the voter file, so it is another opportunity for sensitivity analysis.
In the plot below, I re-raked the August survey with the under-30 target set by increasingly aggressive assumptions about how old the “vampires” are — from my baseline a priori estimate (unknown ages allocated in proportion to the known ages) up through State Navigate’s estimate (half of unknowns under 30) and past it (70%) — under both the L2C weights and the ideology-free L2B weights.
Notably, stepping up the share of voters who were <30 increases error linearly. Under the L2C weights (which account for ideology and income), the margin goes from Hong +2.4 at my baseline, to Hong +4.9 using State Navigate’s stated floor of an 8%-under-30 electorate, to Hong +6.6 if you assume half of unknowns are under-30, and Hong +8.4 at 70%.
Under the L2B weights (which don’t have ideology in the targets), the same exercise runs from Hong +13.8 up to Hong +19.7, nearly all the way back to the unweighted poll’s +23.8. The reason is simple: the young people who actually answered this survey were overwhelmingly Hong voters (likely too pro-Hong, as the non-response analysis suggests), so every additional young voter you add to the electorate model pushes the poll further from the result.
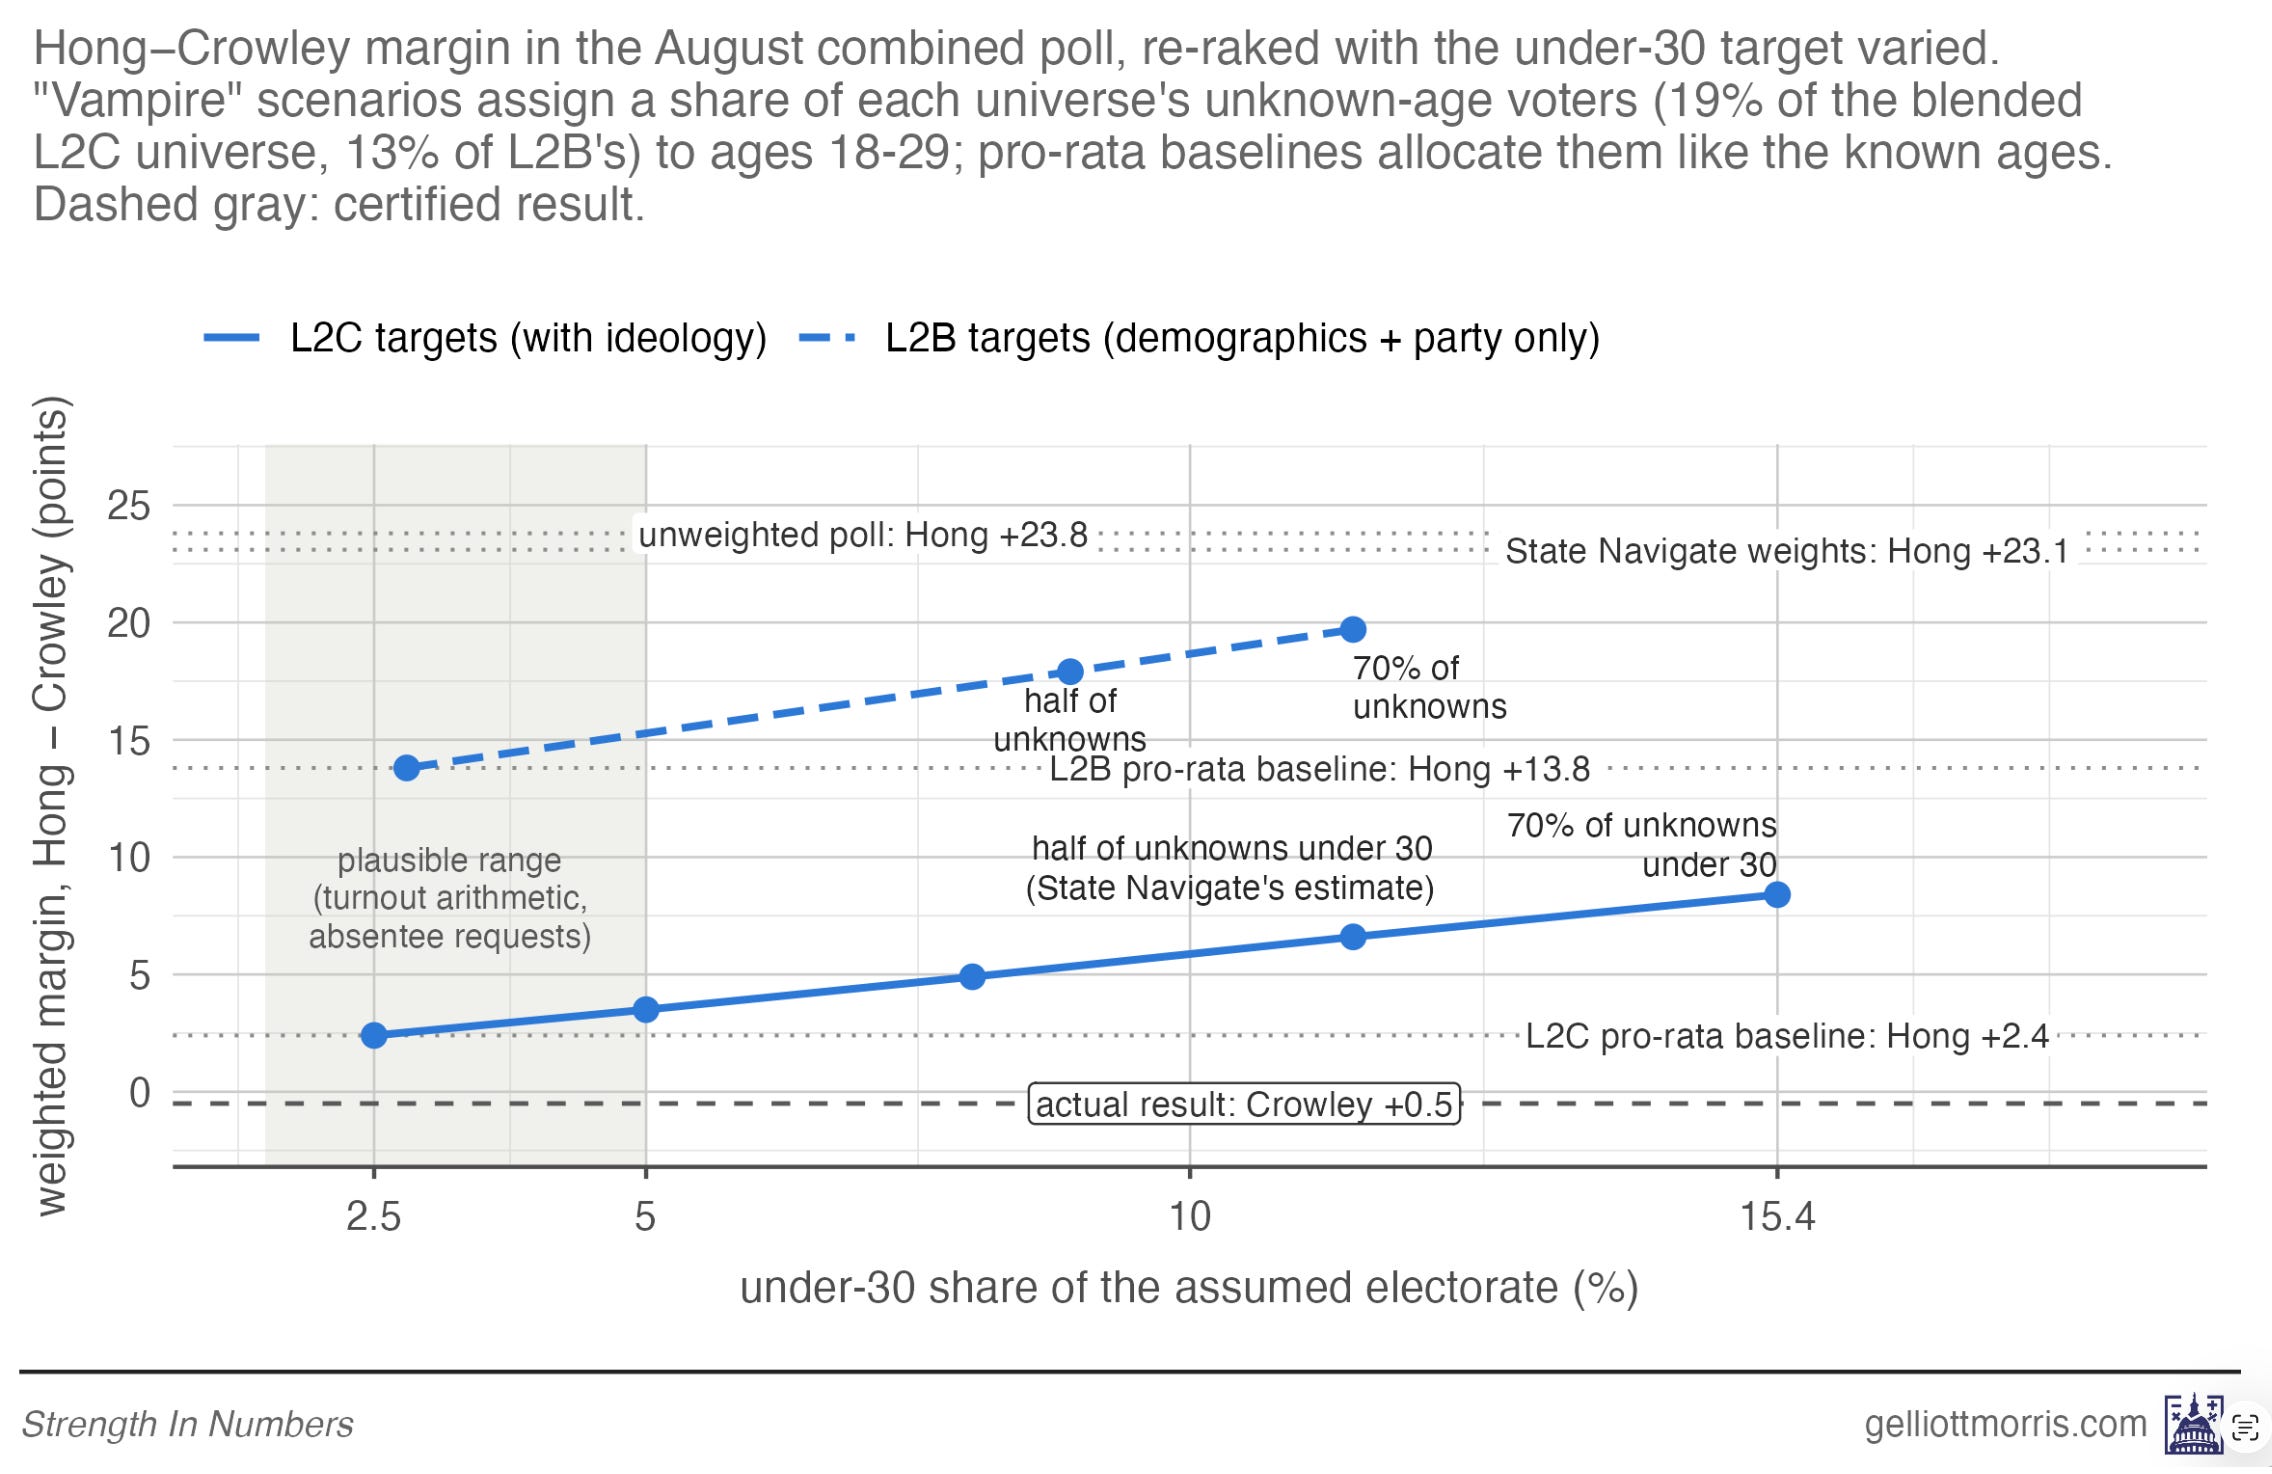
The adjusted weighted estimates I present — even at a 7-10% under-30 percentage — are still much closer to the result than the original weighted or unweighted numbers. Whatever the true age of Wisconsin’s vampires, the topline takeaways from my original analysis stand: The polls had too many progressives in them, which you can mostly but not entirely solve with weighting — especially if you don’t know the breakdown of the electorate by age! — and a large amount of late movement toward Crowley.
Somebody get the garlic
But about the non-response problem: With the adjusted numbers and new age breaks, the weighted estimates do land farther away from the targets. Does that mean we should conclude there was more non-response among moderates after all?
Well, not entirely. Again, the big problem here is that the Wisconsin voter file can’t produce a good benchmark for age (or other) variables, so pollsters are left flying blind as to what to weight their data to. (The right move here, in my opinion, is to simulate what your poll would show under a bunch of different weights to varying targets, but I will save this for another post.)
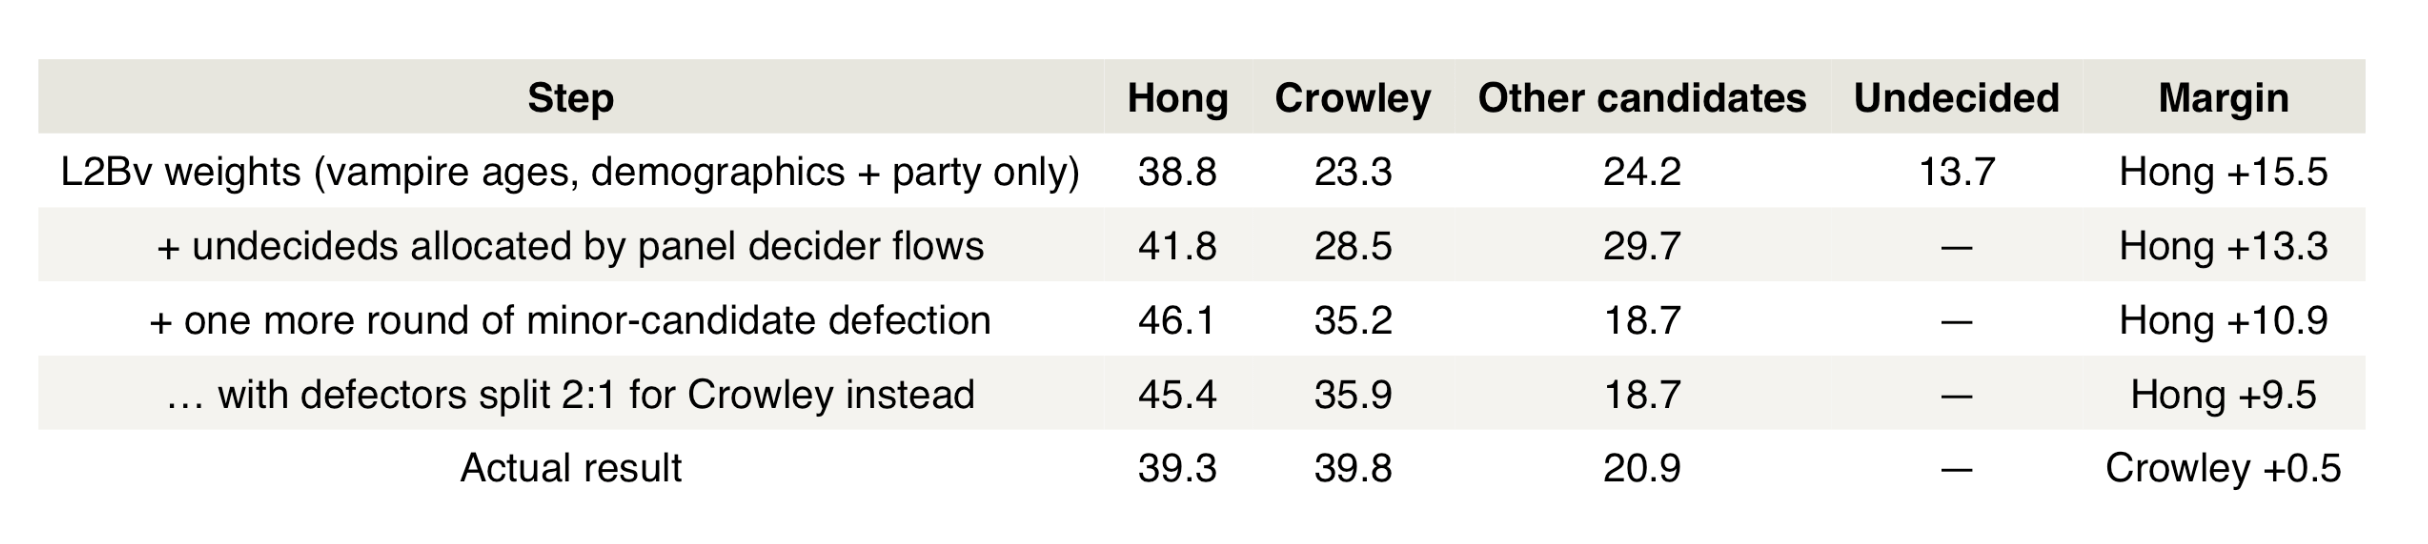
To set the stage, here is what the results of the State Navigate poll in August would have been if you allocated undecideds and some minor-candidate voters to Hong and Crowley based on their flows in the July-August recontact study State Navigate conducted. This uses my adjusted weighting model and the maybe-realistic-but-we-don’t-really-know assumption that 50% of people on the Wisconsin voter file with a birth date in the year 1800 are actually under 30 years old (what the polls that had too many young progressives in them indicated).
What is really interesting here is that the base scenario is almost perfect on Hong’s vote share, but underestimates Crowley. That’s likely because there was an additional large swing in his direction after the final August poll wrapped fielding, which polls simply cannot capture. The observed flow to Crowley among supporters of the minor candidates in the recontact study was 1.5:1. I also calculated what the results of the poll would have been if you allocate those voters 2:1 to Crowley vs Hong:
Now, here is the same chart, but if you weight the sample additionally to a benchmark for ideological makeup of the Wisconsin primary electorate. (Remember, the State Navigate poll had a quarter of respondents identifying as Democratic Socialists, which we can be reasonably sure is too high.)
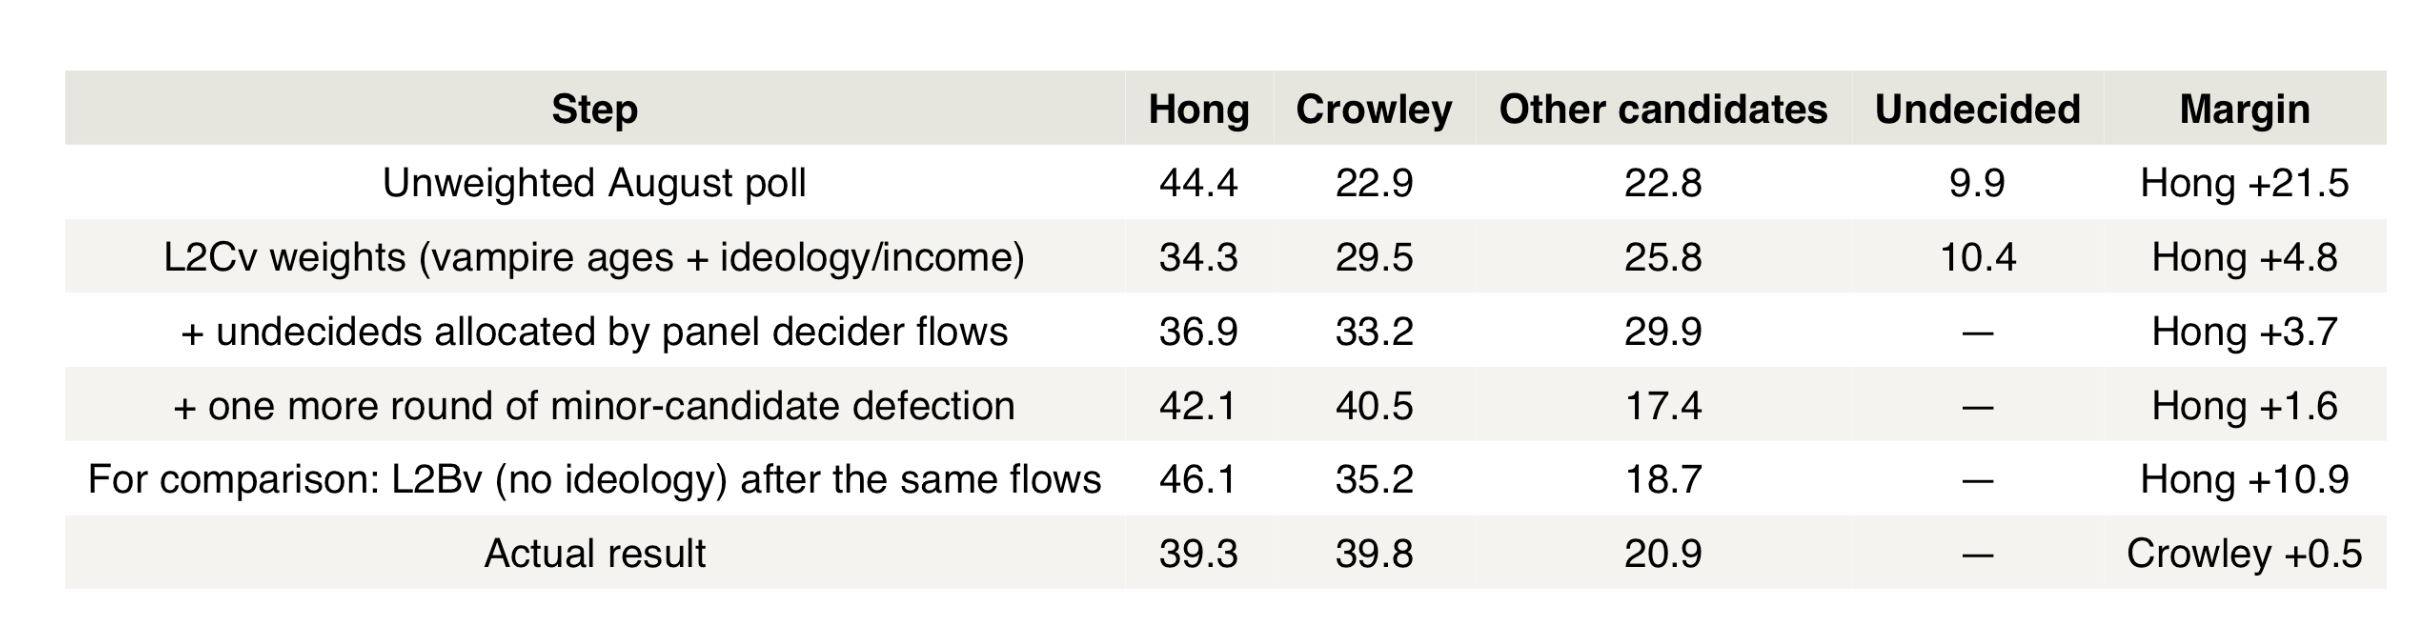
Weighting by ideology recovers about 8 points of vote margin for Crowley.
This means moderates aren’t responding as much to our surveys, right? Well, yes and no. We don’t know if “progressive” is the psychological quality that’s acting on voters to not make them vote. It’s likely something related to one’s ideology: like political engagement. I don’t have the year-vintage breakdown of vote history participation for Wisconsin voters in, say, 2018 (the last time there was a competitive primary in Wisconsin), so I can’t do that math, but maybe someone else could.
But we can use the updated “vampire-adjusted” weights and a reasonable guess at the vote flows in the last week (2:1 to Crowley) and plug into our non-response program (the MUBP — see the original post for an explanation).
The best guess from the authors of the paper I’m basing all this math on is that a reasonable starting point for the impact of non-response is setting phi = 0.5. And you can see why: in the L2Cv weights (which account for ideology), pushing that non-response adjustment up to 100% would have yielded a poll with 20% Hong and 60% Crowley! That’s very bad in the opposite direction of most published polls in Wisconsin.
And to be clear, since the L2Cv weights (solid line) already balance the sample by ideology, the non-response here is something about voting for Hong and Crowley that isn’t proxied by ideological identity in a survey. So you can’t use those trends to say anything about non-response among progressives. That is already taken into account by the level-shift in Hong and Crowley vote at phi = 0.
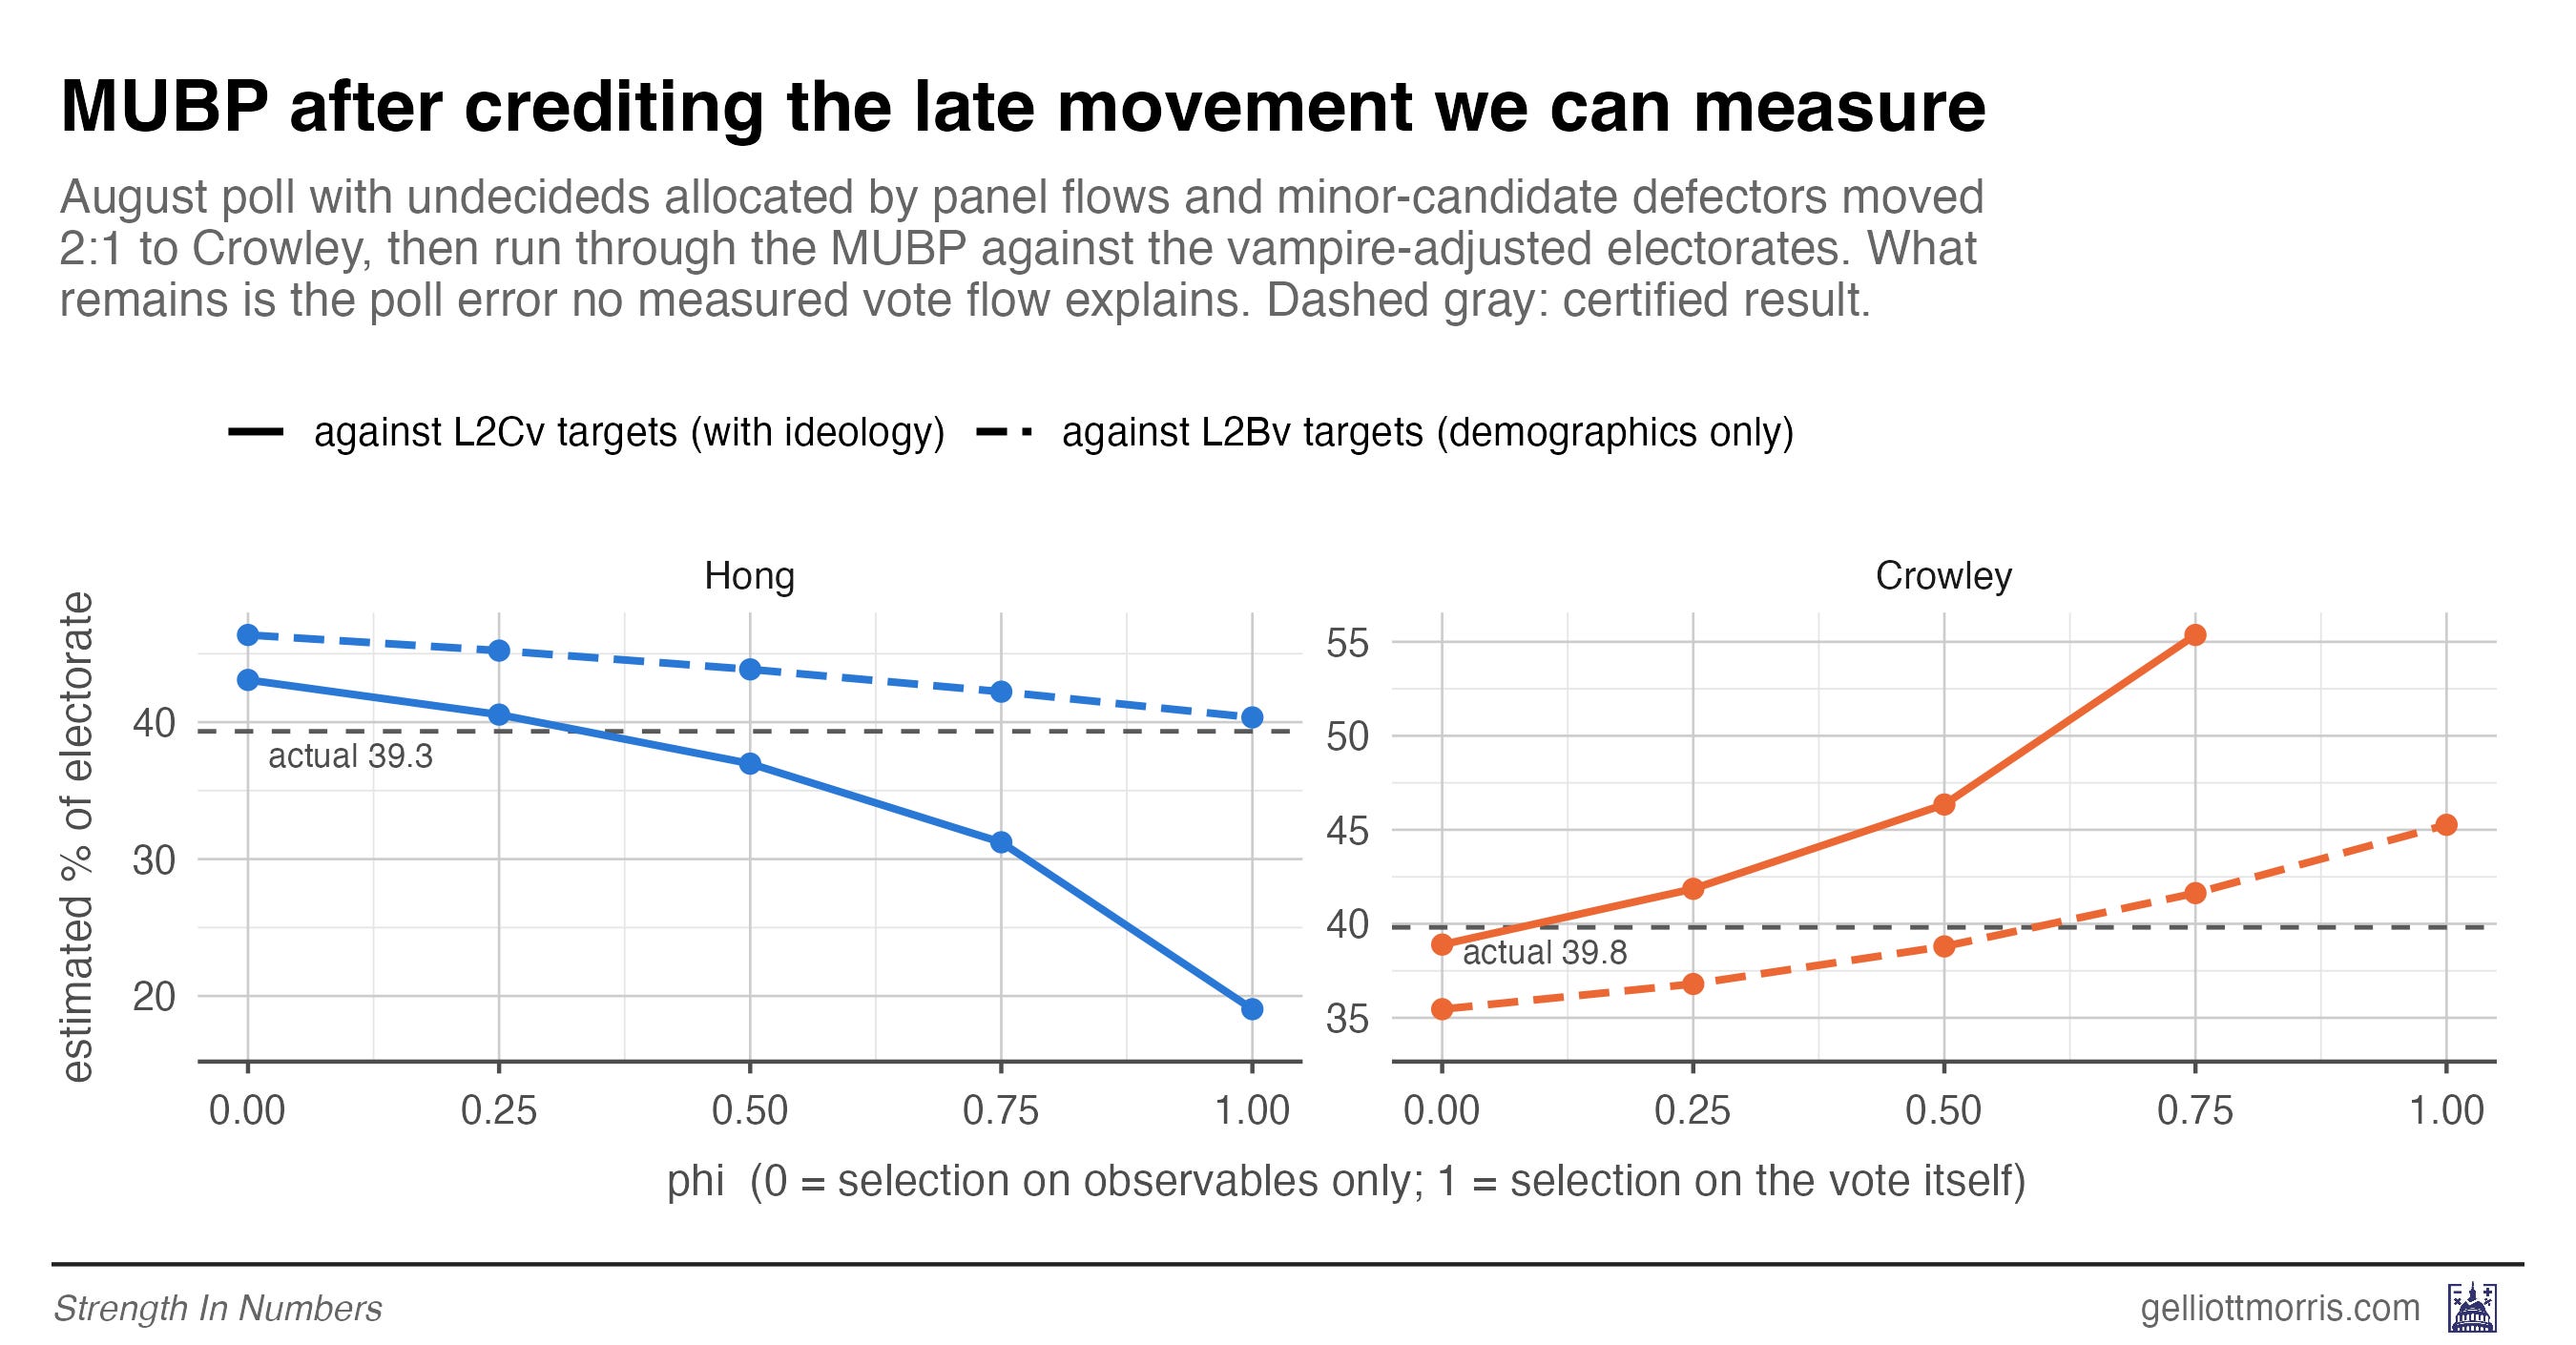
If, however, you use the L2Bv weights with the non-response dial at the 50% position, you get somewhere around 42% Hong and 40% Crowley. Given they each won about 40% of the vote, that’s a pretty good guess. The residuals here point to about a 5-6 point boost for Hong from non-response.
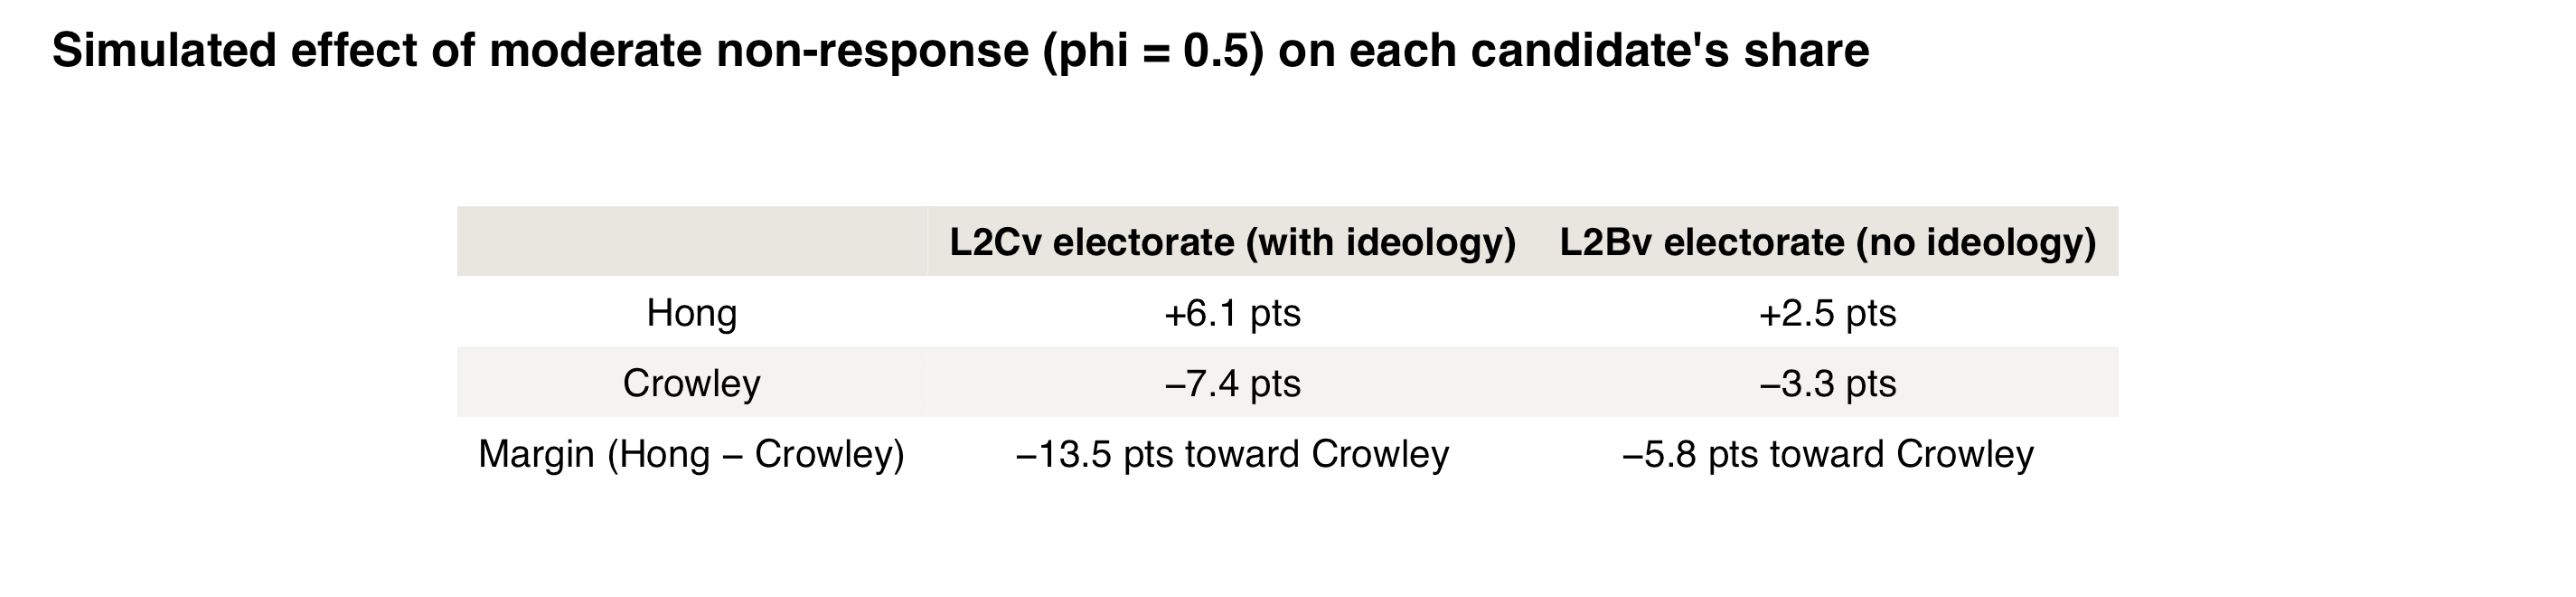
But again, caution is warranted, since the data for this survey all came from a week before the election. If we had data on election day, the impact of a “non-response” adjustment would be lower. (Technically, I guess, the poll not accounting for future movement in the race is “non-sampling” error, in that it’s error that comes from something other than sampling, but that is different from non-response.)
Polling primaries is very hard
In summary, after adjusting my original analysis for the existence of vampires in Wisconsin, the miss in the original State Navigate polls (+20 points of rHong) breaks down roughly as a result of…
10 points from misspecified age weights
At least 5 points of late movement (5 is what we can detect with the recontact
About 5 points of non-response
Adjusting for the misspecified age composition gets you within the 13 percentage point average error for the margin between two candidates in primary polls. That would indicate the primary polls and Wisconsin were not any worse than average, after adjusting for what looks like maybe a simple mistake or extra extrapolation from Michigan on the part of State Navigate.
But you can eliminate most of the error in 1 and 3 by weighting your primary poll to a reasonable benchmark for ideological composition. We don’t know what the precise ideological composition of any group of voters is, so see Recommendation 3 in my original analysis. Time for some sensitivity analysis, baby!!
If I were to editorialize a bit, I would say 5 points of ideological non-response in a primary poll is really not bad, all things considered. Especially if it doesn’t impact general election polls or what we know about public opinion writ large.
🧄🧄🧄🧄
I think there is merit in coming at this from the other direction, looking at actual results from adjacent counties with similar populations, media markets .... and seeing what how much difference is left after using the same variables used in poll adjustments. Look at adjacent counties in northwestern Wisconsin. Washburn County (Crowley: 39.7% to 31.6% with 1,669 total votes) and Sawyer County (Hong: 37.3% to 35.7% with 1,845 votes). These vote totals are similar in size to good poll sizes.
If the factors used in adjusting polls can't close this 9.7% swing, then there is a residual uncertainty that no additional polling/analysis will close and we will have a better estimate of the underlying uncertainty in the polls. This is the methodology used as an aspect of election night forecasting (once I know County x then I can refine my estimate for County y).
I do think that Elliott's various analyses do show that Hong's numbers were about right and that the consolidation around Crowley would have been very hard to capture given the slew rate of the change so near the election. What has been labelled as a bad miss really is not.