New poll: Democrats lead the 2026 House generic ballot, and their edge widens when voters are reminded Republicans control Congress
Plus: Voters see both parties as out of touch, but for different reasons; Trump hits new low on pocketbook issues; Large majorities oppose ending ACA subsidies and SNAP, support taxing high earners
This article reports results from the November Strength In Numbers/Verasight poll. You can read our previous poll releases here. Subscribers to Strength In Numbers can suggest questions for future polls here or leave them in the comments section below.
Headline poll findings:
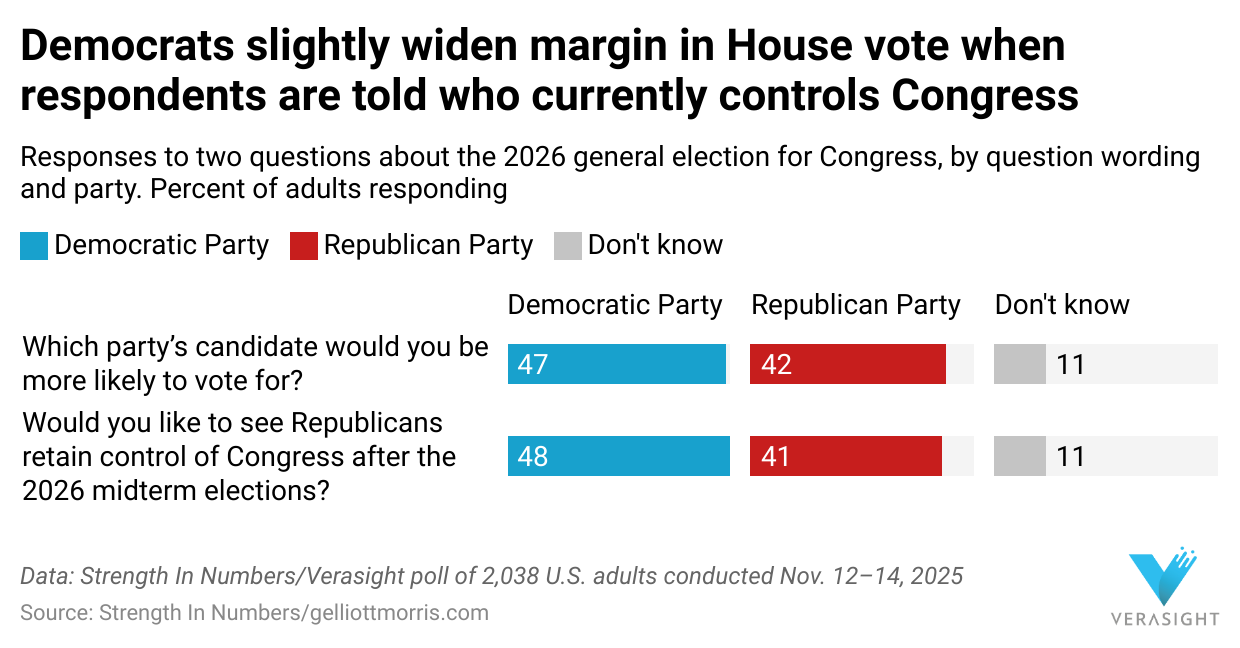
Our new November Strength in Numbers/Verasight poll finds Democrats leading the 2026 U.S. House generic ballot, 47% to 42% for Republicans. In a survey experiment, when respondents are told Republicans currently control the House and Senate, preference for Democrats rises to 48% vs 41% for Republicans — an expanded margin of D+7.
In our first poll conducted after the 2025 elections, and while the U.S. Congress was in the process of ending the government shutdown, President Donald Trump received a job approval rating of 41% approve to 57% disapprove (–16). The president is deeply negative on prices/inflation (–33) and health care (–26). A broad majority of 65% of voters said they do not think Trump has kept his promises on the economy, while 24% say he has.
Additionally, 58% of adults say they want government food assistance via SNAP to be fully funded during government shutdowns. Blame for the shutdown is split: 36% say Trump deserves the most blame, 35% say Democrats do, and 19% say Republicans in Congress bear the most blame. When we split our sample based on when respondents completed interviews, Trump’s job approval ticked up slightly after the shutdown deal was reached.
On the topic of health care, 59% of adults oppose the expiration of ACA marketplace subsidies this year. To continue to fund such programs, a broad majority of 63% of the public supports raising taxes on corporations and households making $400,000 per year.
Finally, voters are deeply dissatisfied with their choices of political leaders and parties. Majorities of American adults say each political party is out of touch with the needs of the average person. Fifty-four and 55 percent of voters say the Democrats and Republicans, respectively, are not in touch. Additionally, 61% of adults say they don’t feel represented by the two major parties. But what can the crosstabs tell us about why the Democratic and Republican brands are in such trouble?
Methodology note: Verasight conducted this poll among 2,038 U.S. adult residents from November 12-14, 2025. It has a margin of sampling error of 2.3%. The survey was weighted to match the political and demographic characteristics of the U.S. adult population according to the U.S. Census Current Population Survey, as well as recent benchmarks for partisanship and past vote from official election results and the Pew Research Center.
Verasight uses mail, SMS text, and the internet to recruit a sample using hybrid sampling (both probability-based and non-probability techniques). To ensure independence of the research and editorial processes, Verasight handled recruitment, interviewing, and weighting the survey. Strength In Numbers conducts all analysis and editorial processes. SIN had input on questions, but did not participate in other methodological decisions.
You can download a PDF of the poll results, question wording, and a full methodology statement at the bottom of this page.
Generic ballot
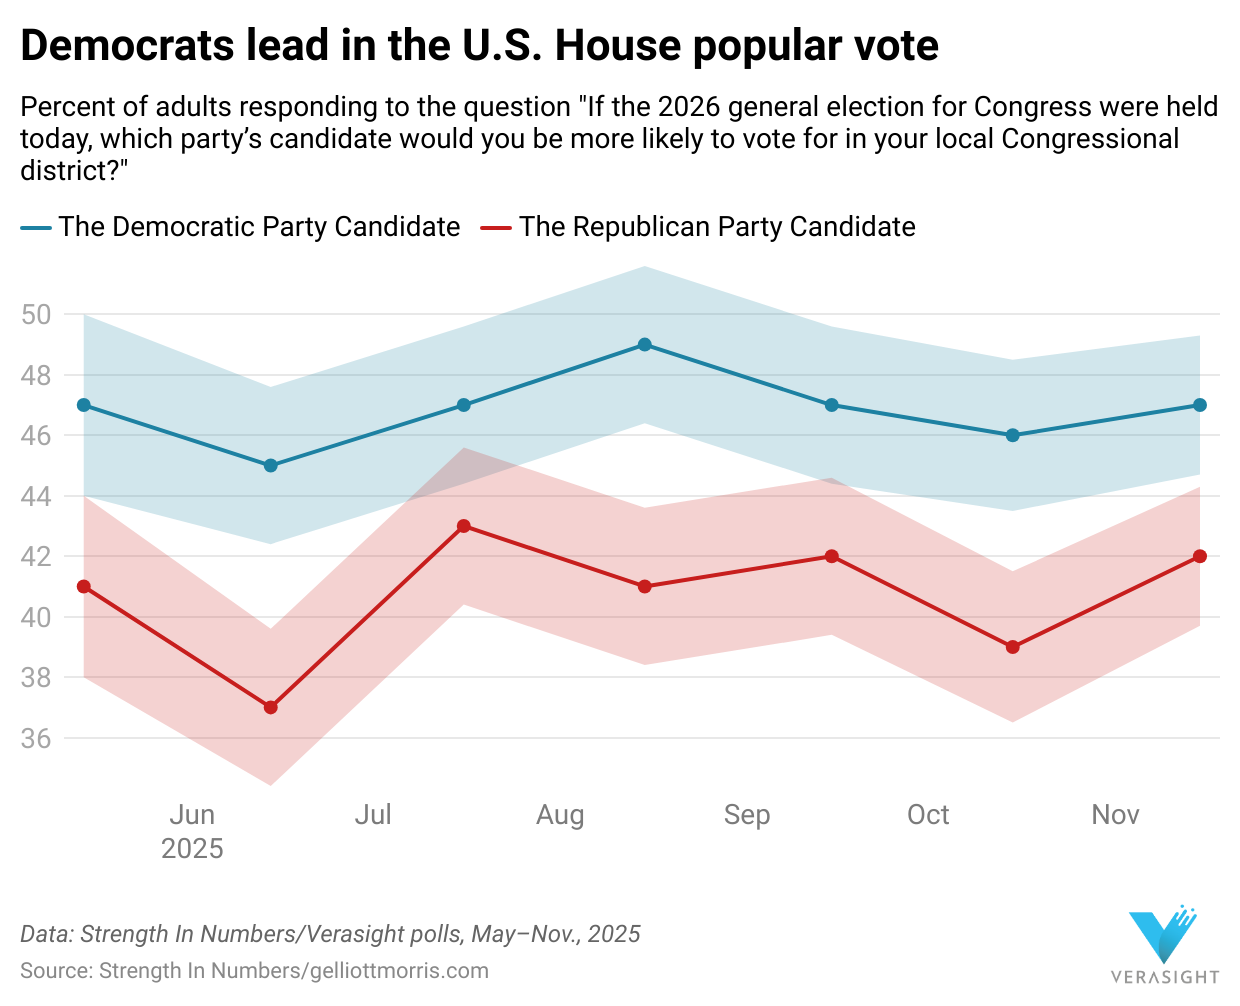
In our first survey after Democrats swept major elections this November, the party holds a 5 point lead, 47% to 42%, over the Republicans in the race for the U.S. House in next year’s midterms. The 5-point margin is similar to the party’s average 6-point margin in our surveys going back to May 2025:
This month, we split our sample in half and asked 1,019 U.S. adults a different version of the generic ballot question that specified who currently controls Congress. In this “informed ballot” question, Democrats slightly widen their lead in the race for the House vote next year by 2 points.
Similar to a recent experiment by YouGov Blue, detailed in this newsletter at The Downballot, we find that the effect is mostly driven by independents moving against the Republican Party. In our usual question, independents currently break 36% to 25% for the Democrats over Republicans (D+11), with 39% saying they are undecided for next year’s house elections. In the informed ballot, the Democratic vote share rises to 44%, Republican share rises to 28% (D+16), and undecided percent shrinks to 29%.
Among registered voters, Democrats have an identical 5-point lead on the usual generic ballot question, 49% to 44%.
Trump job and issue approval
In our November data, 41% of Americans approve of the way Donald Trump is handling his job as president, while 57% disapprove. The net rating of -16 is the lowest we have measured since our first poll in May, 2025. One important difference since that survey, however, is the rising percentage of Americans who say they “strongly disapprove” of Trump’s job as president — which has risen from 42% to 46% over the last six months.
Our last survey in October had Trump at -15 overall on net, 56% to 41%.
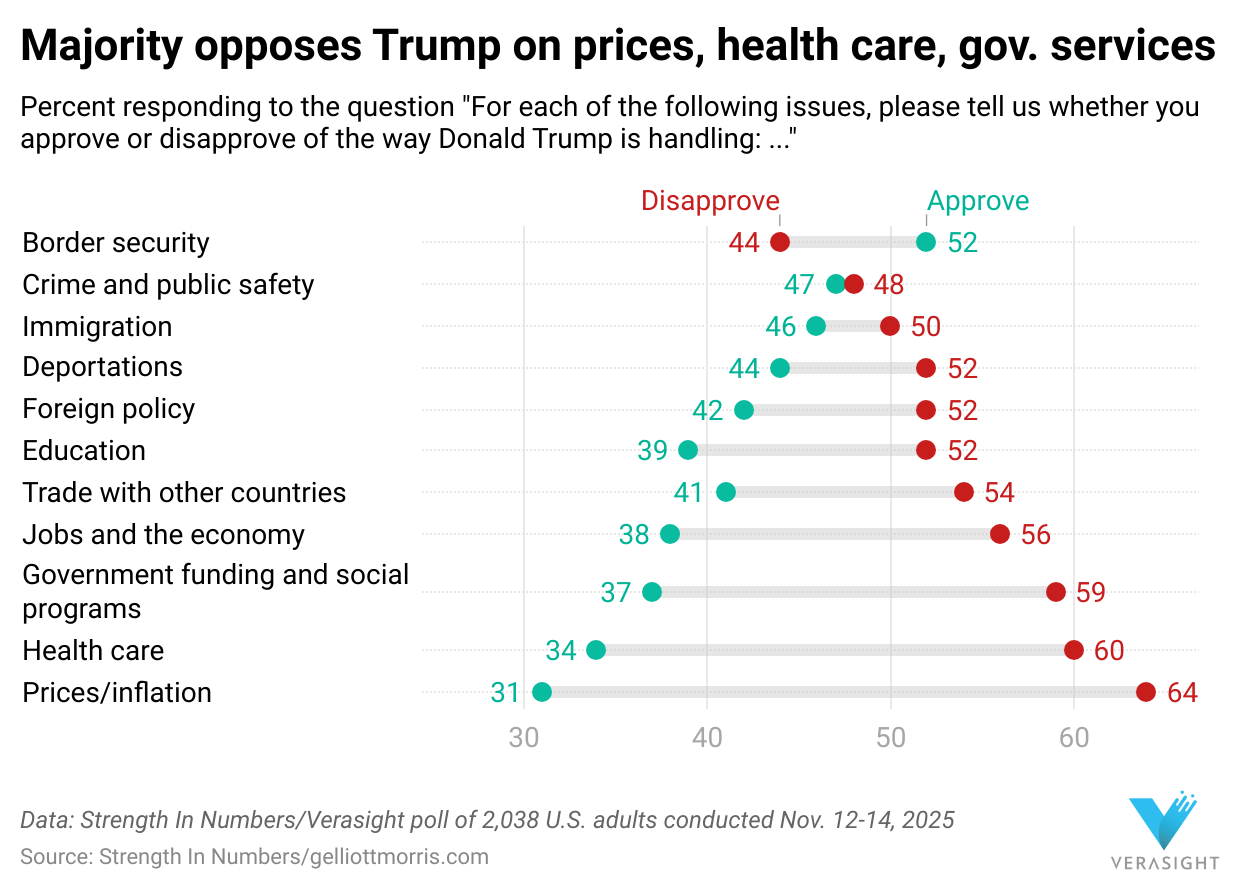
In our November poll, an all-time high of 64% of adults say they disapprove of the job Donald Trump is doing on prices and inflation — a key issue in this month’s elections that saw Democrats sweep statewide races in Virginia, New Jersey, Georgia, and Pennsylvania. A majority of Americans disapprove of how the president is handling every major issue we polled, with the exceptions of crime and border security — the latter of which is the only issue Trump has a net positive rating on.
The president’s previous low rating on prices was -32. In our new November poll, a majority of voters say they disapprove of how Trump is handling the issue.
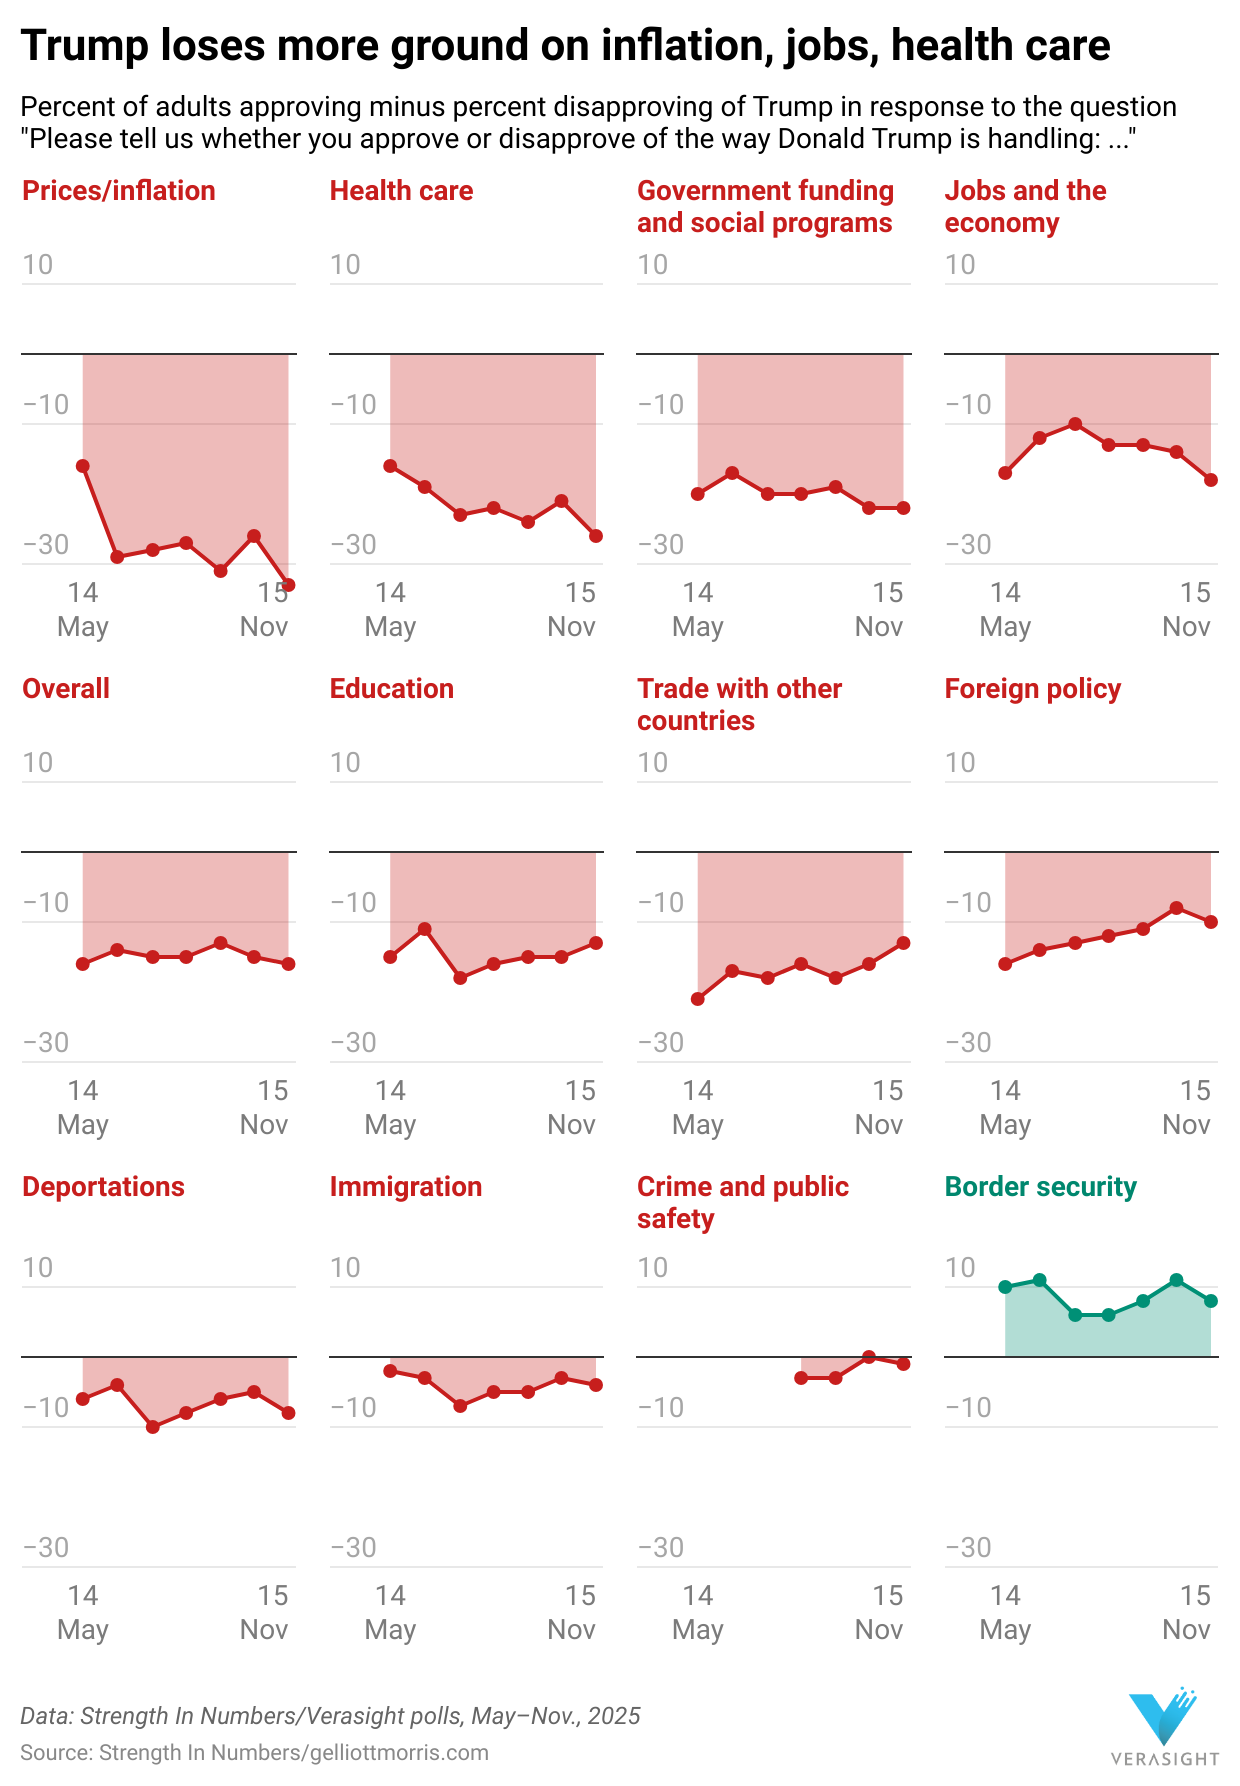
President Trump has also lost ground on most issues related to the economy and government spending. And he has flatlined on deportations and immigration, on which he scores a -8 and -4, respectively — issues previously trending in his direction:
The only bright spot for Trump is how the public feels about his handling of trade with other countries — likely due to his capitulation on most trade disputes with other countries, and the news of a pending potential clawing back of the president’s emergency powers by the Supreme Court. In our October poll, 55% of adults said they disapproved of the president’s tariffs.
Both party brands are underwater — but for different reasons
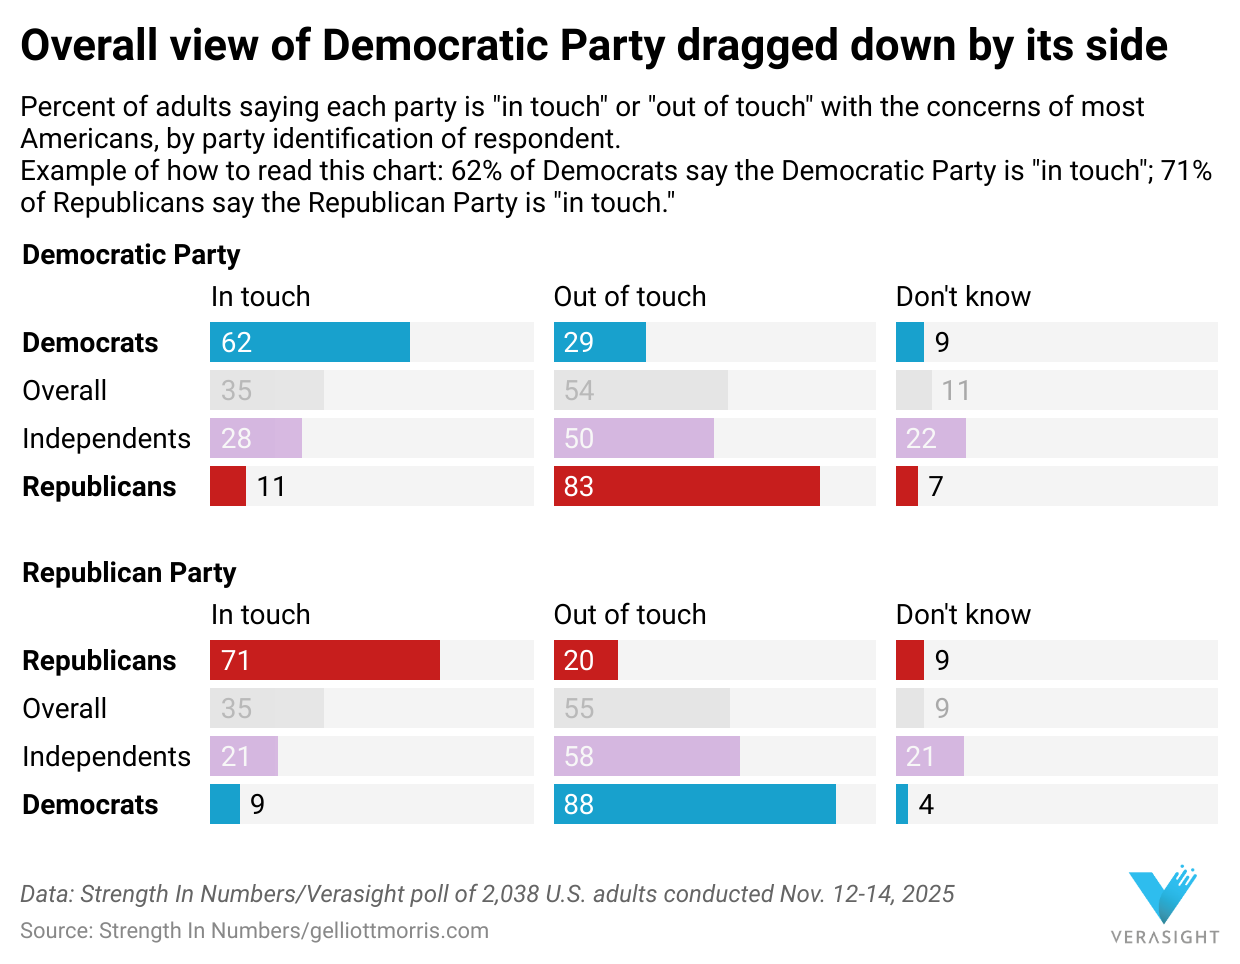
Recent polls have shown that majorities of voters say the Democratic and Republican parties are “out of touch with the concerns of most people in the United States today.” Our new Strength In Numbers/Verasight poll confirms this trend — but find different explanations for each party’s low rating. Fifty-four and fifty-five percent of voters, respectively, say the Democratic Party and Republican Party are out of touch with the average American. Thirty-five percent say each is “in touch.”
In looking at how different partisan groups respond to this question, it becomes clear why Democrats are so underwater. In a pattern we have pointed out before here at Strength In Numbers, aggregate ratings (how all voters feel) of the party are lower than expected because there is a higher percentage of defectors within the Democratic vs Republican Party. In our poll, 62% of Democrats say the Democratic Party is “in touch,” whereas 71% of Republicans say the Republican Party is “in touch.”
Republicans, in contrast, have a high “out of touch” percentage because a higher percentage of self-described independents say the party is out of touch. That number is 58% for independents, vs 50% of independents who say the Democratic Party is out of touch.
We see more evidence for this theory in the crosstabs. Americans who report that both parties are out of touch — the infamous “double haters” — are disproportionately Democrats and left-leaning. Among these double haters, 47% self-identify as Democrats or independents who lean toward the Democratic Party, vs 25% who say they are Republicans/lean Republican and 29% who say they are pure political independents. Additionally, 42% say they are at least somewhat liberal, which compares to 33% among the whole population.
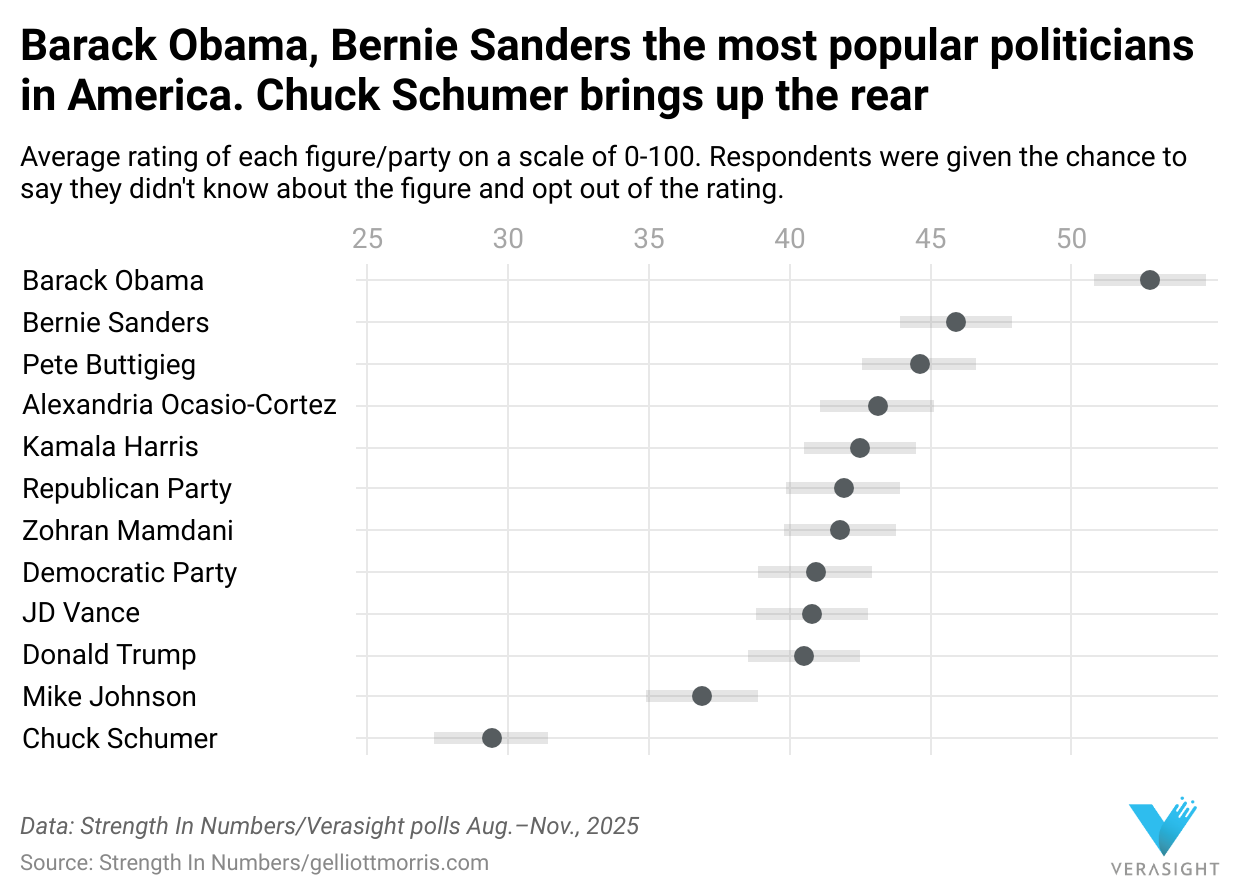
These figures indicate that the Democratic Party’s brand is being dragged down in part by left-wing liberals who are mad at the Party and its leadership. Our survey presents additional suggestive evidence on this front: Senate Minority Leader Chuck Schumer’s feeling thermometer rating in our poll is 29.4/100, the lowest for anyone we tested. Trump scored 11 points higher (40.5) and Vermont Senator Bernie Sanders scored the highest, at 45.9. (Alexandria Ocasio-Cortez was a close second, at 43.1.) Even Mike Johnson, Republican Speaker of the House, had a higher rating (36.9) than Schumer’s.
Lastly, the electoral lean of the double haters currently favors Democrats. Among voters who said they either did not turn out, or voted for someone other than Donald Trump or Kamala Harris, in 2024, and who said they viewed both parties as out of touch (103 respondents), 30% said they would either vote for or preferred Republicans to win control of the U.S. House in the 2026 midterms, versus 70% who said they would either vote for or preferred the Democrats to win. (Due to low sample size, these percentages have a larger-than-average margin of error of 8.9 percentage points).
The implications of this are potentially significant. While many political analysts on the center and center left today suggest the Democrats need to publicly take more moderate positions to appeal more to independents, the evidence suggests the weak party brand is actually coming from disaffection the left. Adjusting issue positions to match that of center or even center-right voters — a dubious strategy from first principles — may target the wrong voters. Yet moving left would incur its own costs. One potential conclusion is that using aggregate statistics to drive party strategy is a fool’s errand.
Understand politics with data, not spin.
This newsletter is sponsored by… paying members of Strength In Numbers!
Strength In Numbers is an independent, reader-supported publication for analyzing politics with hard data and statistical analysis, not punditry and partisan spin. My mission is to provide readers with data-driven, no-nonsense coverage of politics. Subscribers get accurate, honest, and personal analysis they can’t get anywhere else in the media.
Get premium independent, fact-based political journalism with a paid membership to Strength In Numbers today, and get other perks like a private Discord community and access to early releases of new data products.
The government shutdown and health care prices
The government shutdown that ended last week highlighted the economy and health care as major national issues — both of which the Democrats currently have an advantage on. In our October poll, voters said they trusted the party to handle prices and government services more than they trusted the Republicans.
One issue that several Democratic senators cited as their reason for caving on the shutdown was the possibility Americans would lose out on government food assistance. Voters overwhelmingly wanted a solution to this issue, and likely favor Democrats’ compromise to fund the Supplemental Nutrition Assistance Program (SNAP) through next September. When they were asked how the government should address SNAP funding during a shutdown, 58% said it should be fully funded, with capacity to add new enrollees during a shutdown, while 25% said benefits should be restricted to people who were enrolled in benefits when the shutdown started. Just 13% of adults said benefits should stop during a shutdown.
When they were asked who they blamed for the shutdown, 36% of respondents said they mostly blamed Trump, 35% said they blamed Democrats in Congress, and 19% blamed Republicans in Congress. 10% did not place blame on anyone in particular.
Meanwhile, most Americans said they heard some (37%) or a lot (31%) about the expiration of expanded government subsidies for Obamacare — the issue that prompted Democrats to withhold support for a funding bill and kick off the shutdown back in September. When asked what Congress should do now, with the shutdown over, a majority of 59% of voters wants the subsidies reinstated, while 24% support the expiration at the end of the year.
When asked how they wanted the federal government to pay for such programs, 63% of adults said they supported raising taxes on corporations and households making more than $400,000 per year in order to expand social services. 17% oppose.
Immigration and presidential pardons
Two other political issues right now are immigration and President Trump’s use of the federal pardon power.
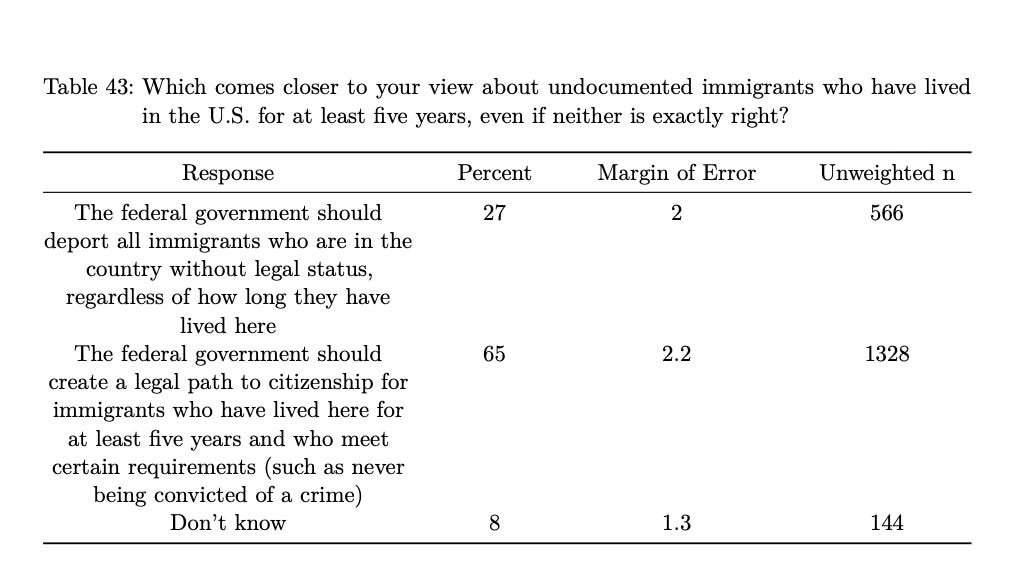
On immigration, voters continue to favor extending a legal pathway to citizenship for long-term unauthorized immigrants, rather than kicking them out. A two-to-one majority prefers letting residents who have been here for more than 5 years and have no criminal record stay (65%) rather than deporting them all (27%). This roughly matches the results from our August Strength In Numbers/Verasight poll, which asked a slightly different question and found 68% of Americans in favor of “granting legal status to non-criminal long-term immigrants.”
Asked about Trump’s use of his Constitutional pardon powers — including, recently, for people involved in the January 6 riot at the Capitol and cases related to crypto-currency fraud — 58% disapprove while 32% approve. This finding echoes our October poll that showed a 55% majority said Trump is “acting like he is above the law” and not operating within the limits of the spirit of the Constitution or other political norms.
Feeling about political figures this month
Finally, we combined this month’s results for our feeling thermometer charts with those of past months. The results for all figures or groups asked about in the last 4 months are included in the chart below:
The low rating for Chuck Schumer is yet more evidence that the left wing of the Democratic Party is upset at its leadership — with the other data in this survey suggesting they are taking out their frustration on the party as a whole.
Other findings:
We poll about a lot of topics, and can’t include everything in this write-up. Some additional questions include:
Whether Americans feel the government is representing them well. (Broken down by whether they supported the winning or losing candidate in the last election.)
Whether Americans would support a third party candidate in their local House election next year. (Losers of the previous election are much likelier to say they would.)
We also asked voters to describe, in their own words, what their ideal political party would stand for and represent. An analysis of this data is coming in a separate writeup of this poll on Nov. 19. Subscribe to get those results in your inbox.
You can view responses for all our questions in the linked .pdf document.
The takeaway
Our latest Strength in Numbers/Verasight poll shows Democrats holding a small but steady lead in the 2026 House generic ballot, which grows a bit when people are reminded Republicans control Congress.
Trump’s job approval is underwater, especially on prices and health care, and most voters think he hasn’t delivered on his economic promises. People overwhelmingly want SNAP funded during future government shutdowns, and want ACA subsidies restored. They largely support paying for social programs by raising taxes on corporations and high earners.
Both parties are seen as out of touch, but Democrats are dragged down more by frustration from their own left-leaning voters, even though those same “double-haters” still prefer Democrats in 2026.
All in all, voters seem frustrated with the political status quo but still lean toward Democrats on big issues like the economy, health care, major Trump administration priorities including trade and immigration enforcement. The broad Democratic lead on most major political issues today is a reminder of how quickly the political fortunes of a movement can change when it pushes government policy too far from that which is sanctioned by public opinion.
That’s it for this month’s survey. You can download a full topline file, select key crosstabs mentioned in this article, and methodology statement using the link below:
And the full questionnaire for November’s poll is available here:
If you have any questions about this poll or the release, please email polling[AT]gelliottmorris.com.
Have a suggestion for next month’s poll? You know what to do!



I guess that the question for Democrats is whether a shift to the left would shed as many or more voters from the center as it would attract voters from the left.
Is there any data on what % of registered or likely voters do not know that Republicans control Congress?