Trump is underwater on trade in 40 states
According to analysis of issue approval data in Strength In Numbers/Verasight polls
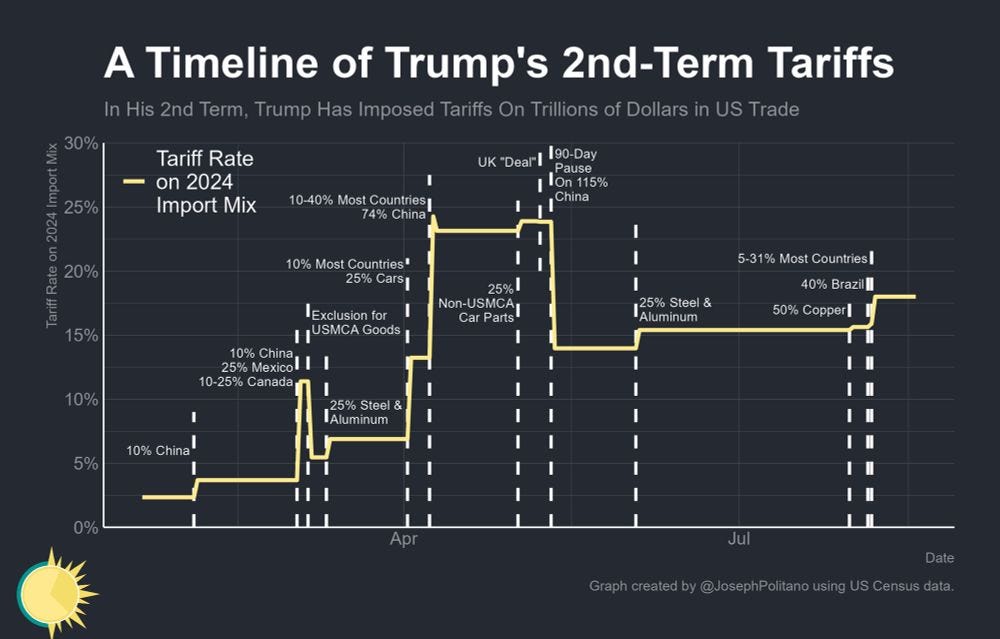
This week, Donald Trump put in place a fresh set of tariffs on imports from nearly 70 countries. The new taxes range from 10 to 41%, and add to the tariffs the president already enacted earlier in his term. Friend of Strength In Numbers Joey Politano calculates that the average good imported into the U.S. now has an 18% tariff attached to it:
Now would be a good time to stock up on coffee.
We know that Trump's tariffs are unpopular. Back in March — before the “Liberation Day” tariffs announcement and subsequent stock-market scare in April — the New York Times found that just 40-45% of adults in the average poll said they were in favor of the president's trade policy.
Support for Trump on trade has fallen since. In the July Strength In Numbers/Verasight poll, just 38% of U.S. adults said they approved of how Trump is handling "trade with other countries," compared to 56% who said they disapproved. And when people were asked what issues they've seen covered in the news over the last month, the president's tariffs were the third-most mentioned policy.
That mix of low approval and awareness is potentially toxic for the president and his party, as they look to fight several elections for governor in 3 months and in midterm congressional races next year.
While national polls on tariffs are plentiful, we lack data on how Americans in most state feel about Trump's policies. That's a shame, because it would be good to know if Trump's trade policies are underwater in key states. Such data could be used, for example, to communicate with senators about Trump's use of emergency powers — potentially handy as some members of Congress try to reassert Article I authority over import taxes. It’s also just good to know what opinion in the states looks like since we are not a direct democracy.
So for this week's Chart of the Week, I'm going to take our May–June SIN/Verasight polls and calculate Trump's approval on trade at the state level. And, well, by now you've seen the headline of this article — so you know the picture for the president is pretty bleak.
Swing states are strikingly negative on tariffs
My predictive model trained on 4,000 interviews with U.S. adults shows that Trump’s approval on trade is just 41% in the average state, whereas 59% disapprove of his job performance in the area. Trump is below 45% in every major battleground state — including Iowa, Texas, and Florida, where Republican senators are running for re-election next year.
In competitive states, Trump is weakest in New Hampshire and Pennsylvania, where just 39% of voters approve of how he’s handling trade, followed closely by Nevada at 40% and Michigan at 41%. These are states where the margin of victory in the 2024 presidential elections was razor-thin, so a twenty-point deficit for the president represents meaningful degradation in support for his agenda.
And even in swing states where Trump performed better in 2025, he remains firmly underwater on tariffs. On average, in all competitive states, Trump's approval on tariffs is 10 points below his vote share in the 2024 presidential election.
Aside from state-level patterns, there's also a noticeable regional gradient. The tariffs are least popular in the Northeast (average approval = 36%) and the West (40%), where high-cost coastal metros and consumption patterns likely make price increases more salient. And Trump is only even in Kentucky, Indiana, and Tennessee, where he won by double-digits in 2024 and which rank highly in terms of imports ranked by state.
There's a plausible effect of cross-border trade, too; Trump is underwater on tariffs in all border states except North Dakota (where he's only at 51% approval). Trump’s tariffs on trade with Mexico and Canada have tended to be less popular than his tariffs on far-off countries.
Finally, while tariffs are expected to be losers in deep-blue states, Trump is only barely holding on in many deep-red ones too. The president rarely breaks the mid-50s in most of his key strongholds. He's at 56% in West Virginia, for example, a state he won with 70% of the vote in 2024.
This suggests tariffs aren’t simply a partisan loyalty test. Just based on the mathematics of his decline in deep red states, many Republican-leaning voters (most of them rural) appear to be balking at the president's trade policies.
A methodology footnote for this analysis can be found after the conclusion.
Trump’s tariffs are unpopular everywhere
In our data, Trump is net unpopular on trade in 40 of 50 states.
These numbers show that tariffs are not just an abstract trade fight in Washington or red meat for the media. The president's policies are broadly unpopular on the ground, including in states critical to his 2024 coalition and in places where Senate races could flip control of the chamber in 2026.
Trump's latest tariffs come as continuing unemployment claims have hit their highest level since the COVID-19 recession, inflation is rising, and job growth is slowing. On the horizon, there's a relatively good shot that the courts rule Trump's use of emergency powers for his tariff plan unconstitutional, or that some members of Congress try to force a vote on presidential tariff powers.
Backlash to an unpopular agenda on trade could be determinative in the near future. For instance, senators representing states where approval of Trump’s trade policy is especially low could face pressure from constituents to take a public stance against the tariffs, or vote to revoke the president’s authority — even if they’re from a red state.
In producing these estimates, my hope is that state-level approval data can serve as a valuable tool for journalists, policymakers, and campaigns who want to understand the geographic contours of public opinion on key policies. Hopefully some of them even want to better represent their constituents in Washington.
After all, while we have lots of national polls, we only have two national federal elected leaders (and only one that truly matters). The other 535 hail from the state or lower level. Congresspeople are constantly in the dark about what their constituents think, so deriving estimates for them fills a crucial hole in Washington’s collective understanding of public opinion. Devoting my time to producing these estimates solves a neglected but important problem.
While I've already been publishing an estimate of Trump's overall opinion on the data portal, which has got some traction, this issue-specific look adds additional resolution on a key policy vulnerability for Trump. (PS: if you want me to MRP other estimates, put your requests in the comments below!)
And this leads me naturally to plug a paid Strength In Numbers membership. No other data-driven political journalist is producing high-frequency, high-resolution state-level estimates of public opinion on this scale and making them available to the public. If you value this kind of analysis, consider subscribing to Strength In Numbers to support our mission and ensure work like this remains both possible and public in the future.
Methodology footnote
To produce these state-level approval estimates, I used a multilevel regression and post-stratification (MRP) model to distill national surveys into estimates of opinion at the sub-geographic level. First, we (Strength In Numbers/Verasight) interviewed 4,000 Americans about U.S. politics and Trump's presidency between May and June, asking respondents a variety of demographic and political questions as well as whether they approved or disapproved of "Trump’s handling of trade with other countries.” For this model, I threw out respondents who said don’t know/not sure.
Then, I used a Bayesian multilevel regression model to estimate the relationship between a respondent’s demographics (race, age, sex, education, income, and party), their state of residence, and their approval of Trump’s trade policies. This model borrows information from similar respondents across the country, ensuring more stable estimates even in states with relatively few direct survey responses. This model produces a predicted probability of approving of Trump's trade policies for every person in the country, based on the above variables.
In the post-stratification stage, I created predictions of group-level opinion for the joint distributions of those demographic and geographic variables as reported by the Census Bureau’s American Community Survey. This step effectively “re-weights” the national survey data so that each state’s result reflects its true population, rather than the mix of people who happened to take our survey. I added party to the usual Census poststratification frame by running a separate model on party identification and past vote from several large-n academic and public surveys, and reweighted the estimates to match the results of the 2024 election.
The result is a set of state-level approval estimates that reflect both the patterns in our survey data and the known partisan and demographic makeup of each state, giving us a high-resolution look at how opinion varies across the country. While no model is perfect, MRP is widely regarded as one of the most reliable methods for producing state-level estimates from national polls. It is a reasonable guide to opinion when we lack state-level data.
These estimates have uncertainty intervals ranging from 2 to 6 percentage points, depending on the state.
With respect to polling about specific issues , I would be interested in how Trumps aggressive ICE stance is polling. The masking, lack of presentation of credentials, not allowing detainees to contact legal representation, and yes even starting to do some family separations smacks of flat out kidnapping of our neighbors. How's that going down with Americans?
I’m curious to know how Texans feel about redistricting/ gerrymandering halfway through the normal Decennial event.