


America's economy is stuck on the tracks
Inflation is up, hiring is down, the GDP is shrinking — and it’s all Trump’s fault

Note: I’m writing an extra Wednesday post this week because there are some important new economic statistics I want to talk about. This is an example of a type of post I would normally paywall, but since the paywall hasn’t gone up yet, everyone gets to read for free. Take this time to consider whether a paid membership to Strength In Numbers is right for you.
U.S. government statisticians on Wednesday, April 30, released three sets of economic statistics that show the economy contracting, hiring down, and inflation stable or ticking up, depending on how you look at it. What people are calling the “Trump recession” is not fully here yet, but the path for the U.S. is basically set.
The economic situation in America today is kind of like a car stuck on train tracks, except all the doors have the child lock on and you can’t get out. At this point, the train is only 400 yards away, so even if the conductor slams the brakes, he can’t avoid you, and you can’t escape the car. The train is Trump, and the economy — and you — are in for quite a blow.
The big problem is that conditions are getting worse faster than the data can keep up, and faster than the president can roll back his mistakes. Let’s look at the numbers so you can see what I mean.
First, here’s all the economic data released today — crammed into one chart and annualized to the same scale and quarterly frequency — so you can get a visual feel for what’s going on:
Data and calculations available here.
And the headlines from the various indicators are as follows:
GDP shrank in Q1 thanks to lower consumer and government spending
The U.S. Bureau of Economic Analysis on Wednesday estimated that Real Gross Domestic Product — the sum of investment, consumption, government spending, and exports minus imports — shrank by 0.3 percent at an annualized rate from Q4 2024 to Q1 2025. That means that if the economy continues to shrink for the next year at the rate it did from December to April, the year-on-year change in the collective output of America would be -0.3%. That’s down significantly from 2.5% growth before Trump took office.
GDP is just a formula for combining components of growth into one headline number that’s easy to digest. But those individual components tell us what’s really going on in the economy:
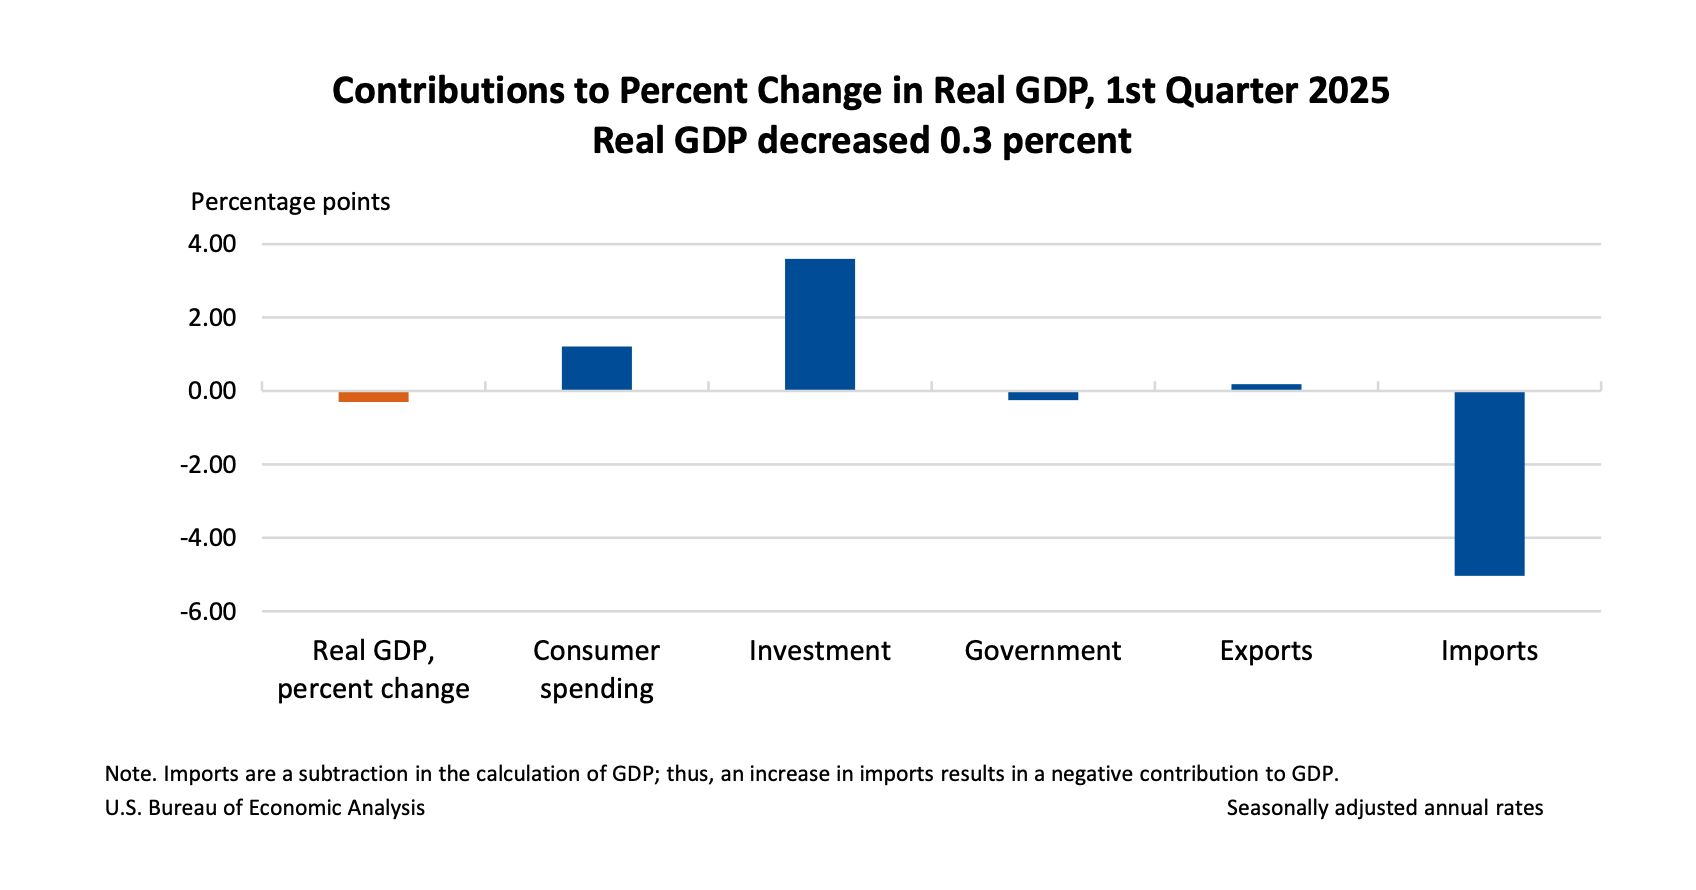
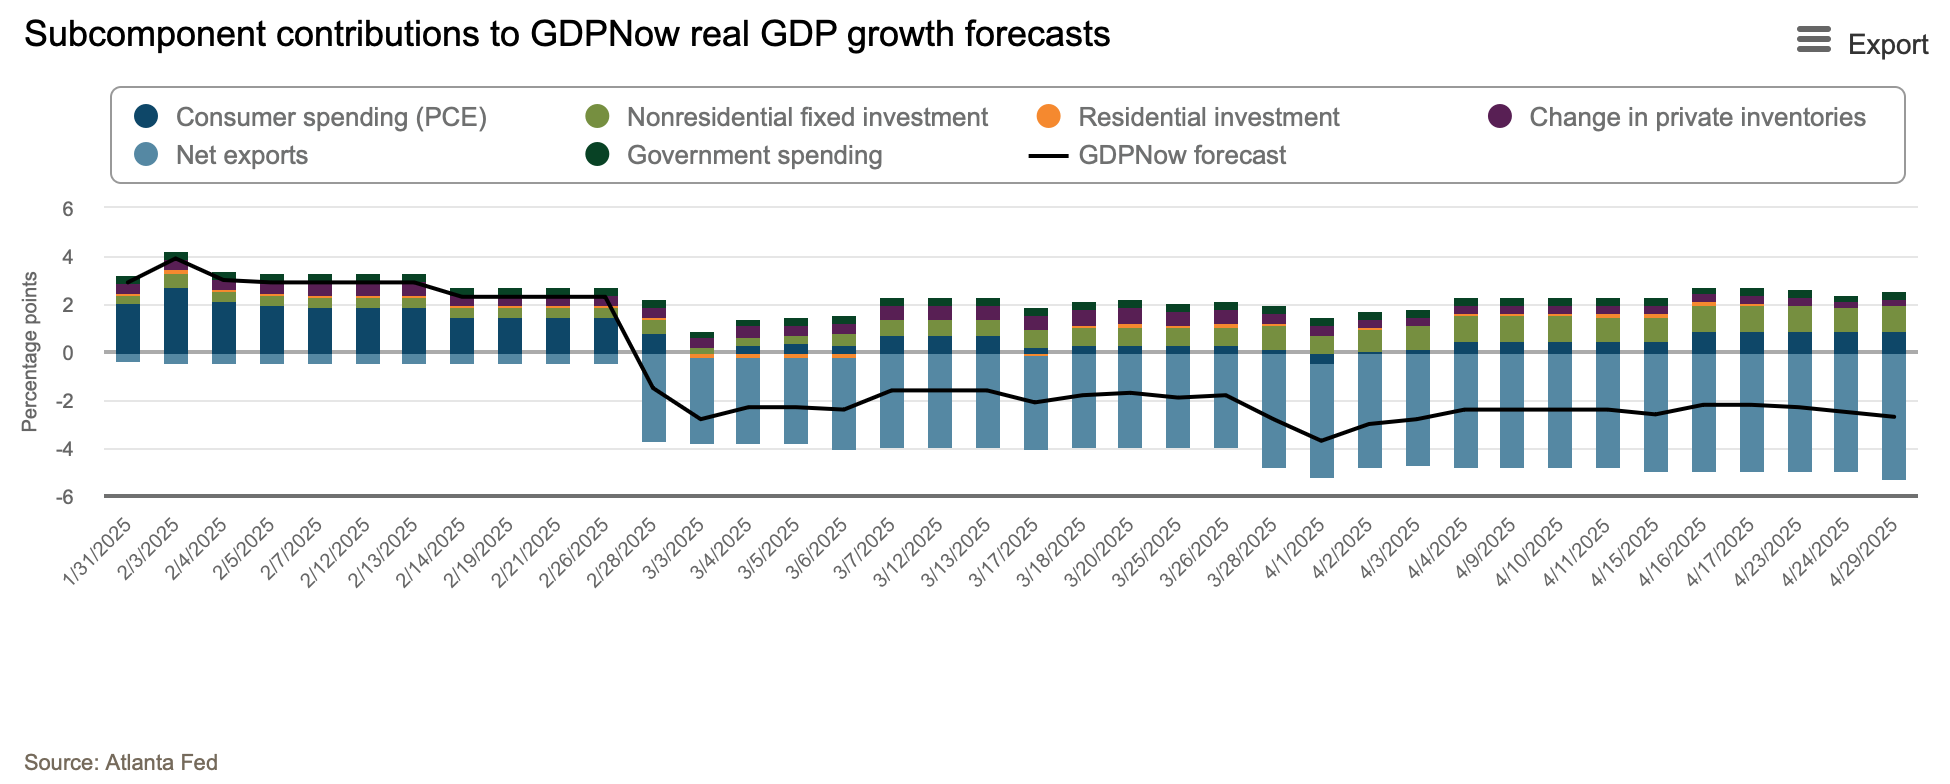
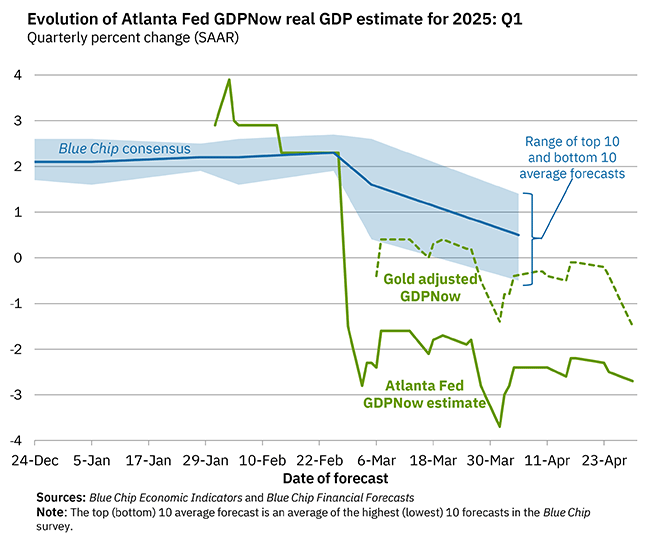
A big reason why GDP was negative last quarter was because government spending fell. Imports also fell, but because they are counted as consumption, the decrease there is not why GDP fell, as some reports have claimed. Economists have speculated that the surge in imports is due to businesses getting orders in before Trump’s tariffs kick in. The Atlanta Fed told us about this last month when a surge of imports of gold caused their economic now-casting models to turn sharply negative. You can see this on their graph here:
Compared to Q4 2024 the annualized change in consumer spending was down by about a point.
There’s been a slowdown in hiring
ADP, a company that serves as a payroll provider for a ton of private companies (including most of the firms I’ve ever worked for), also released new monthly data on Wednesday. They find the U.S. only gained 62,000 private-sector jobs in April, about 50% of the expected 120,000 gain from forecasters. Interestingly, most of those job gains were in the leisure and hospitality sector, even though low international tourism has been putting pressure on the industry.
The government will have official hiring statistics out for April this Friday. That will include indicators such as the number of jobs gained in April, the unemployment rate, etc. Those are numbers that get fed into my index of economic growth, which is already turning sharply south, but which I fear has a long way down to go as these stats get factored in.
Inflation in prices is rising again
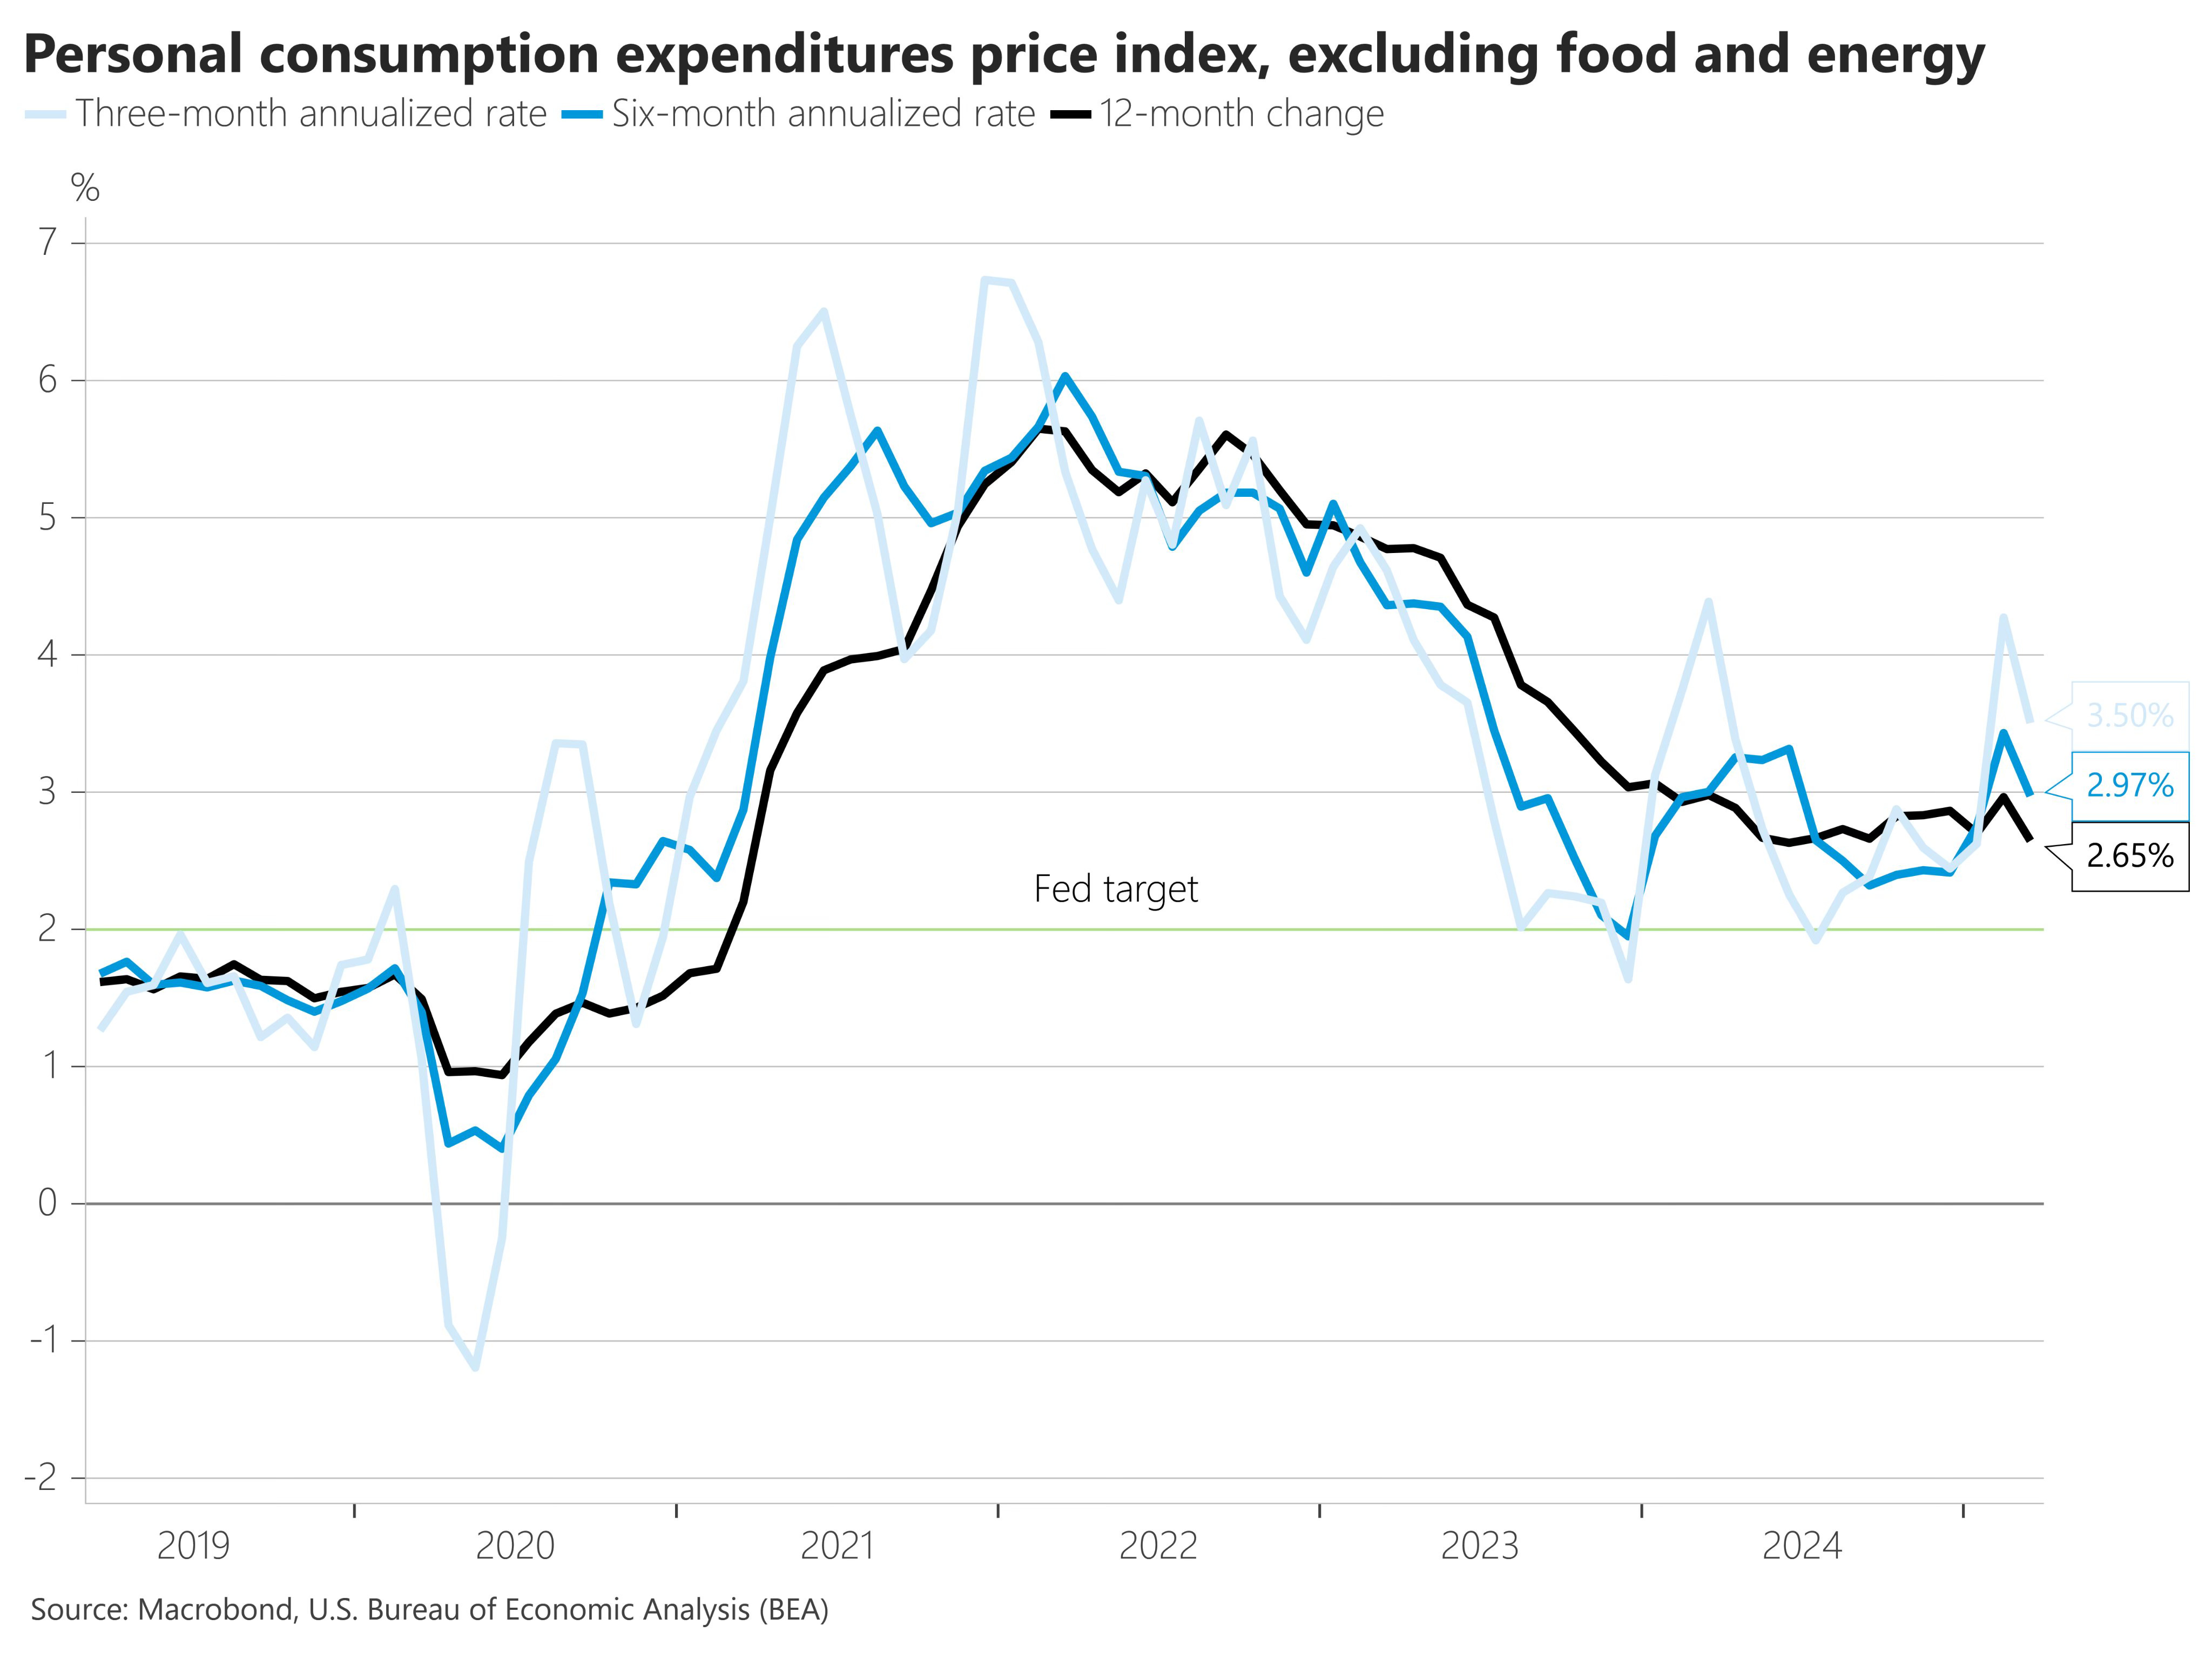
For March, the BEA estimates that “core” inflation — changes in prices for items other than food and energy — was just 2.6% year-over-year in March. That’s only about half a point off the Federal Reserve’s target for inflation, which should be good news!
However, now for the bad news: It’s not March, and the annual rate of inflation tends to hide recent changes in prices by including too much data (twelve is bigger than 1, and 12 months was a long time ago). So what if we just look at changes in prices over the last 6 months or quarter? On an annual 6-month basis, the Wall Street Journal’s Nick Timiraos points out, prices are rising more now than they were in January.
And if you dive deeper into the BEA’s advance GDP report, you’ll find an estimate of Q1 PCE change, not just for March. There, the BEA says core PCE is up a whopping 3.6%, up sharply from last quarter’s 2.4%. That is… nasty. As Harvard Economist Jason Furman puts it: “That is not a good place to be going into a trade war that will be at least temporarily raising the inflation rate.”
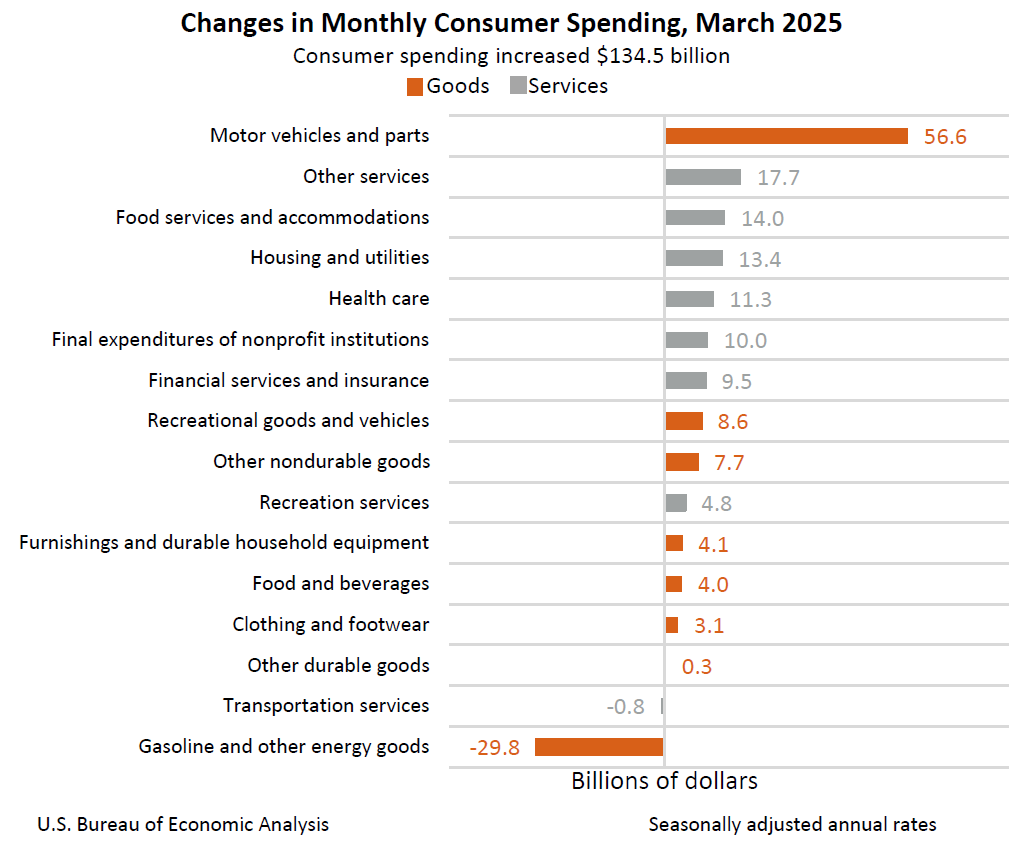
The BEA says prices for automobiles and auto parts rose $56 billion last quarter — again, the speculation from economists is that this is due to people importing cars before Trump’s tariffs decimate the industry.
So, that’s the data. Here’s my analysis:
This is Trump’s recession
This morning, the President insisted on the social media platform he owns that these bad numbers are not his fault; that “This is Biden’s Stock Market, not Trump’s.”
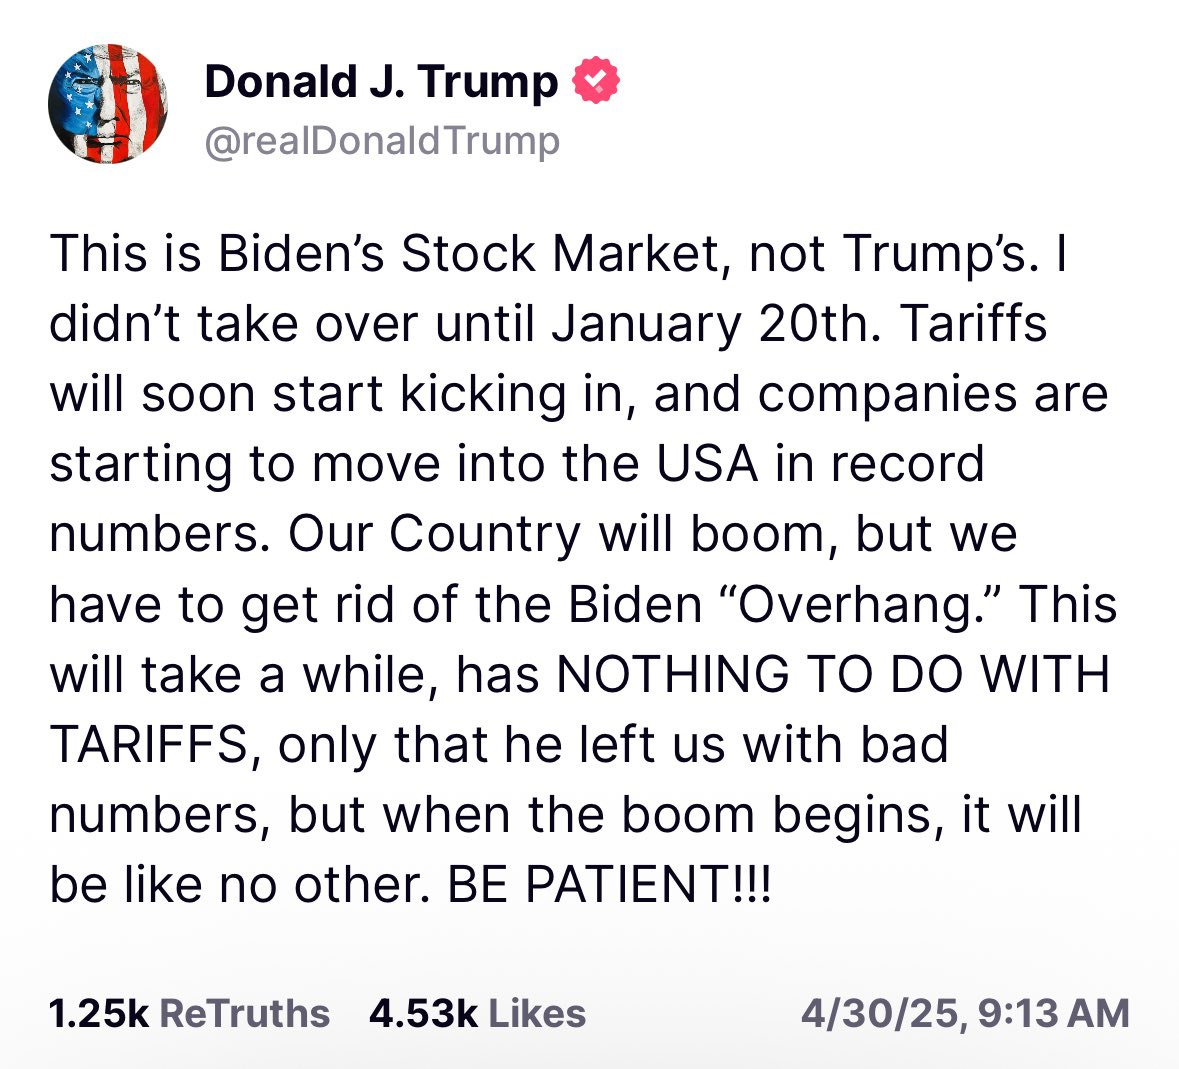
There are, of course, two problems with this:
First, the “stock market” (such that it is) is forward-looking, not backward-looking. The S&P 500, for example, reflects investors’ expectations of future corporate earnings for large U.S. firms, adjusted for prevailing risk premia and interest rates. The market has fallen since January 20, not because it learned that business conditions were bad, but because investors’ forward-looking forecast of earnings fell.
But even if you look at the backward-looking indicators, the story here really is about Trump. Businesses did not do a history-defying amount of importing for no reason, and certainly not because of something that Biden did in January when he was a lame duck. Before he took office, the Atlanta Fed’s GDPNow model, which forecasts GDP growth for the quarter based on backward-looking business indicators, had an annualized economic growth for Q1 at 3%!
And prices were growing close to the Fed’s 2% target, only jumping again (in terms of the changes in the growth rate) in March-April. Here’s WSJ’s Nick Timiraos again:
In summary, although it doesn’t really need to be said that Trump is just spinning bad numbers, in this case, we actually do have the public data to prove he’s wrong.
The beatings will continue until morale improves
The final thing to mention is that the economic statistics today don’t fully capture the expected impact of Trump’s policies on the economy. Things will get worse before they get better.
For one thing, as Paul Krugman points out, the BEA’s advanced GDP estimate only includes data up to March 31, which was two days before Trump announced his “Liberation Day” tariffs. Nothing that has happened over the last 28 days is “priced in” to the official statistics we have today. 28 days might not sound like a lot, but it’s roughly one-third of Trump’s presidency so far!
And for a second consideration, take into account that there is a lag between the president’s tariffs and their impact on the economy. The biggest reason is that freight trade takes a while to get from China, our third-biggest trading partner, to America. That’s because boats, which carry the bulk of global trade, take a while to go across the ocean. We haven’t seen empty shelves in stores yet (and this is important because when supply goes down, prices go up), but we will see them starting in about two weeks.
Shelves will become bare regardless of policy change. That’s because even if Trump reverses course on his 145% tax on goods imported from China, it will not undo a shock to supply that is still in the process of getting here — which means we’ll still see the consequences of the administration’s bad policy. And then, if the government does change course, it’ll take a while before conditions improve.
This is Trump’s economy, we’re just living in it.
Thanks for a report even I can understand! The urgent points were so clear.
Very clear discussion of the recent, but not current, data, GEM. As you note, reporting-lags might mean that current data is worse.
Apropos of Strength in *Numbers*, I hope we continue to get reliable quantitative economic reports. I wonder whether the BEA will soon be filled with Maga-conomists who cook the data to please Trump or shut down BEA altogether. There will continue to be reliable NGO sources even if BEA is destroyed, but it will be more challenging to figure out what's going on.
Anyway, KUTGW.