

Graphs about gas prices and presidential approval
History says gas prices have a small impact on presidential approval — but it's not equal for every president

This post is free for everyone. If you find this kind of data-driven analysis valuable, consider supporting my work with a paid subscription.
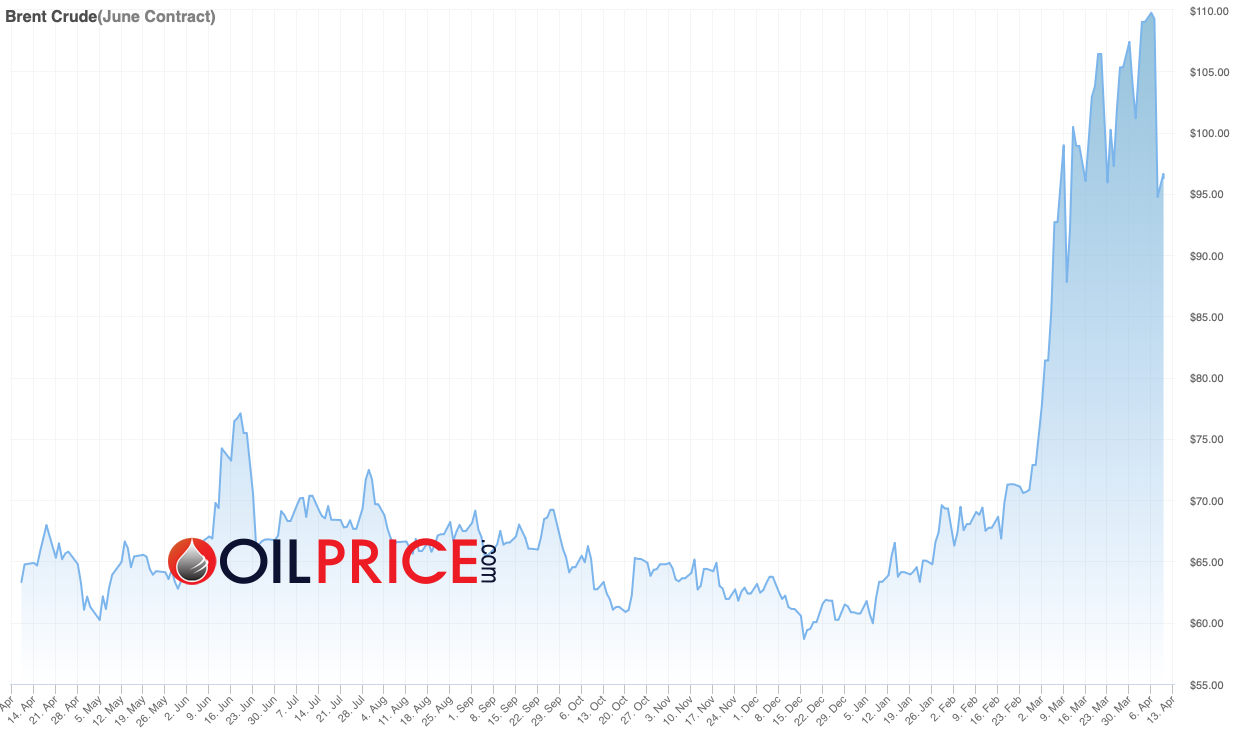
Oil prices plunged this week after the U.S. and Iran agreed to a two-week ceasefire. Crude fell more than 15% on Tuesday alone — its biggest one-day drop since 2020 — settling around $94 a barrel. That’s still well above the ~$70 level before the war started, but it’s a dramatic reversal from the $110+ prices of recent weeks.
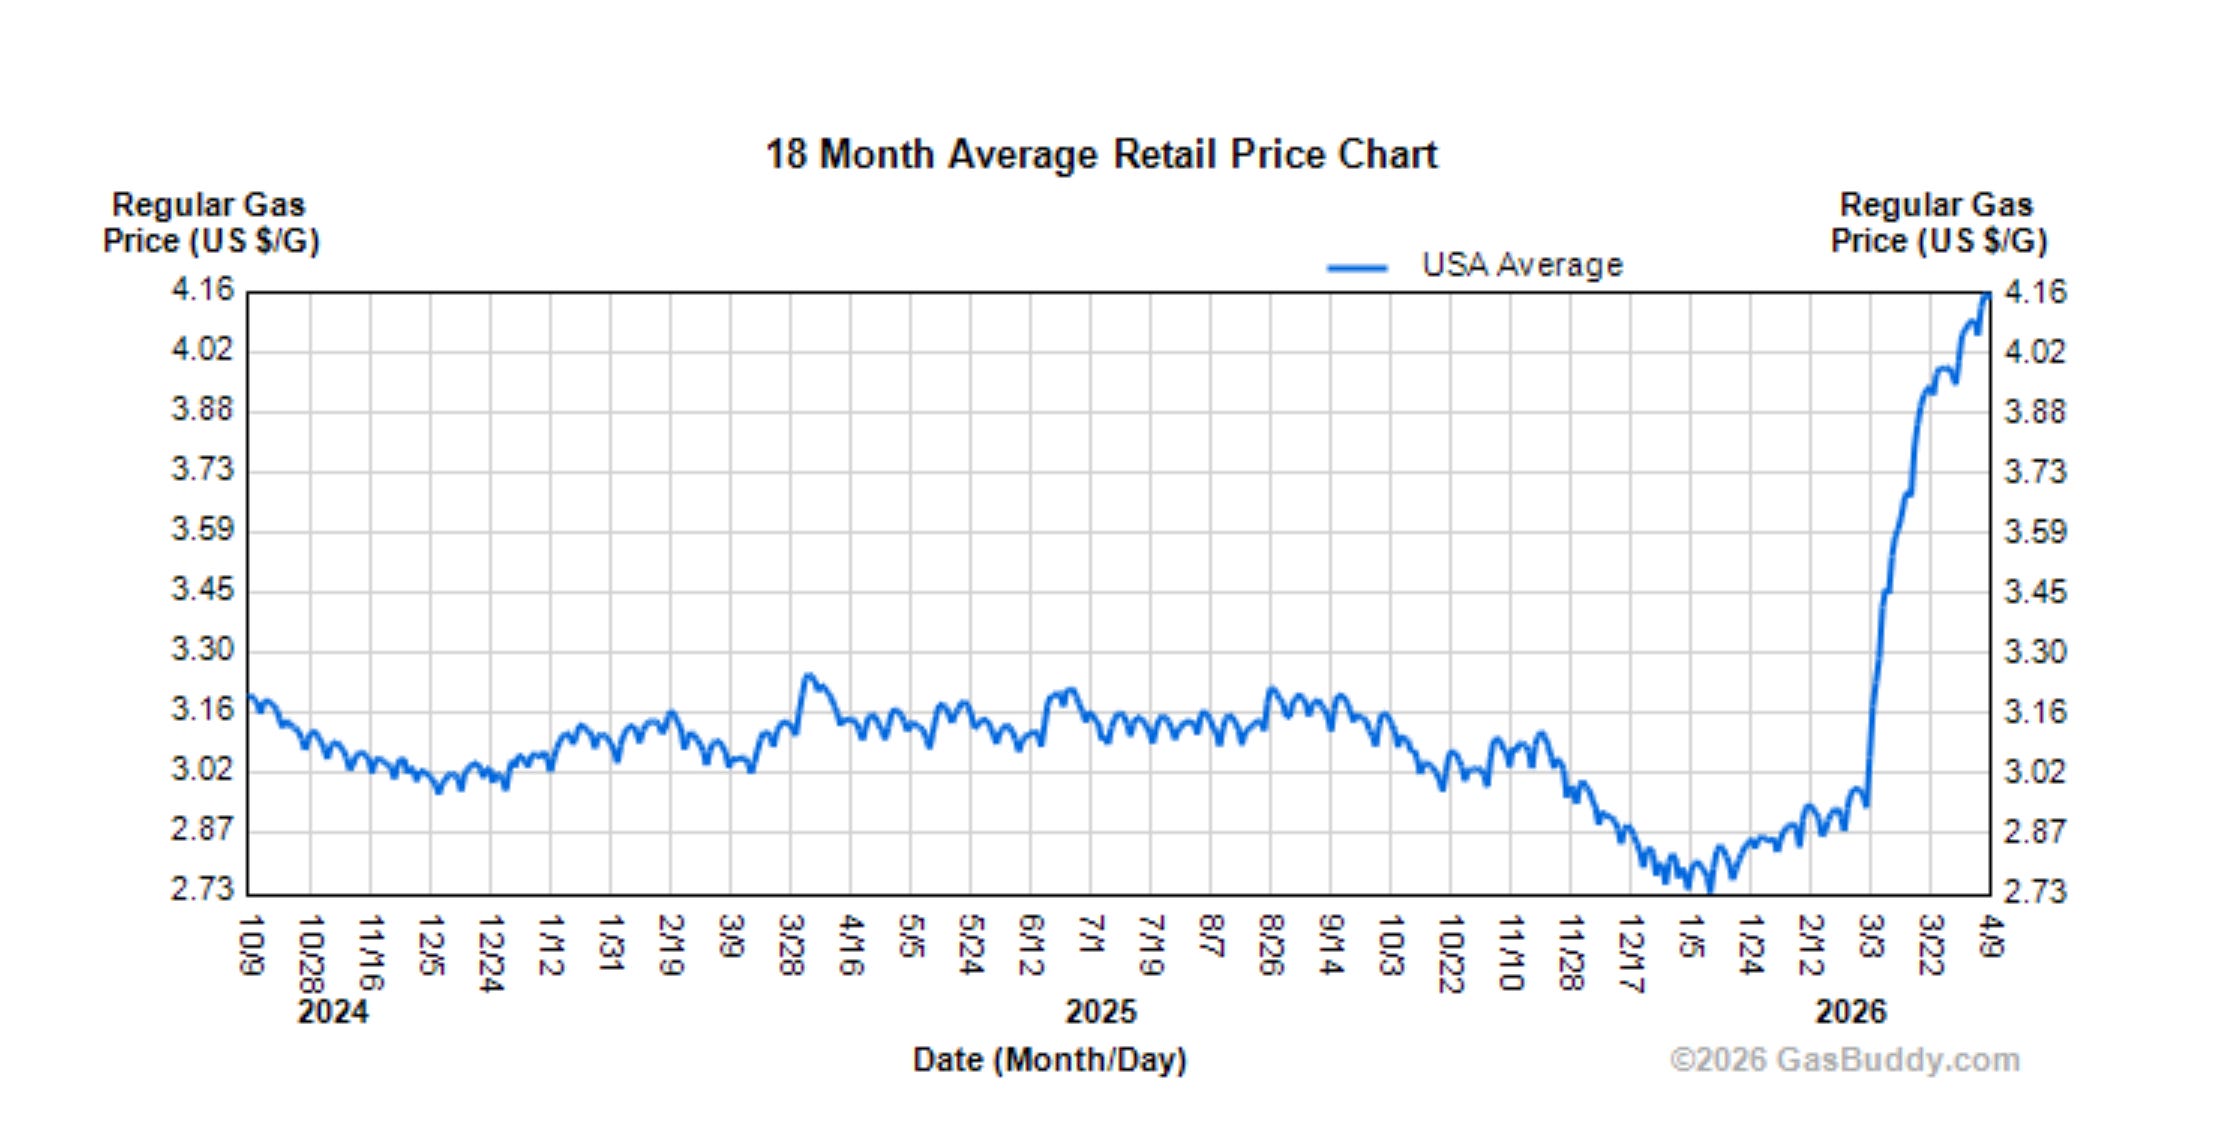
But gasoline prices haven’t declined yet. They usually do, with a lag of a few weeks — but gas is still up nearly 40% since the conflict began in late February, so it has a long way to fall back to “normal” levels. Here are two charts of oil and gas prices I found online:
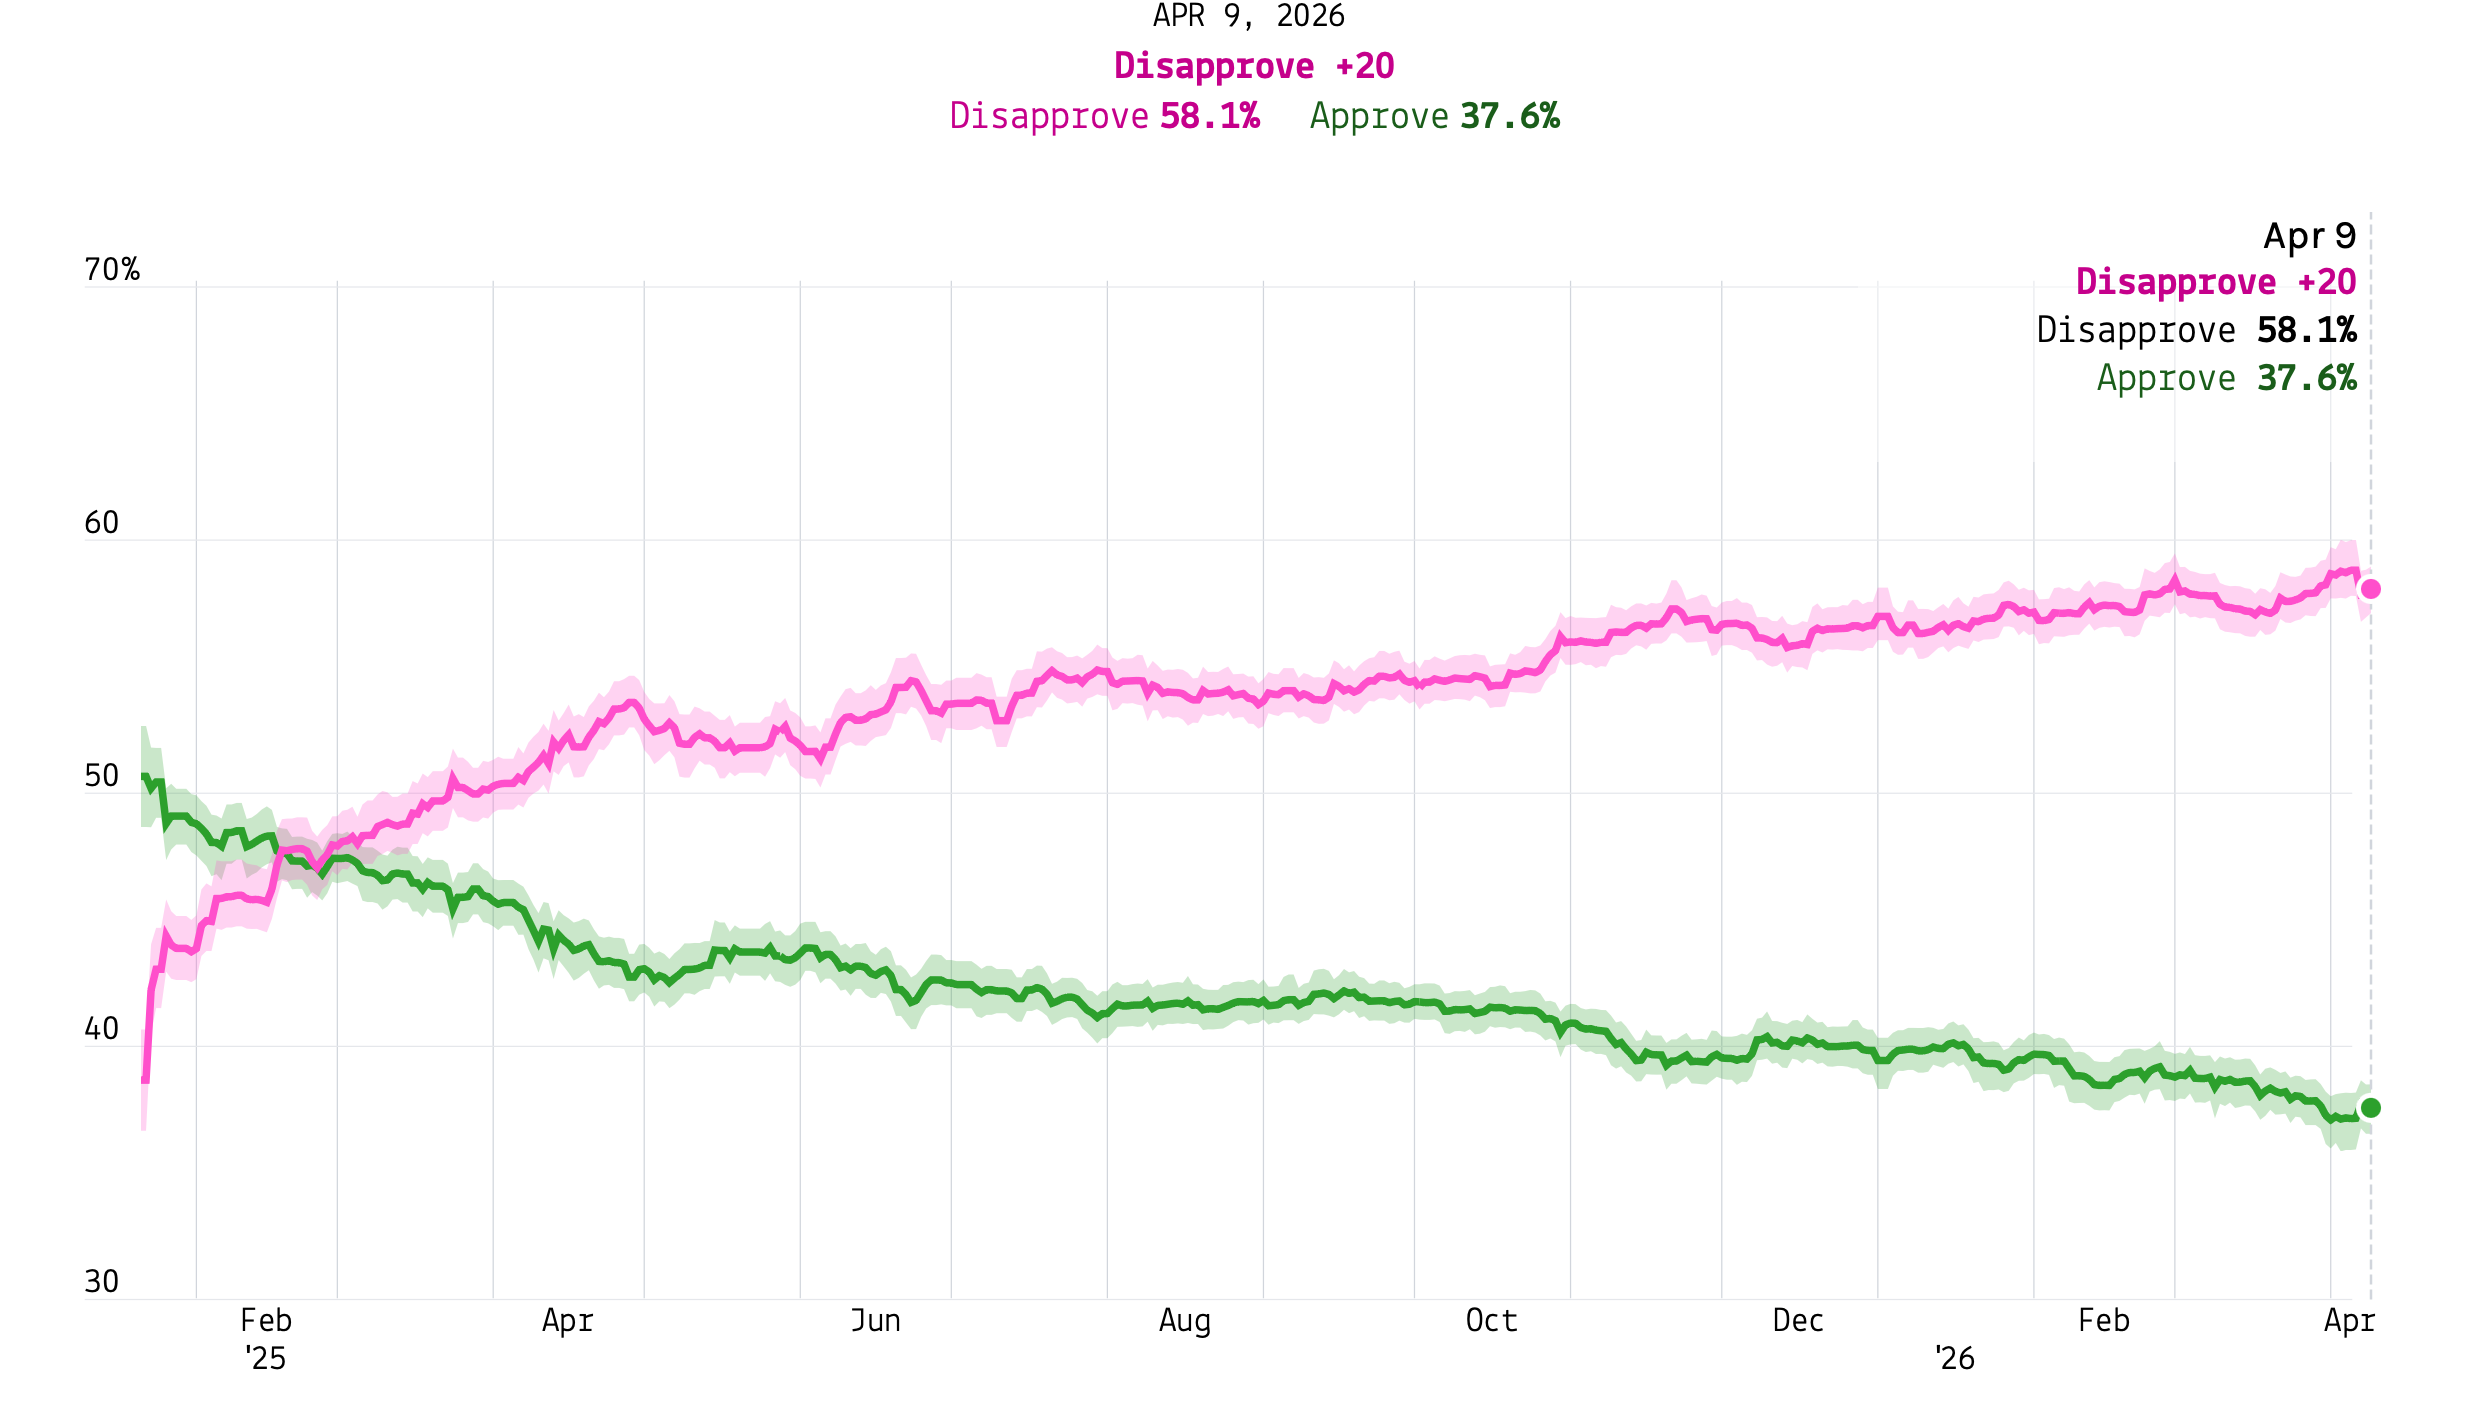
One question subscribers have been asking me this week is: If gas prices do fall back to normal levels, will Trump’s approval recover to what it was before the war in Iran broke out? Chart of Trump’s approval, from FiftyPlusOne.news, below. There has been a small rebound in Trump’s net rating over the last week, but it’s inside the uncertainty interval and could be noise.
But this brings up the secondary question of how strong the historical relationship between gas prices and presidential approval is in the first place. So I pulled weekly gas price data from the St. Louis Fed and daily presidential approval estimates from our data at 50+1 going back to 2009 to find out. This week’s Chart of the Week is: a data-heavy look at the gas price–approval connection across four presidencies. Even if we don’t learn anything concrete, I think these are some fun graphs I haven’t seen elsewhere.
The big picture
Here’s the full 2009–2026 view of both gas prices and presidential net approval rating. Gas prices are on top, with net presidential approval on the bottom. Shading represents which party is in control of the presidency.
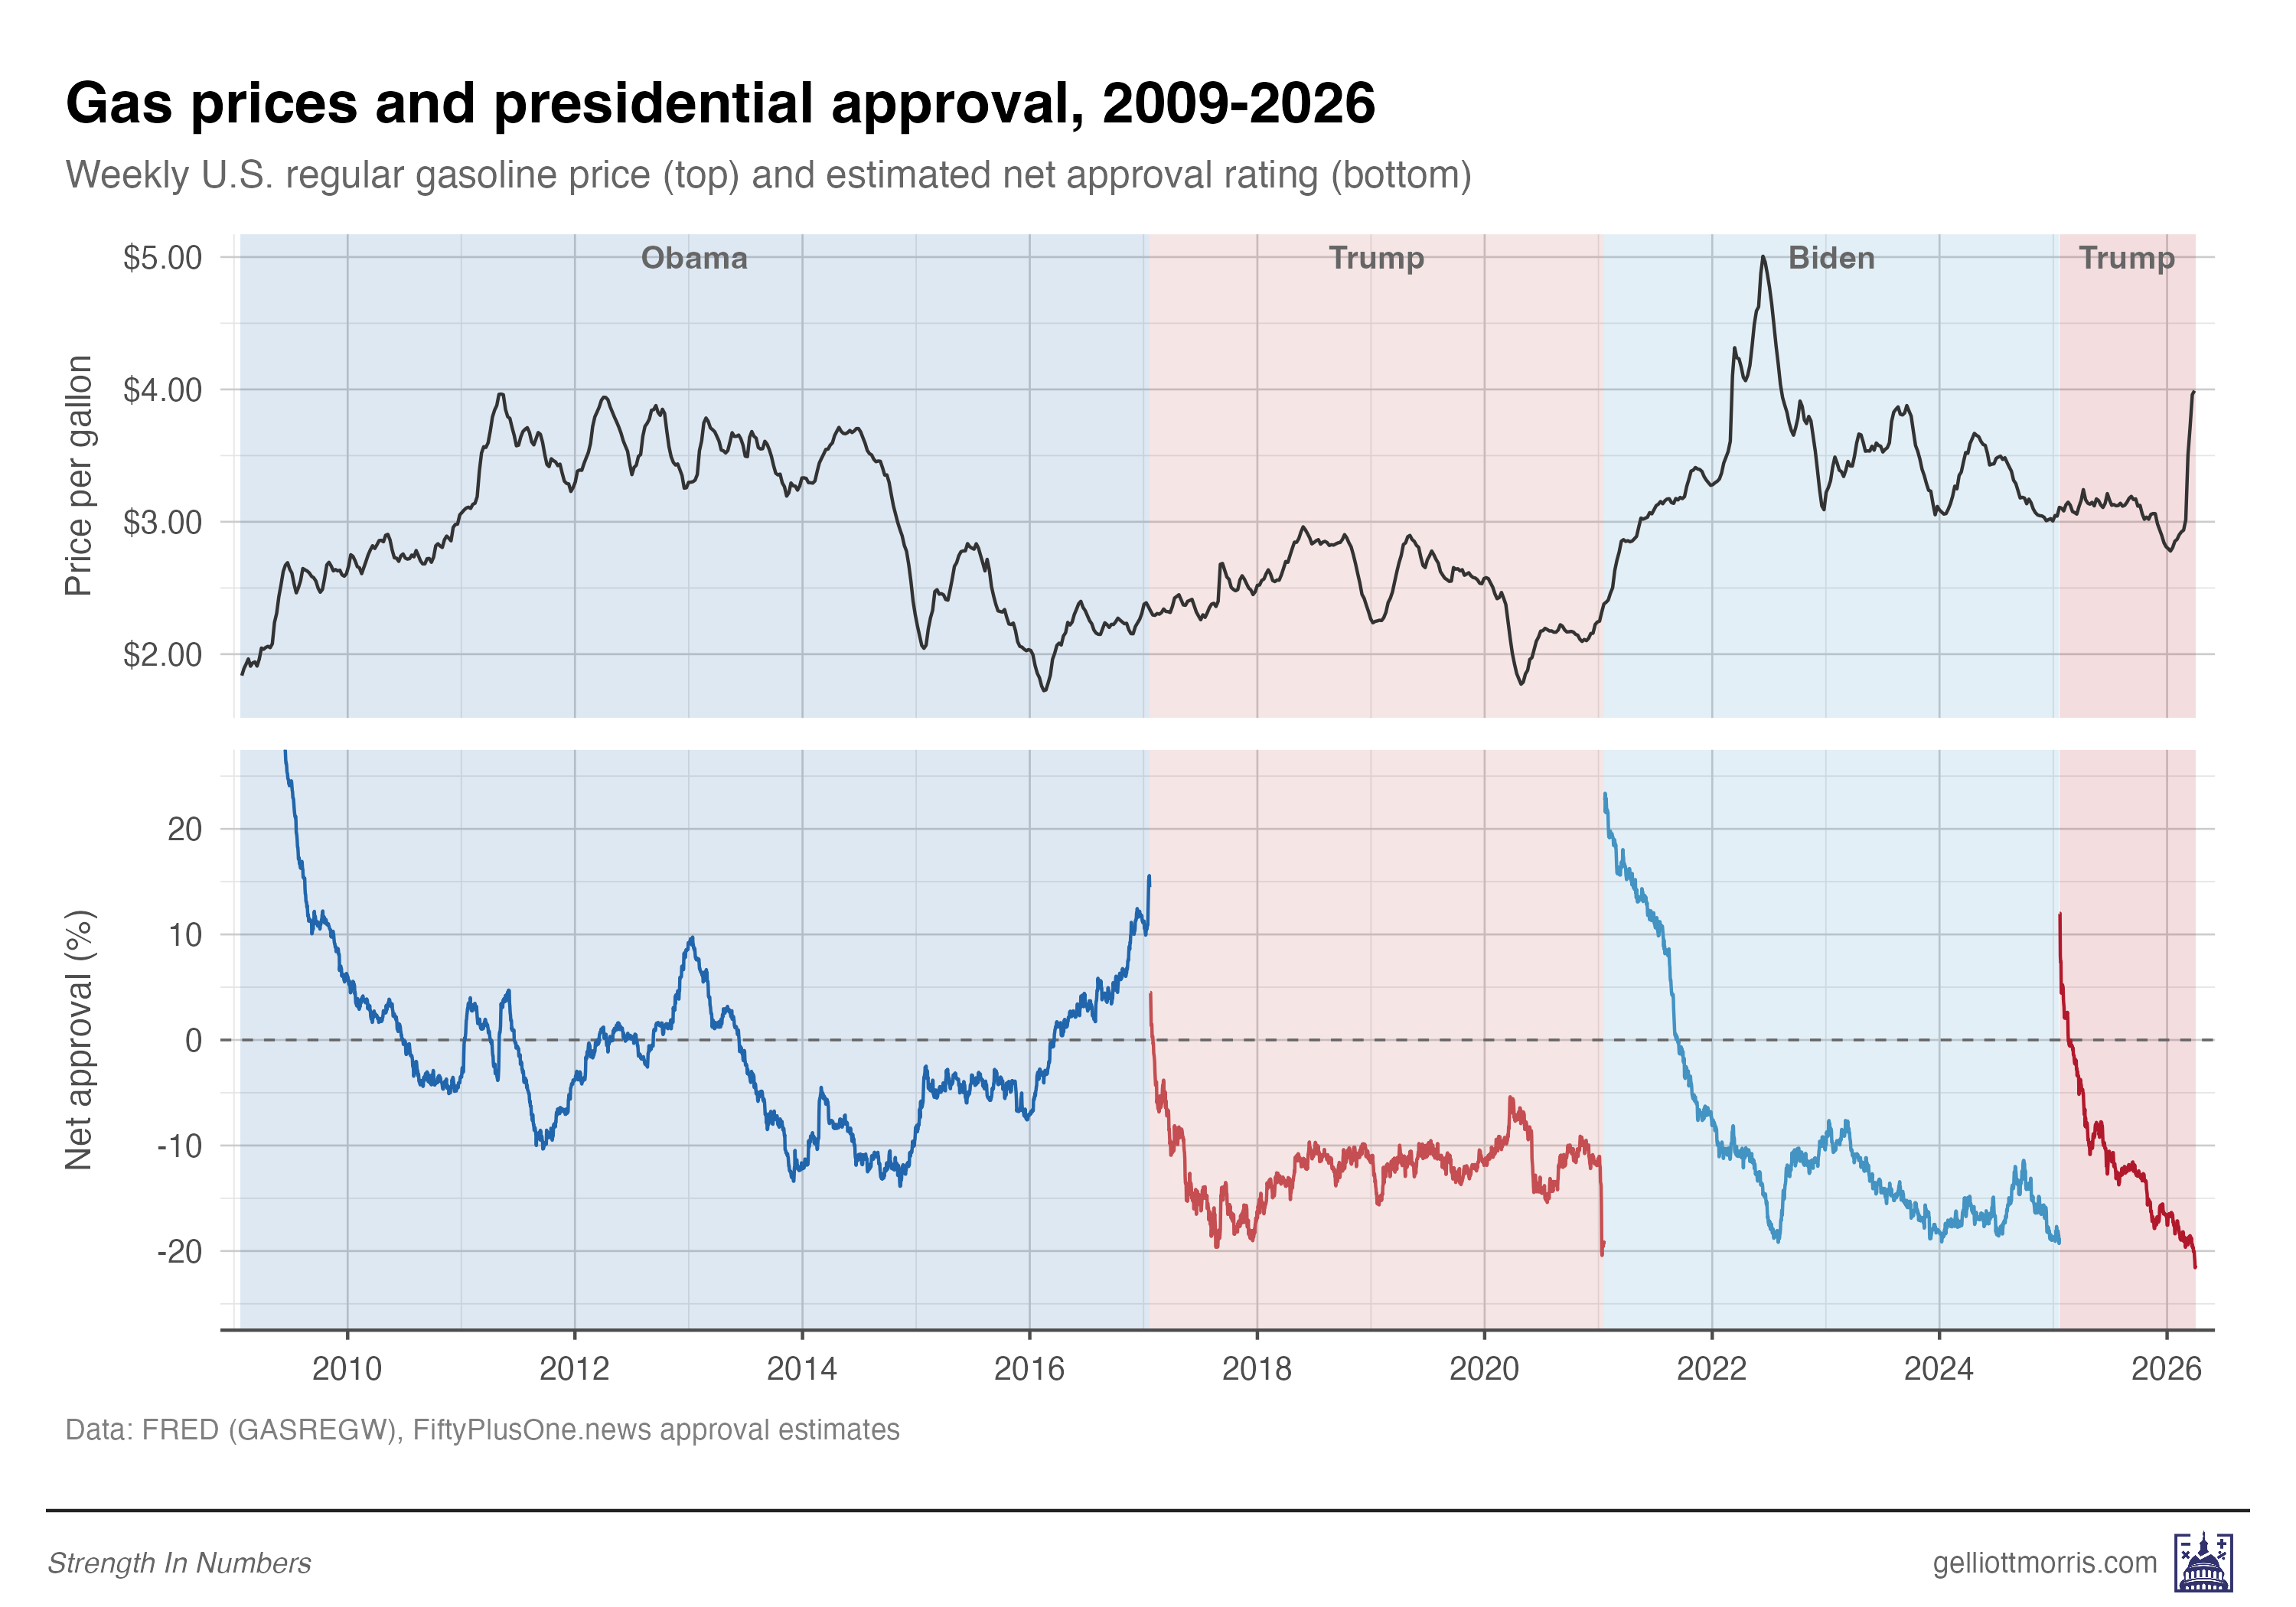
The first thing that jumps out is that two series often move in the opposite directions, especially under Obama and Biden. When the national average price of a gallon of gas increases, presidential approval decreases. Yet the trend is not universal. During both Trump terms, the connection is much weaker.
Note, second, that there is a general secular trend downward in presidential approval for the first six months to a year a president is in office. That seems to persist regardless of what happens to gas prices. Then, there are occasions when gas prices are flat or falling, while presidential approval still moves down. That’s because voters care about things other than gas prices.
Approval and gas prices by president
To get a cleaner look at the relationship between these two trends, I standardized both series within each presidency. This adjusts for inflation in gas prices and for each president’s baseline approval level (polarization appears to make presidents less popular, and approval less responsive). In the charts below, gas prices are inverted — so when the two lines move together, it means higher gas prices correspond to lower approval (or vice versa).
The correlations in the charts below reinforce the finding from above: Obama (correlation coefficient of 0.30) and Biden (r = 0.34) show a moderate relationship between gas prices and approval. Both Trump terms show almost none — r = 0.08 in his first term, r = 0.05 in his second (though it’s still early).
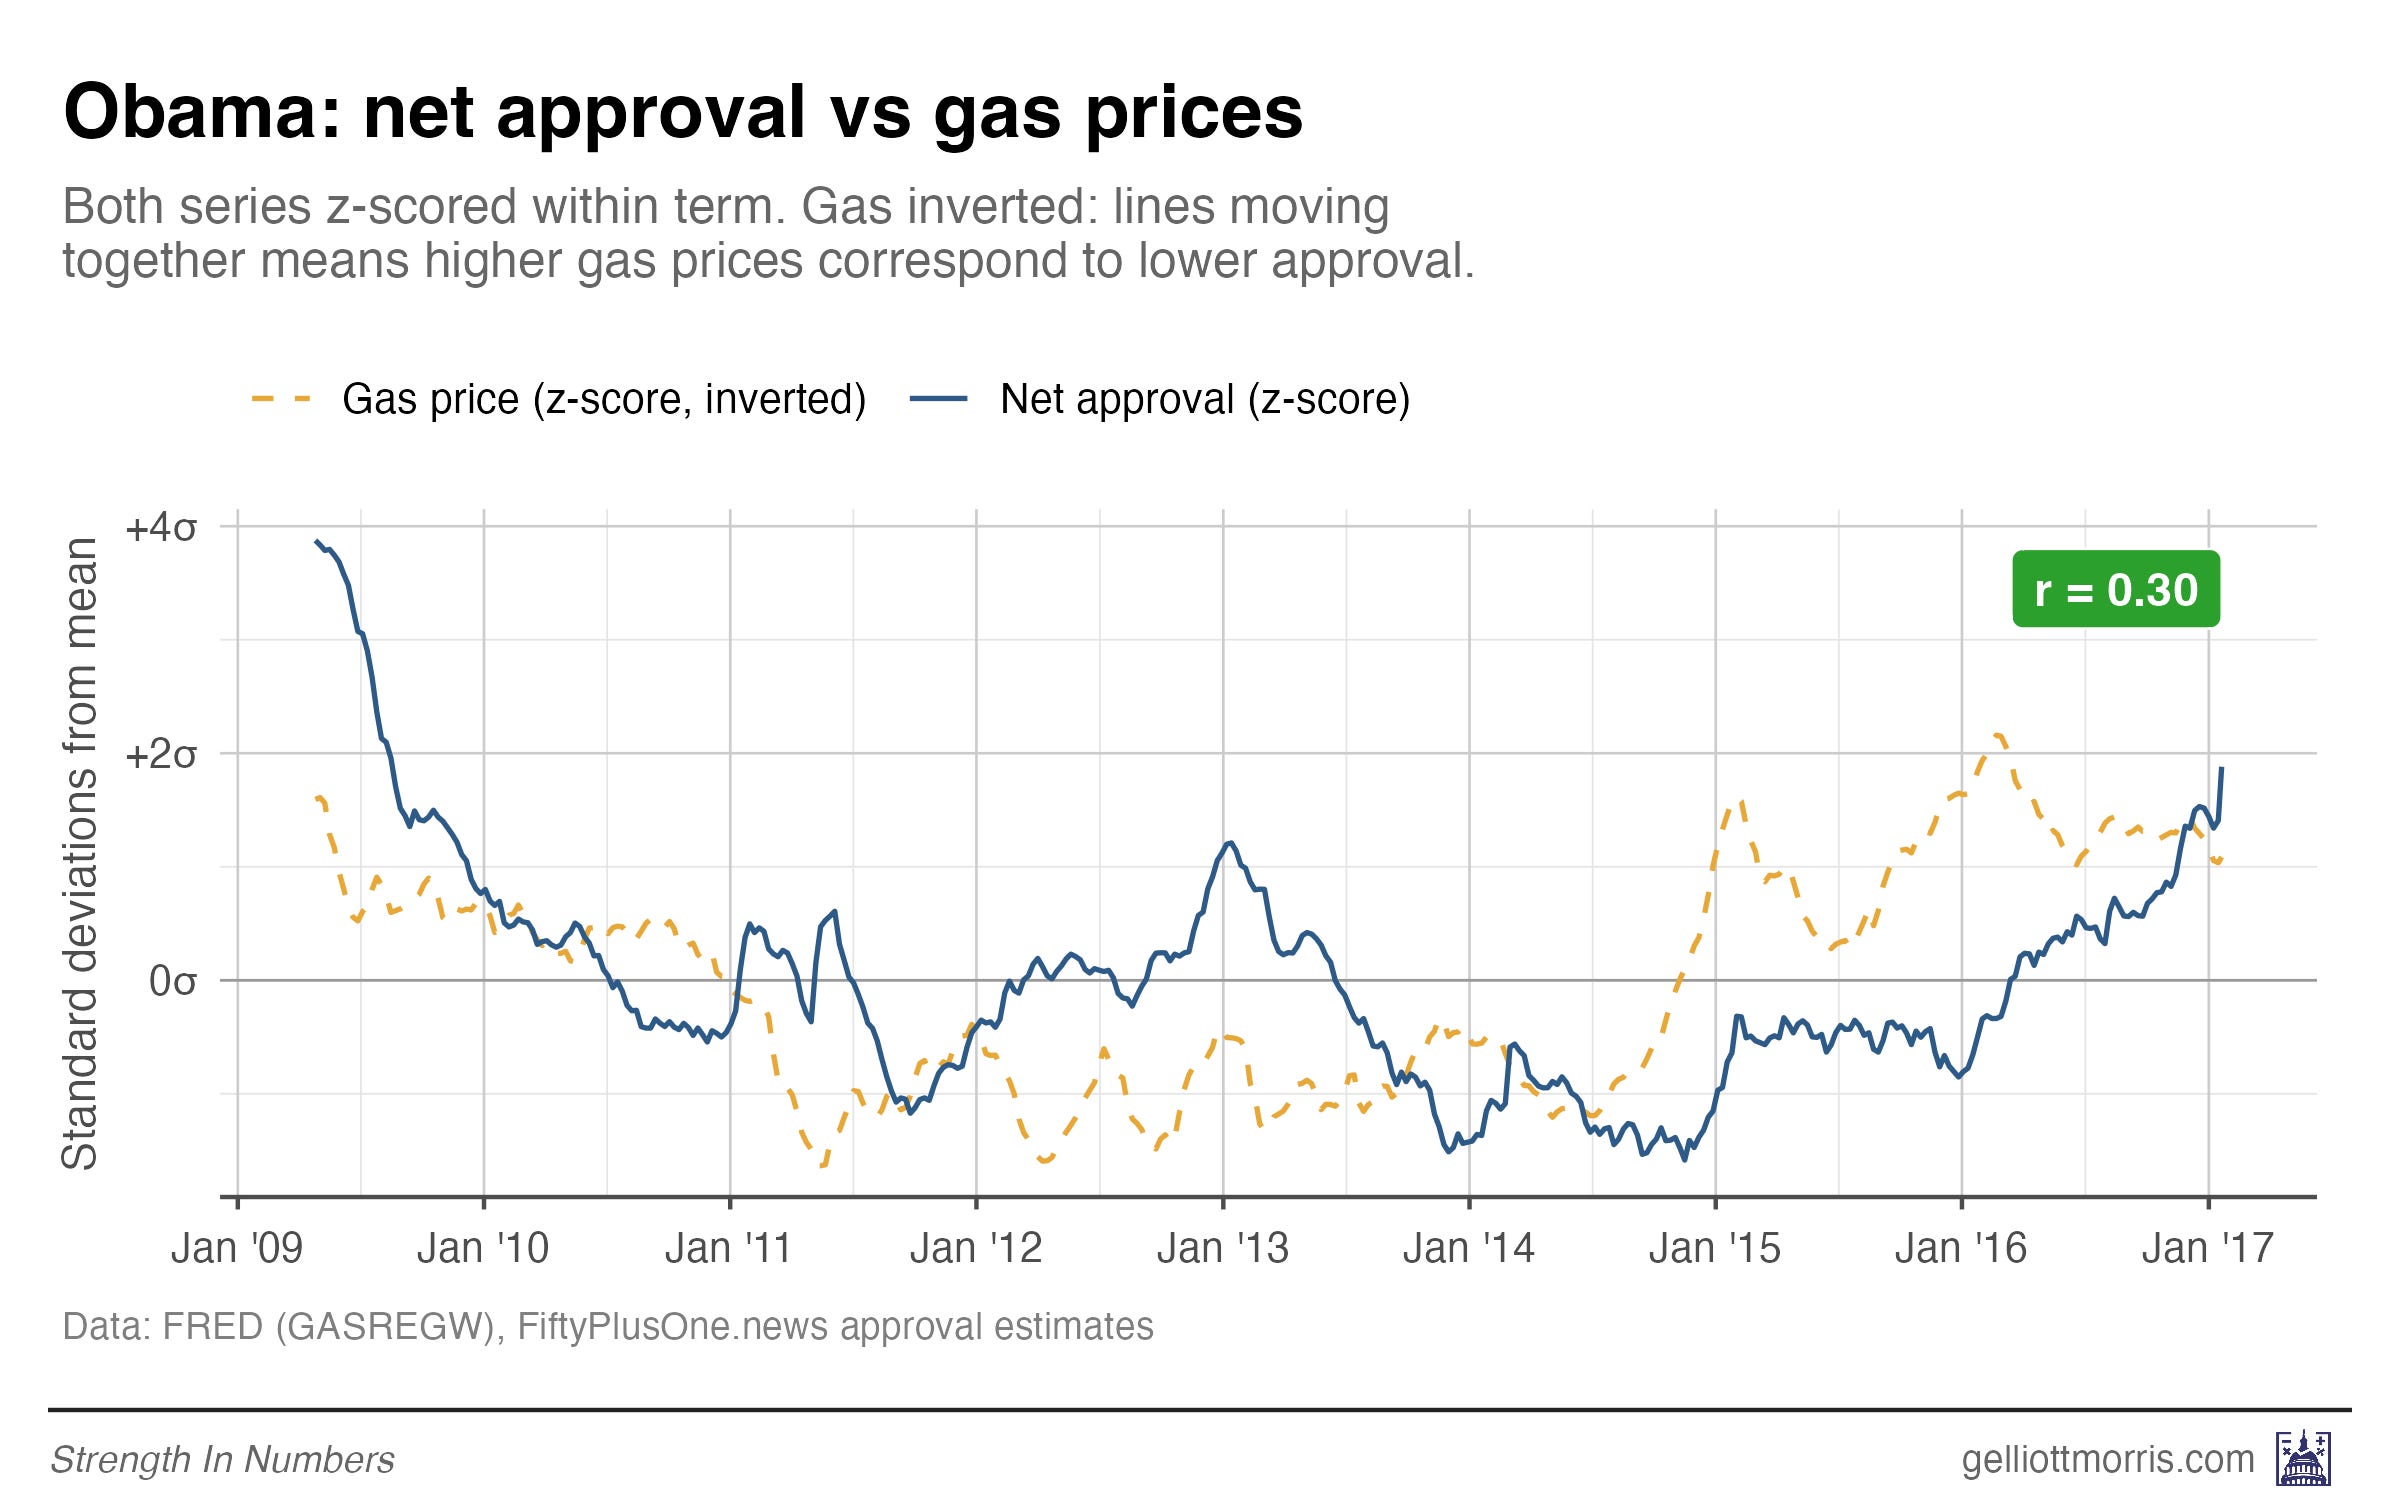
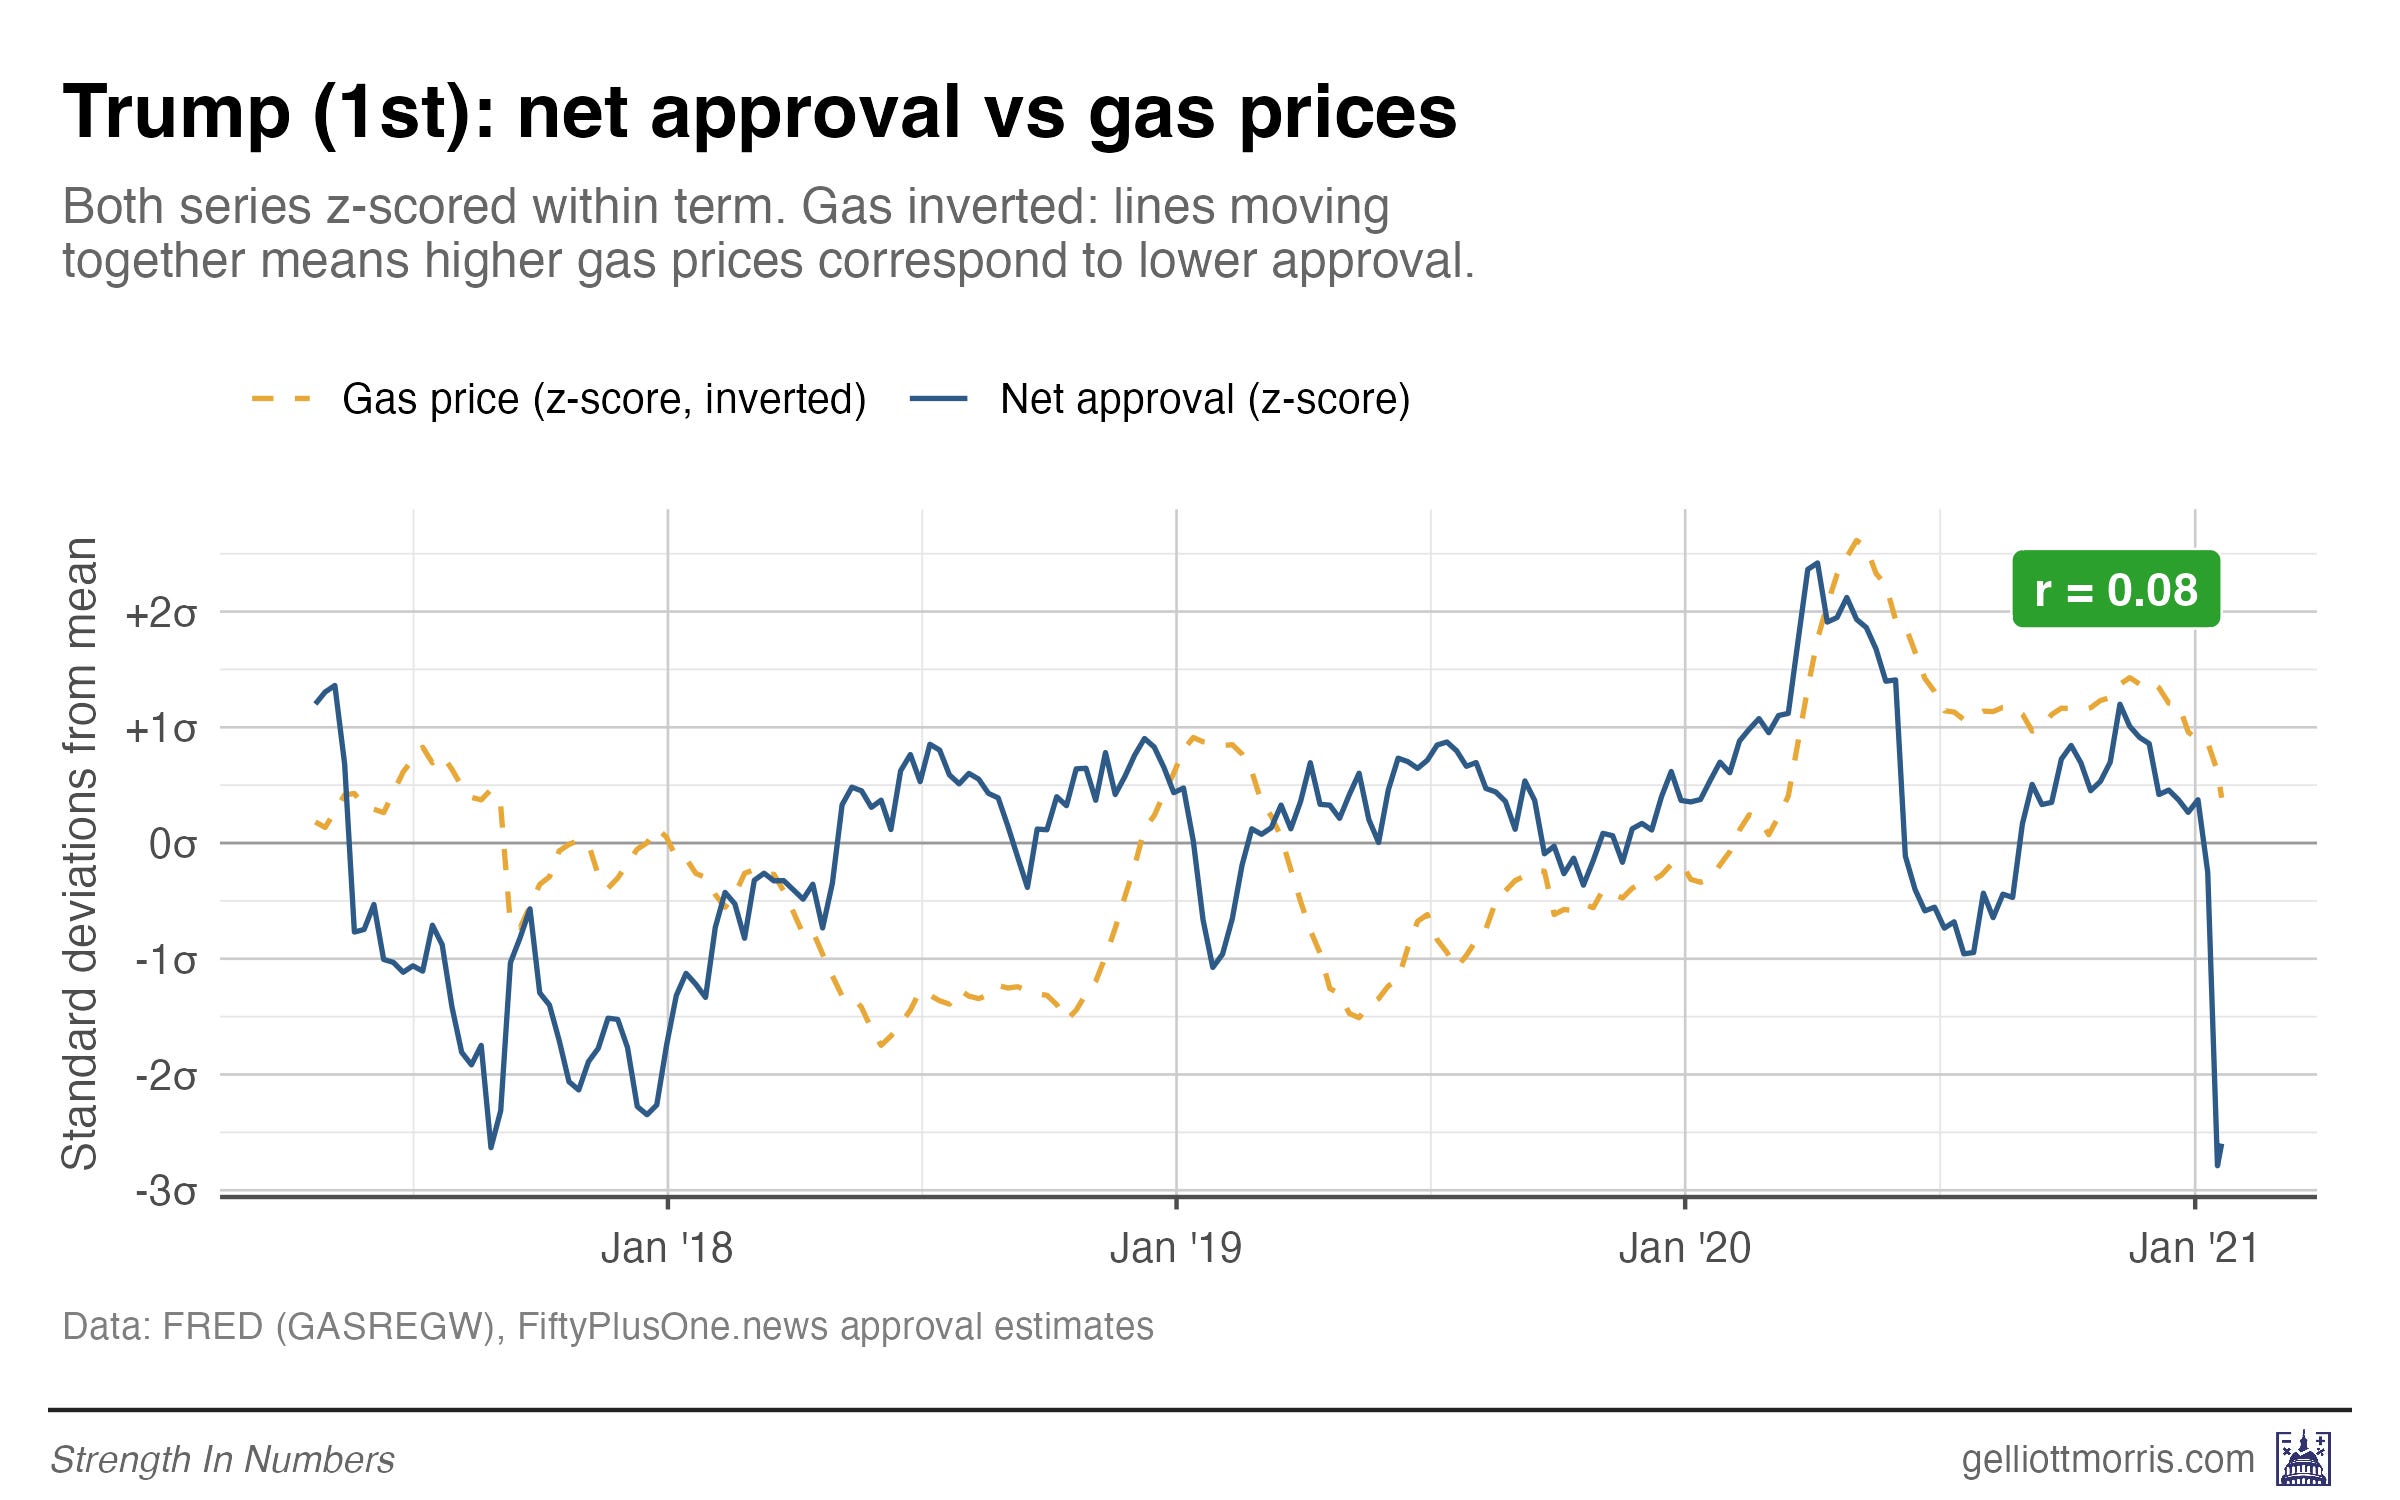
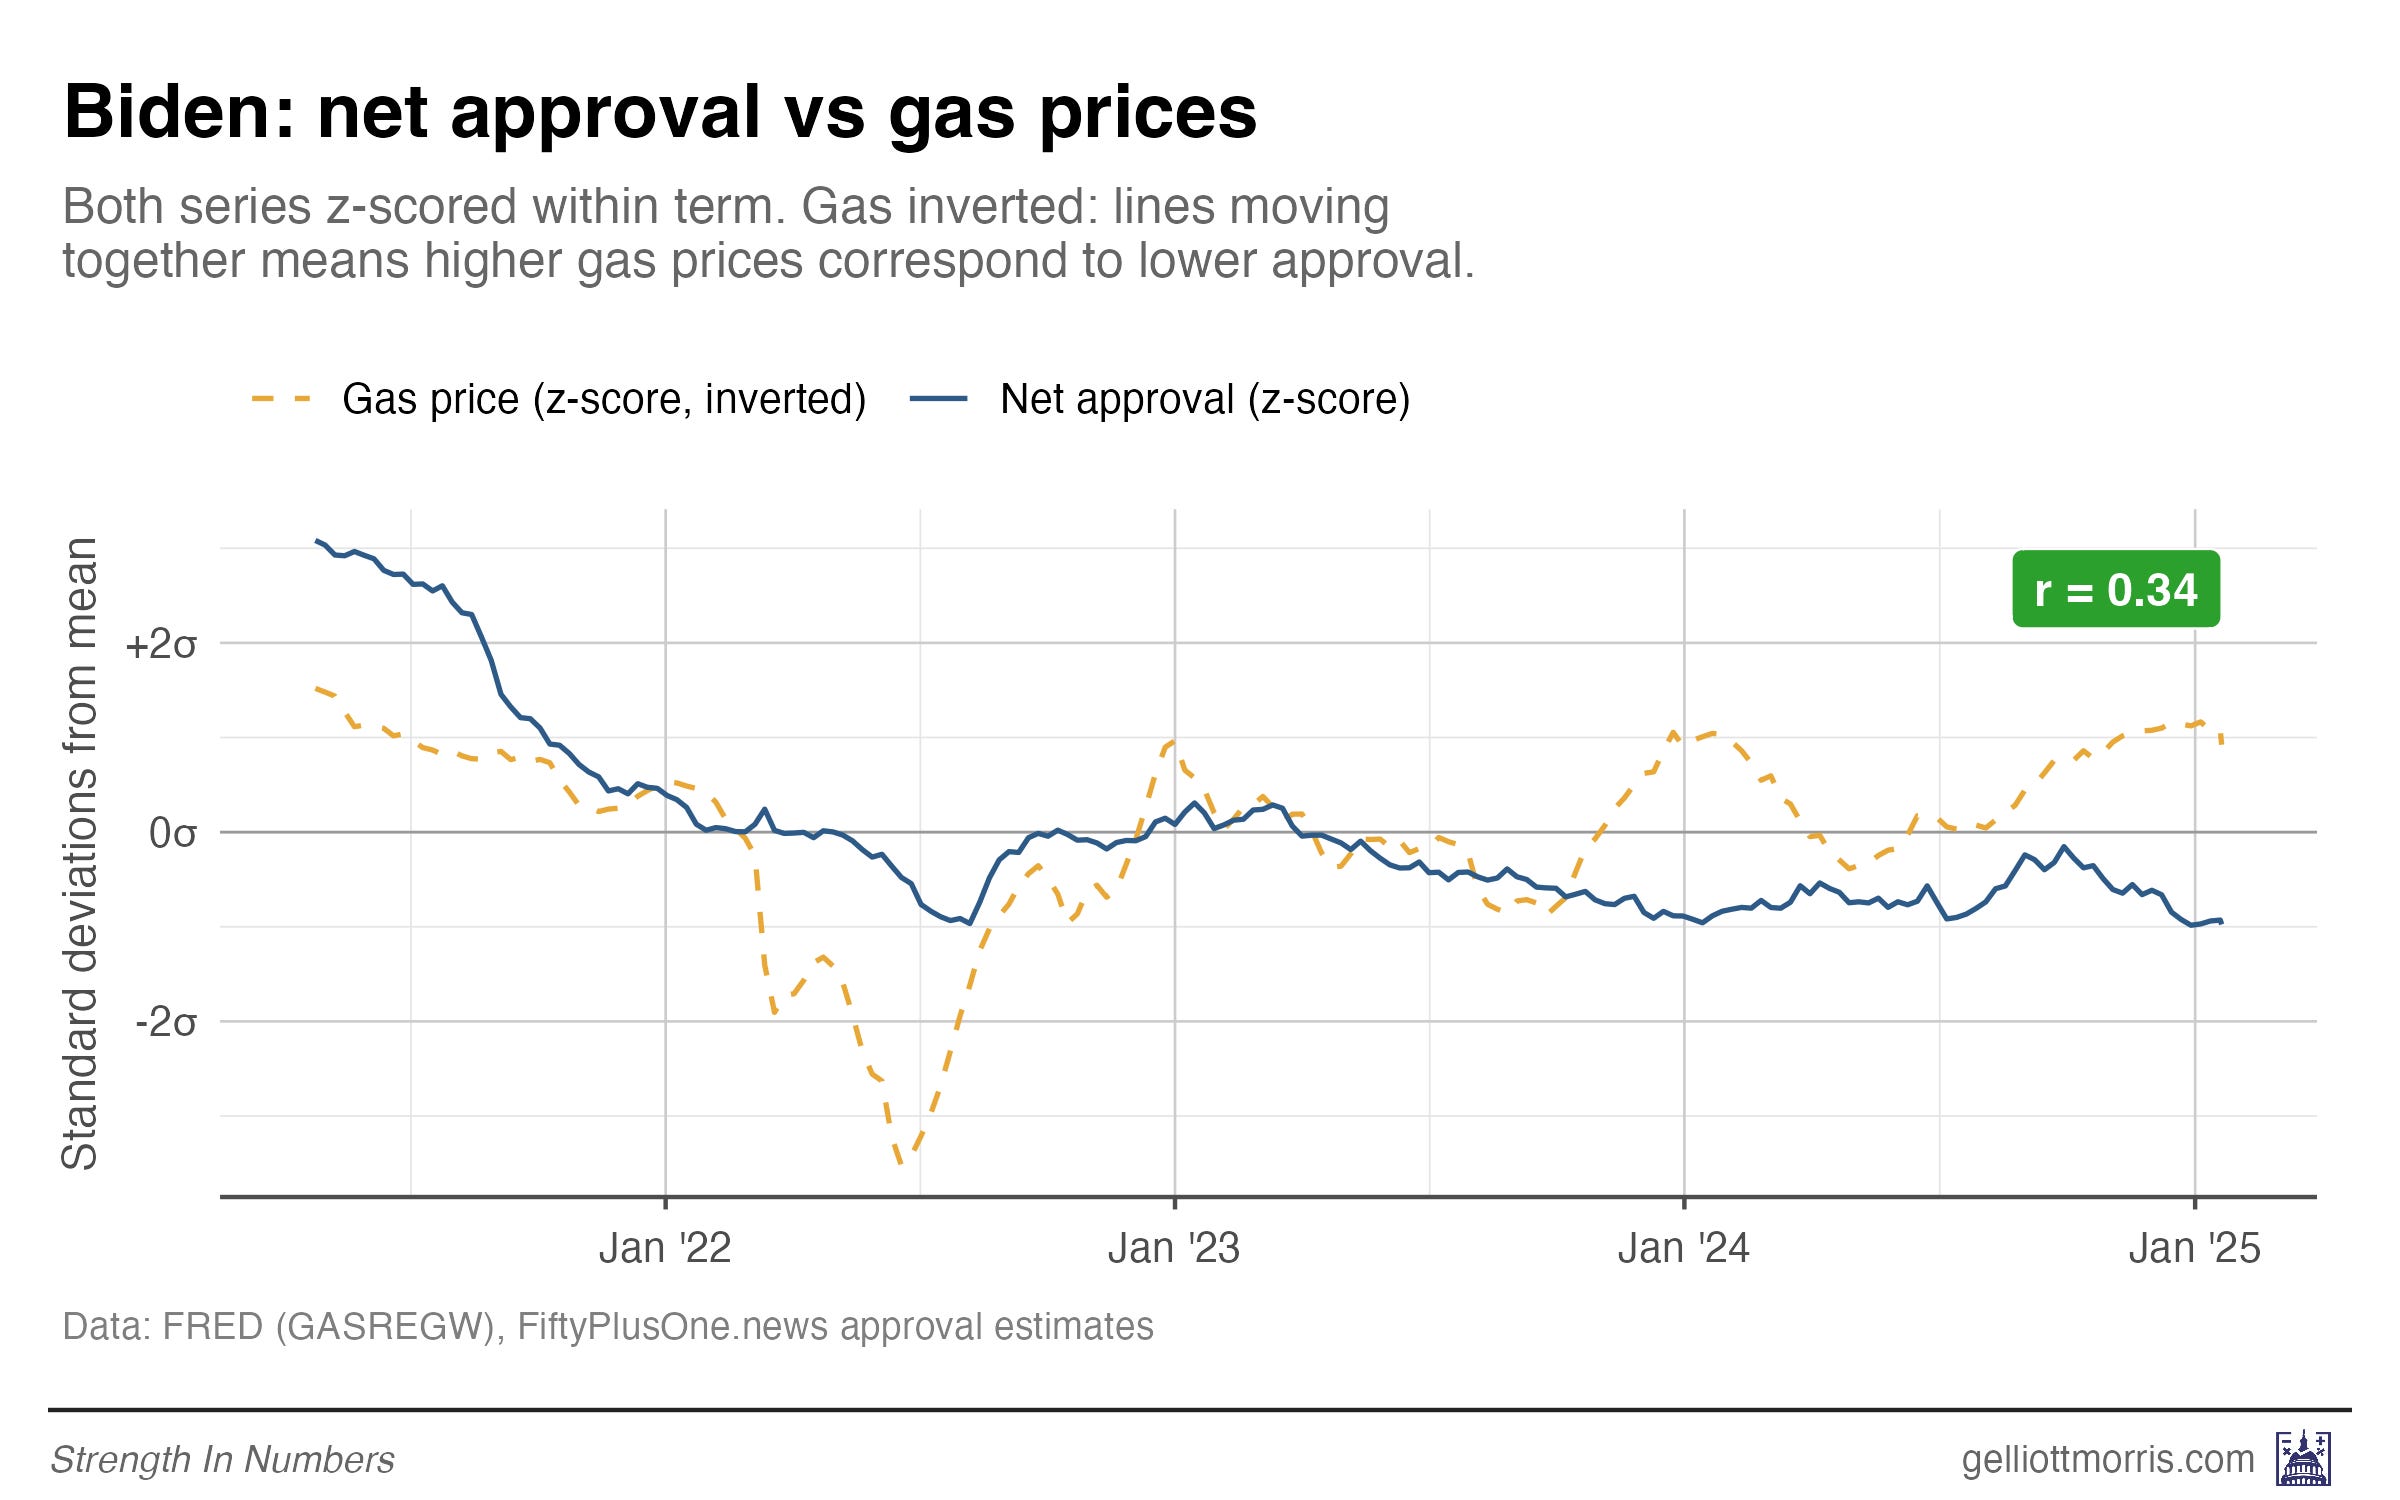
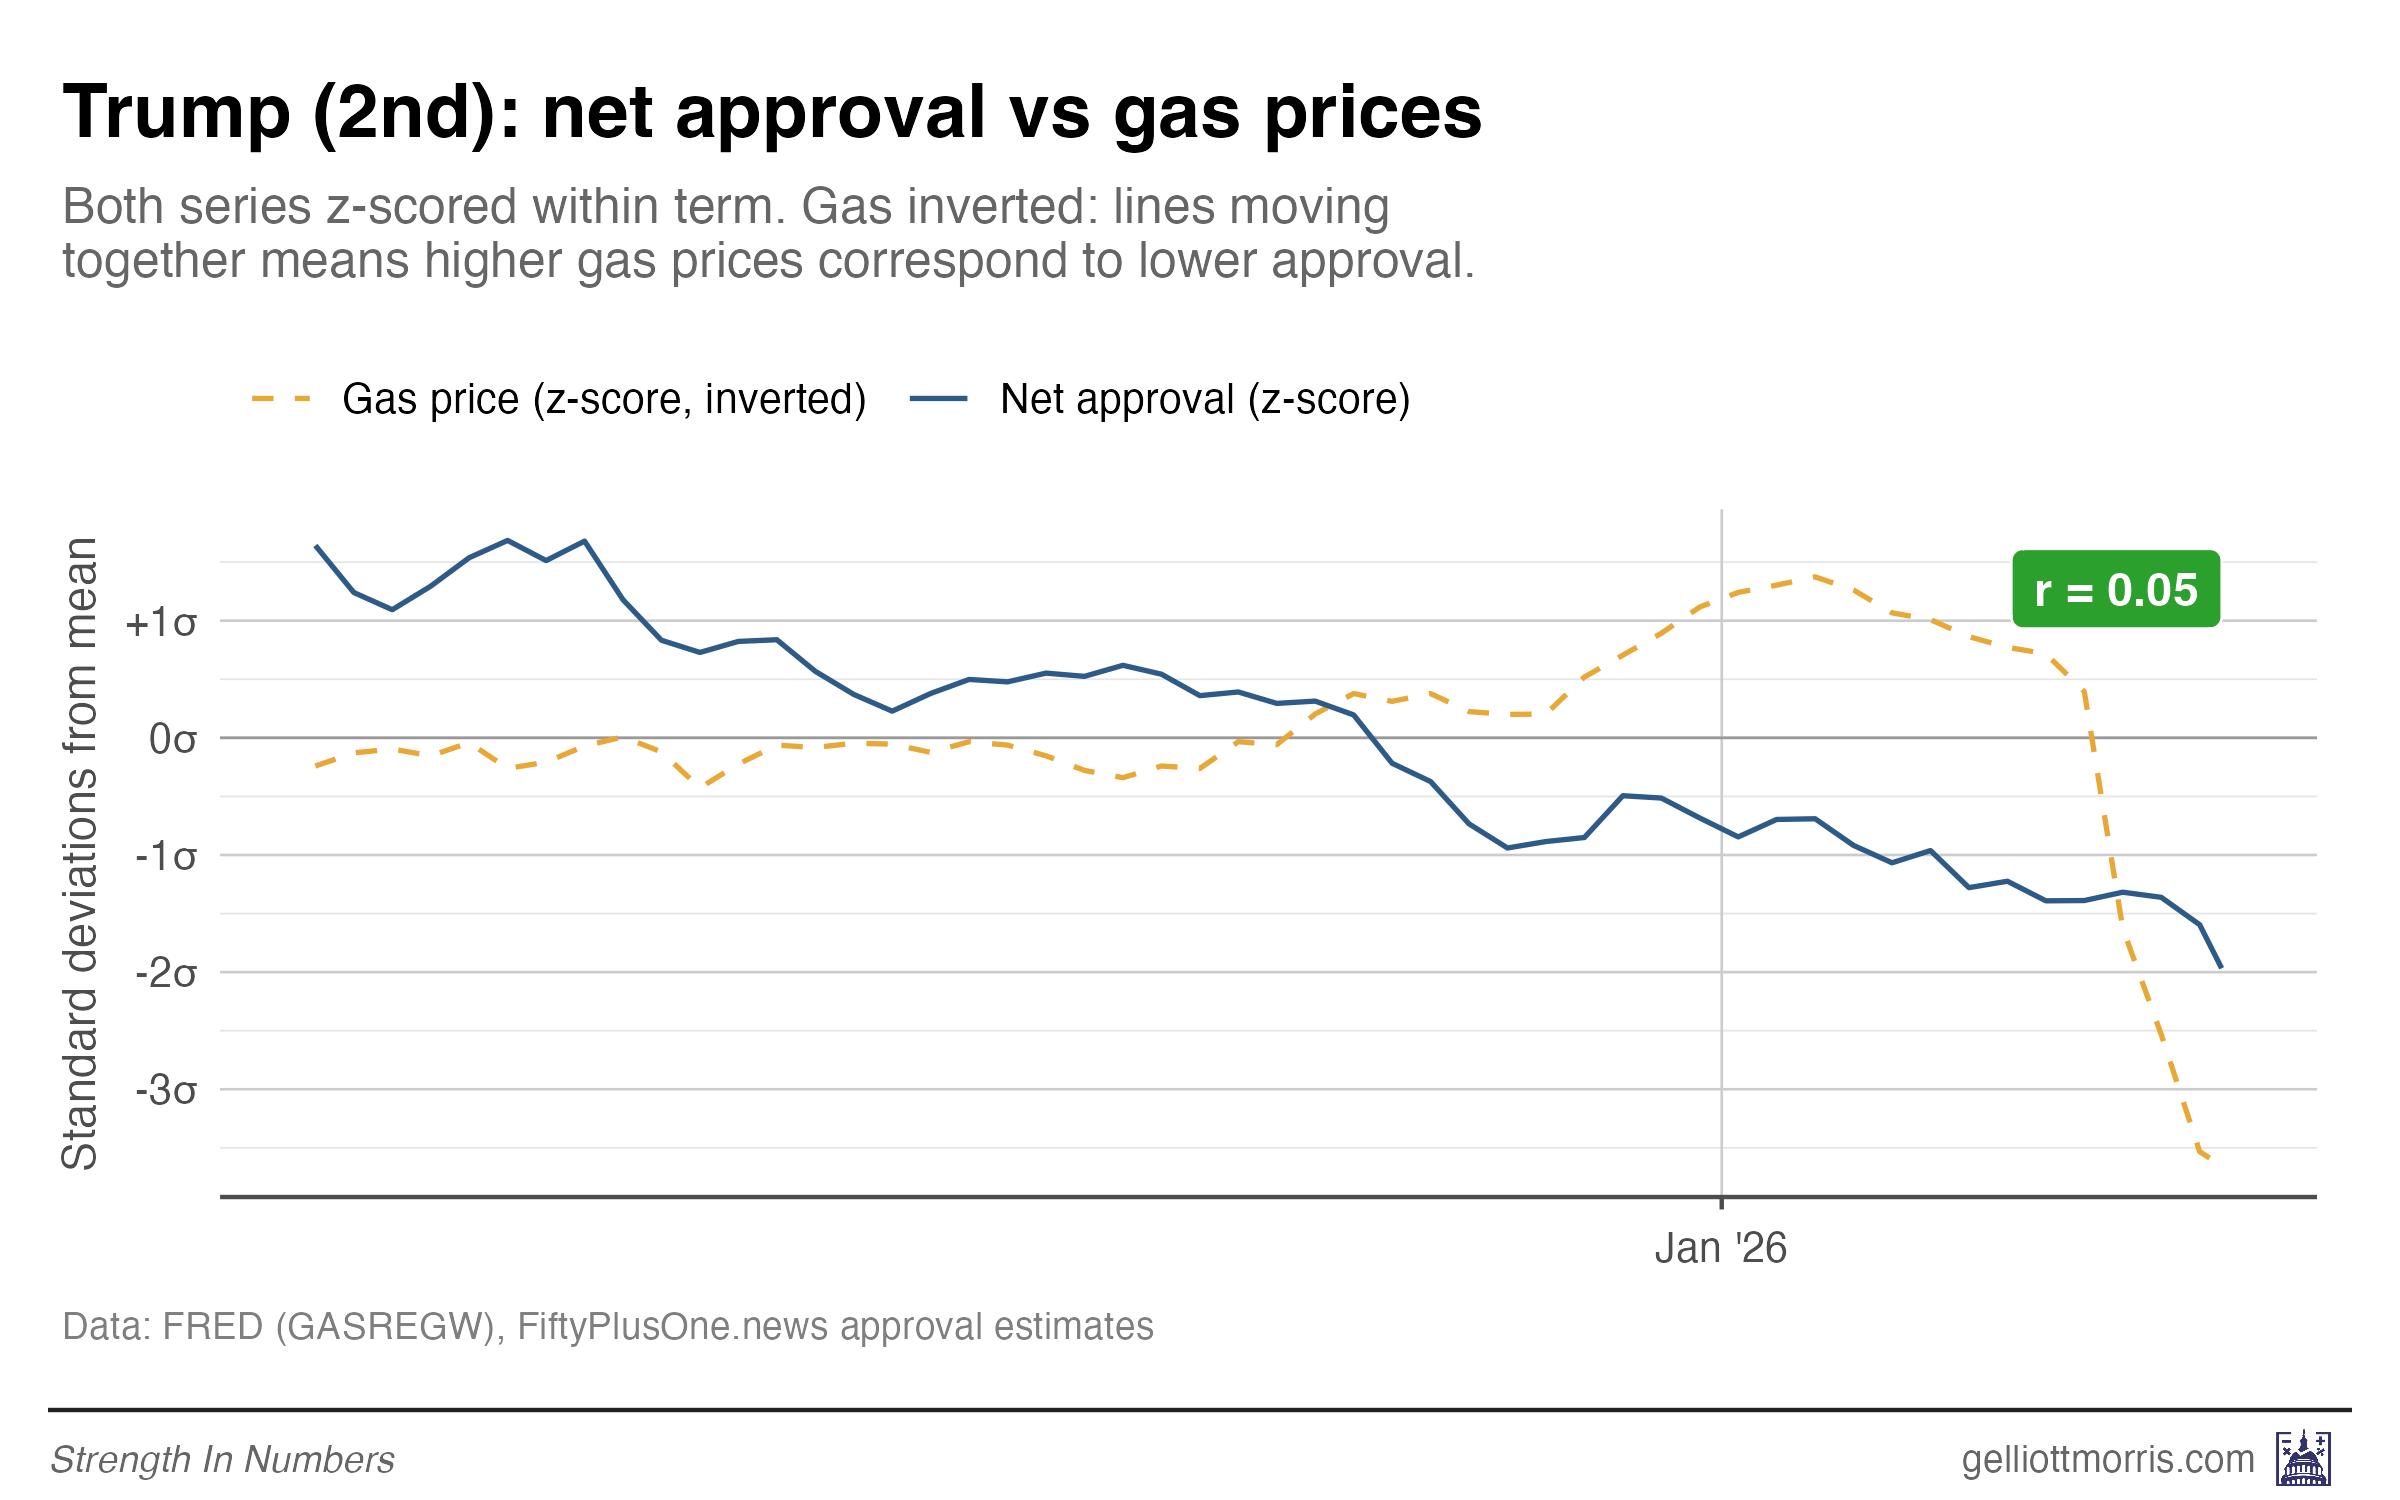
Under Obama, gas price spikes in 2011–12 lined up neatly with approval dips. Under Biden, the 2022 gas price surge tracked almost perfectly with his collapse in the polls. But Trump’s approval has not been as responsive to prices at the pump. That’s partly because gas was pretty cheap for most of his first term, so we don’t have a whole lot of examples of high gas prices under Trump. We are currently pushing the boundaries on that, however.
Here’s the same data from the four charts above, but as a scatter plot. Gas prices (z-scored within each presidency) are on the x-axis, while net approval is on the y-axis. Each dot is one day.
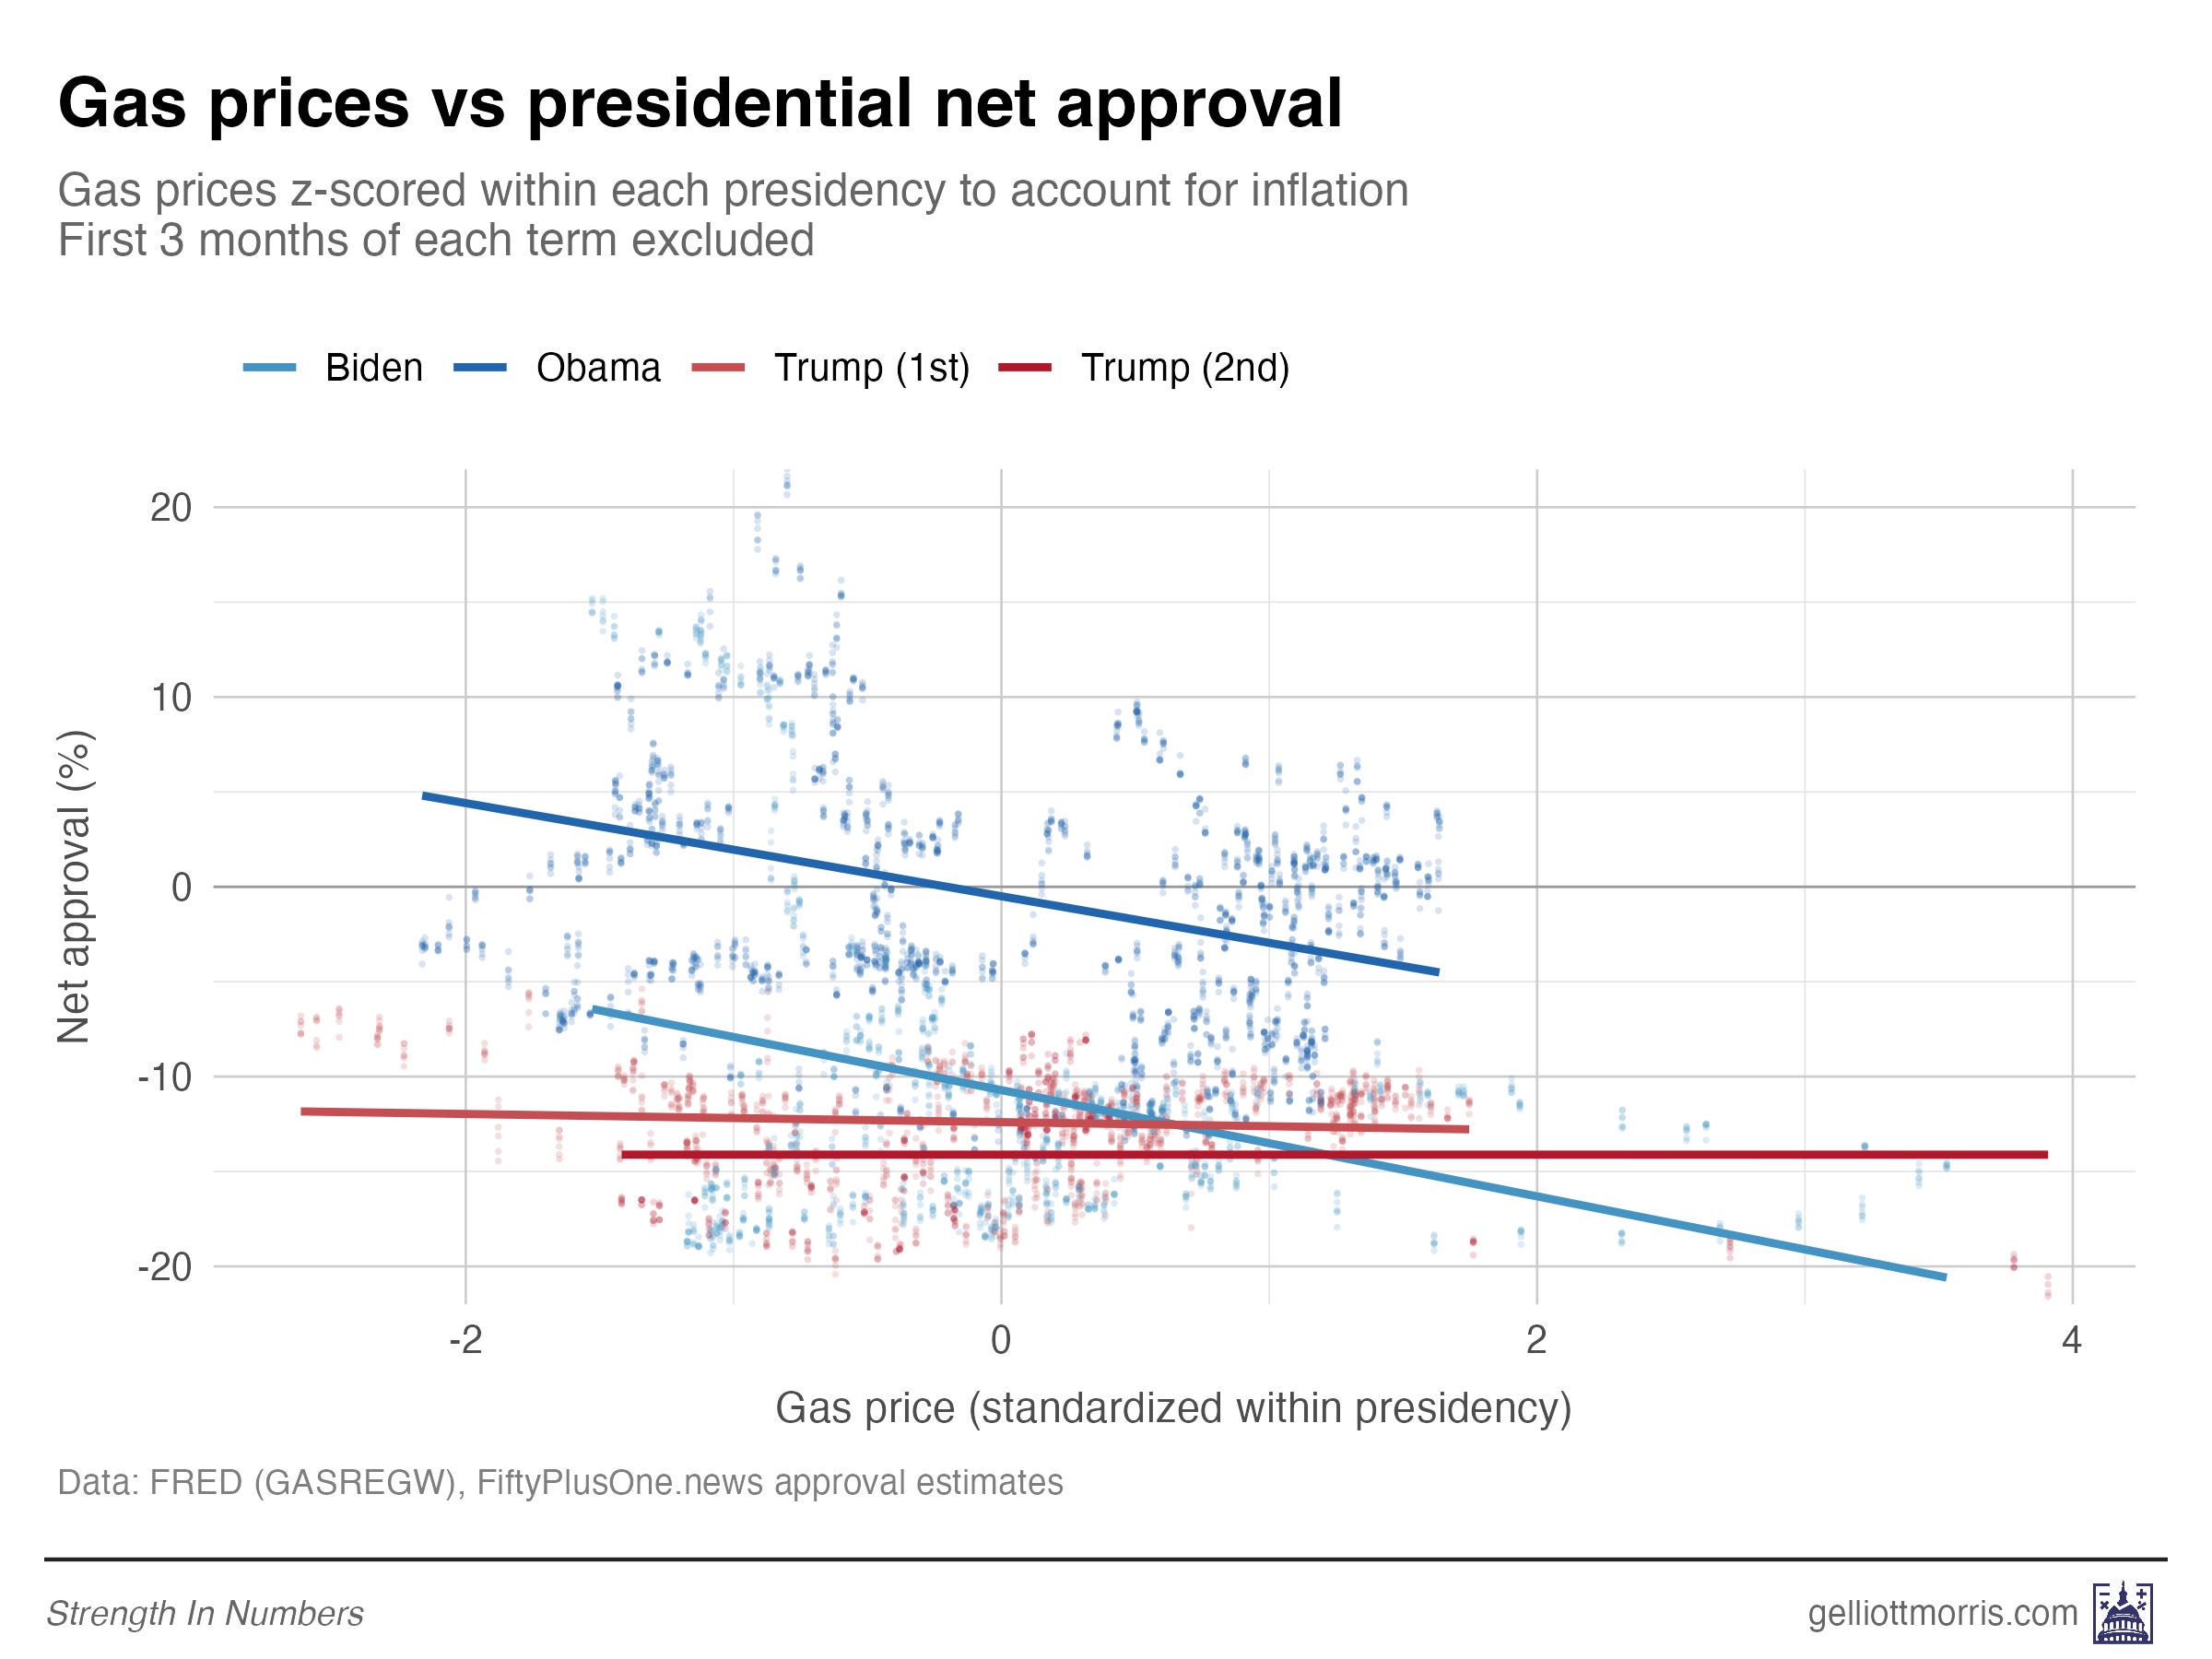
Obama and Biden both show clear negative slopes — higher gas prices, lower approval. But both Trump lines are basically flat. Gas prices explain almost none of the variation in his approval. Again, that’s try historically, but might not remain true in the future!
Month-to-month changes do correlate across presidents, loosely
Finally, let’s take a look at monthly changes rather than levels. Each dot here is one month: the x-axis is the percent change in gas prices over the last month, while the y-axis is the change in net approval (in percentage points) over the same time period.
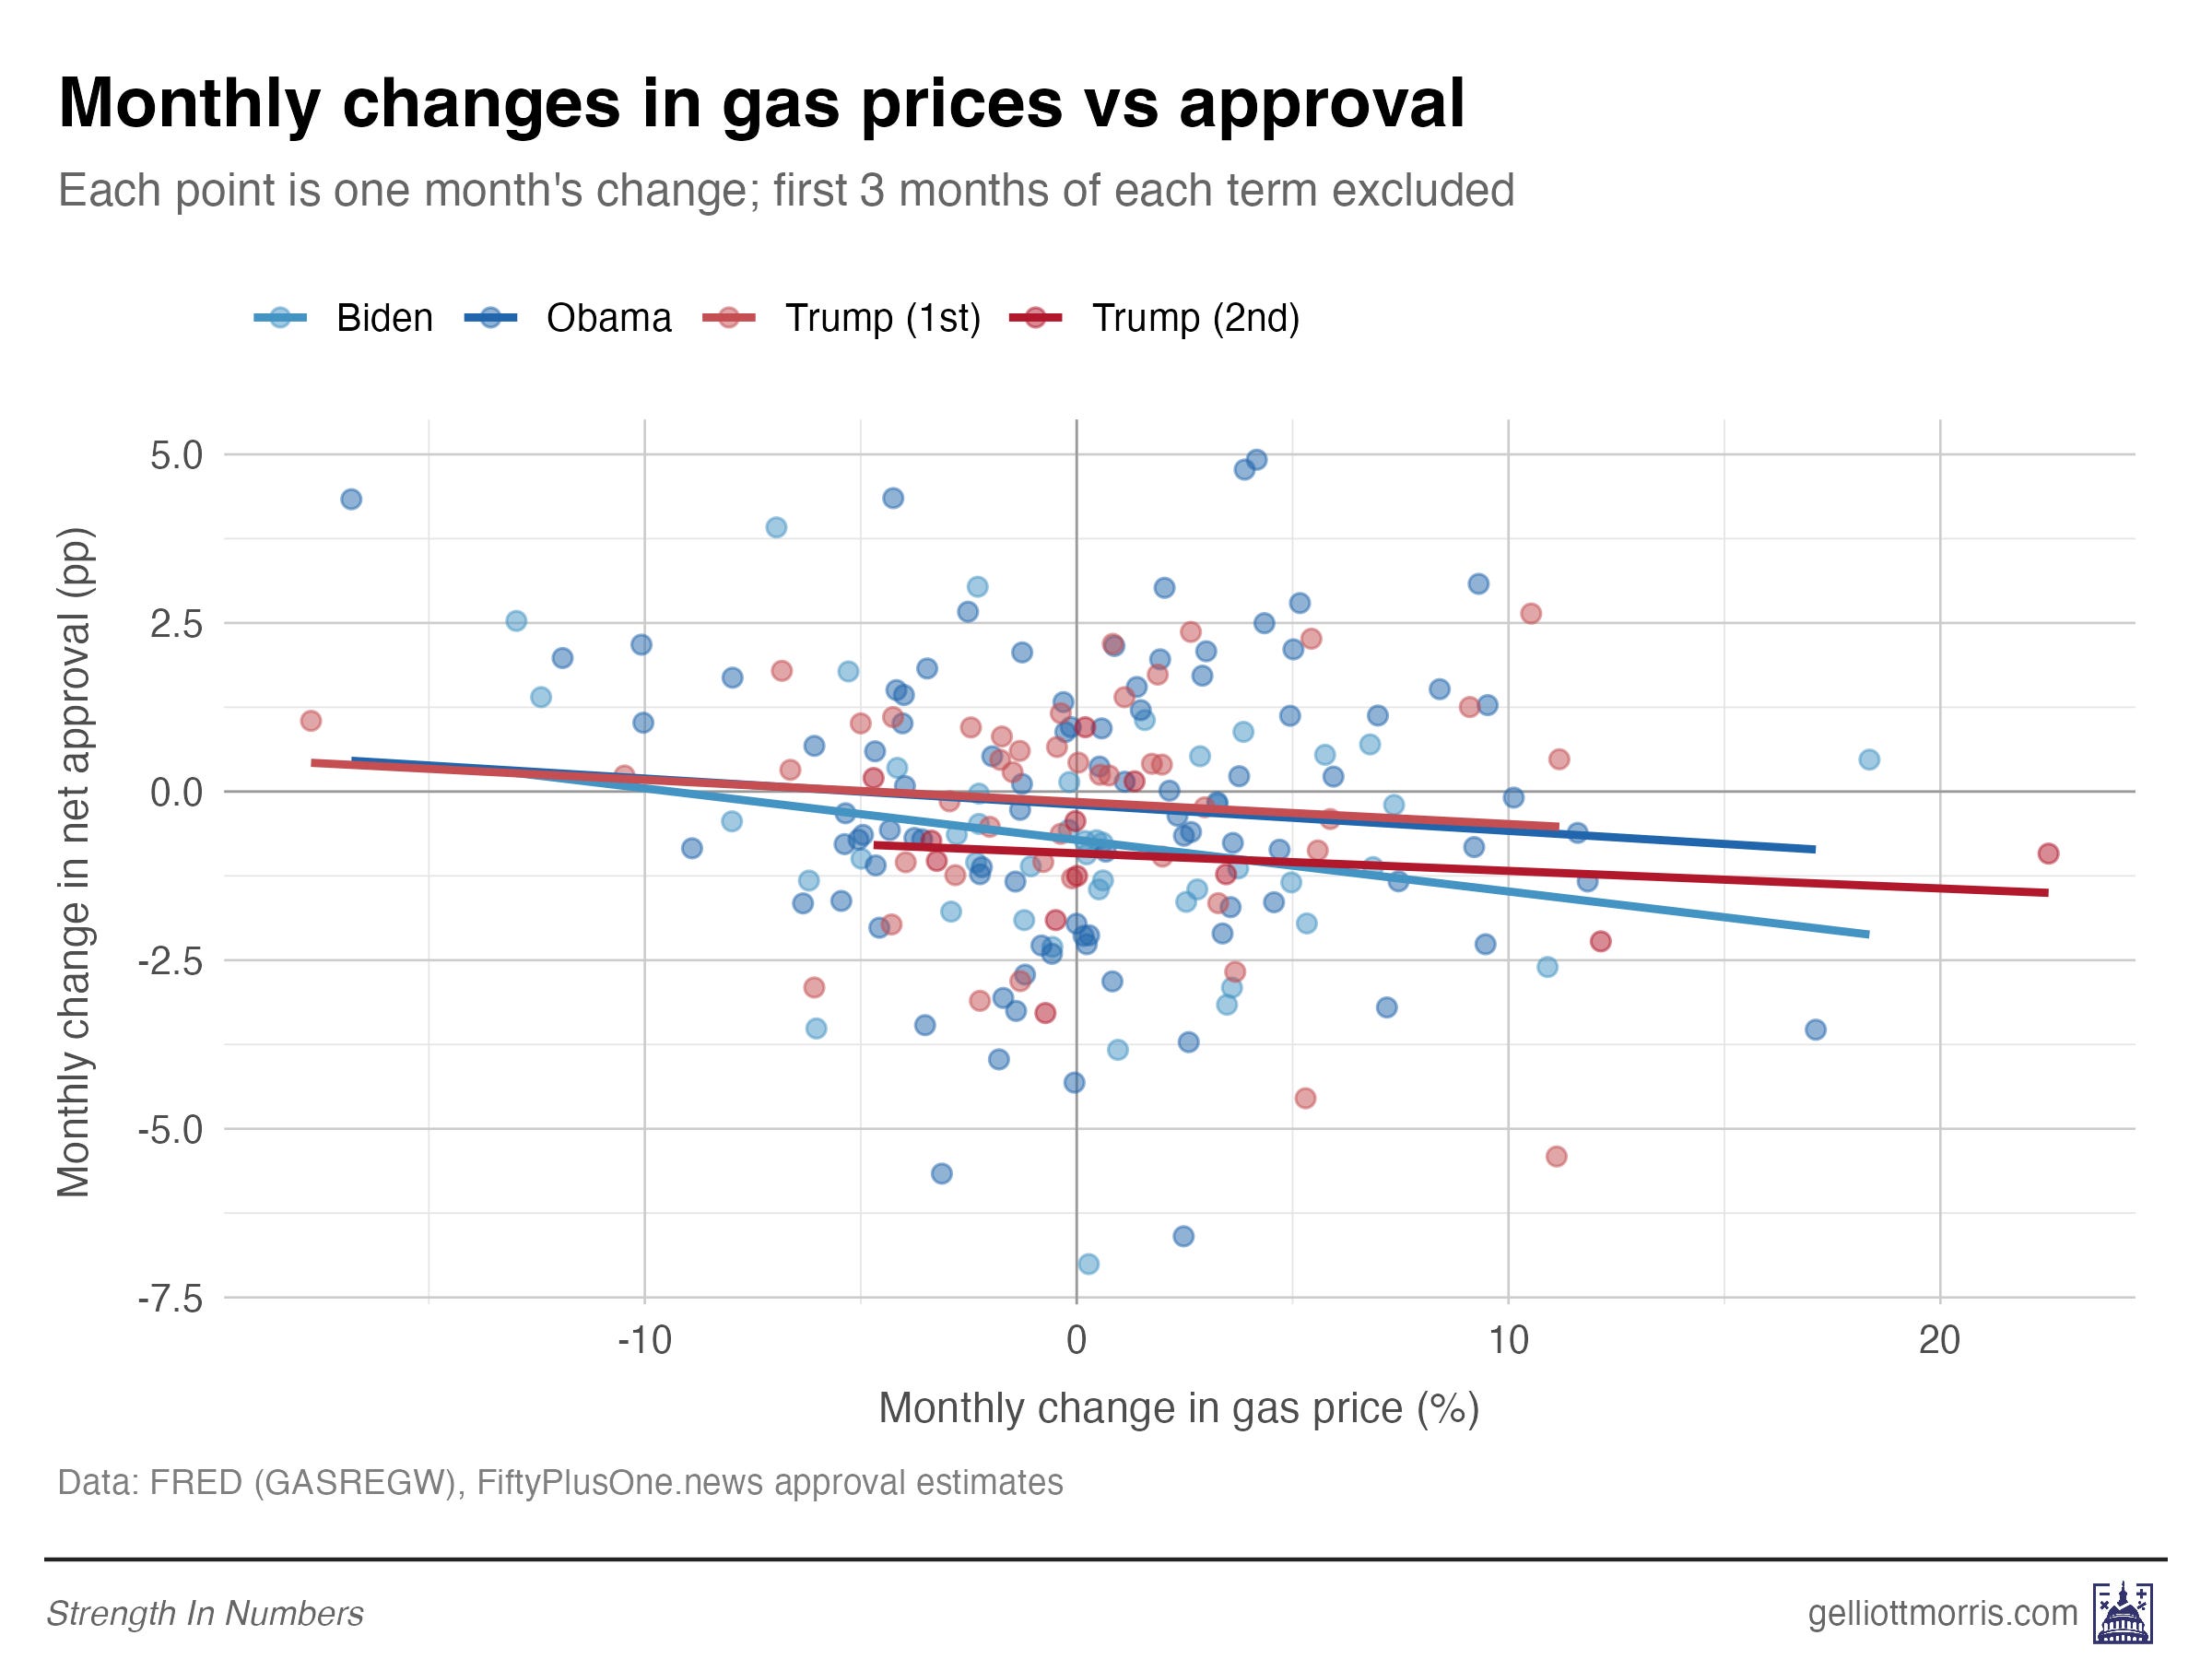
Now, we see a modest negative relationship across all four presidents — months where gas prices spike tend to coincide with approval dips. But it’s noisy, and the effect is small. A 10% monthly jump in gas prices is associated with roughly a 1-point drop in net approval. That’s small potatoes in the grand scheme of things.
What this means for Trump’s approval
So will cheap gas “save” Trump? He might get a small bounce from lower gas prices. But the recent price shock is only one event that looks correlated with the president’s falling ratings. Fixing cheap gas doesn’t fix all the other components of his unpopularity.
(And “save” isn’t really the right framing, anyway — it’s just a convenient one that enables me to make a bunch of fun charts!)
The historical record shows that gas prices matter for presidential approval, but (a) less so for Trump and (b) less for other big events. Obama and Biden were both more sensitive to pump prices than Trump was in his first term. I could push this analysis further back in time, but then we risk overestimating change in approval today (which is lower because of polarization).
Trump’s approval rating in term two has mostly been driven by tariffs, backlash to his deportations policy, the Epstein controversy, the war in Iran, and a general sense that he’s not focused on the issues voters care about. Cheap gas would certainly not hurt his ability to win back voters, but it’s not going to reverse a 20-point net negative approval rating that has been falling for over a year straight.
Next week, I’ll take a look at how presidential approval ratings over the last decade have responded to media sentiment. Are voters responding to prices, or news coverage of prices?

This post was free for everyone. Paid subscribers get my Tuesday Deep Dive, exclusive polling data, and access to every chart and model I produce. If this kind of independent, data-driven analysis is useful to you, join a community of like-minded readers who think there is strength in numbers.


I think that lower gas prices might improve Trump's approval rating, at least temporarily. Unfortunately, he is inveterately determined to set fire to bags of dog poop on everyone's front porch, so that any redeeming factors of his kingship are swiftly enveloped in flames.
He can't help himself. He's an agent of chaos, and people are getting weary of chaos. They want stability and perhaps even a sense of optimism. Trump cannot deliver either.
Trumps presidencies have been so chaotic every single day. Seems like gas prices get significantly muted by all the noise of the rest of the chaos. This in contrast to other administrations, where we didn’t wake up every single day wondering what horrors awaited us that day…so gas price changes may have stood alone as significant in news reporting. It’s significant now too… but so is an endless list of cruelty and greed Americans can barely catch their breaths from.