



This is the inaugural post for the Strength In Numbers Data Lab, a new section of this publication for sharing extra charts, deep polling nerdery, and writing about methods work etc. for the devoted reader of this newsletter. If you download the crosstabs of our monthly Strength In Numbers/Verasight poll, this one’s for you.
The idea for this section is simply to publish more, less polished, and more technical content, both because I know there are many people who are hungry for more content and because there’s stuff I want to keep off the full email list. See, a lot of the analysis I do behind this scenes never makes it into a proper article suited for 70,000+ readers, whether that’s because of the editorial calendar, it’s just one chart, or a reader asks a question that deserves a real answer but is too niche for most subscribers. I tend to file these extras away or send them off as emails where they die in private. That’s a big no-no from a blogging point of view (Always Be Posting) so from now on I’m going to be sharing that work here, outside the Strength In Numbers home vertical (and your inbox) but still public for the real sickos.
Emails for posts on the Data Lab vertical are off by default, but you can easily toggle them on here.
Like the main site, most Data Lab posts will be free, but I’ll reserve the occasional longer article for paying subscribers as a bonus for making all of this possible. Upgrade your subscription for full access.
Finally, as the staff here at Strength In Numbers continues to grow, I’m hoping the Data Lab will also be home to contributed musings from our survey research assistants and other polling professionals mining SIN data for insights. If that’s the type of thing that interests you, email me.
Short programming note: I’m coming back from paternity leave in two weeks, on July 27, when Strength In Numbers will return to full editorial strength and I’ll have the results of our new July poll to share. David and I return for our first summer podcast/Substack live show that Thursday, July 30. Get signed up so you don’t miss out!
With all that out of the way, let’s dive in:
What’s up with people who disapprove of Trump but don’t vote Democratic?
After my May piece on cross-pressured voters, a reader named Laurence asked on the SIN Discord for me to run some special numbers on our polling microdata. That piece was written in response to some bad punditry about Democrats’ midterm polling — the broader point I was making was that you shouldn’t expect everyone who disapproves of Trump to vote for Democrats for Congress, and grading them against that expectation was unfair/misleading
Laurance wanted me to take the Trump disapprovers who still aren’t voting Democratic and carry at least one Republican “anchor” — a 2024 Trump ballot, Republican party ID or lean, or conservative self-ID — and split them up by which anchors they carry. How does each combination vote on the generic ballot? In other words, don’t just count the anchors — ask which ones actually hold.
I recommend you read the piece linked above to get a better idea of how this works, but basically what we’re doing is looking at the subset of people in our poll who say they disapprove of Trump but aren’t voting Democrat and trying to figure out why — and, importantly, how many of those voters Democrats might actually win.
To answer Laurence’s question, I stacked all six of our Strength In Numbers/Verasight monthly polls from January through June 2026 into one big mega poll. This gives us 8,818 registered voters and enough sample to slice the disapprovers thinly.
And here’s where the microdata is really powerful (and why I think what we’re doing here at SIN is so cool). If you sort voters by Trump approval and generic-ballot vote and then count the GOP anchors in each cell, we find that among disapprovers who are undecided, 40% carry one or more GOP anchors. Among disapprovers who say they’ll vote GOP, 90% have Republican anchors. That’s the group I called “closet Republicans” in my May piece. There are a lot of disapproves who look more like Trump supporters/Republicans than Democratic voters, all else being equal.
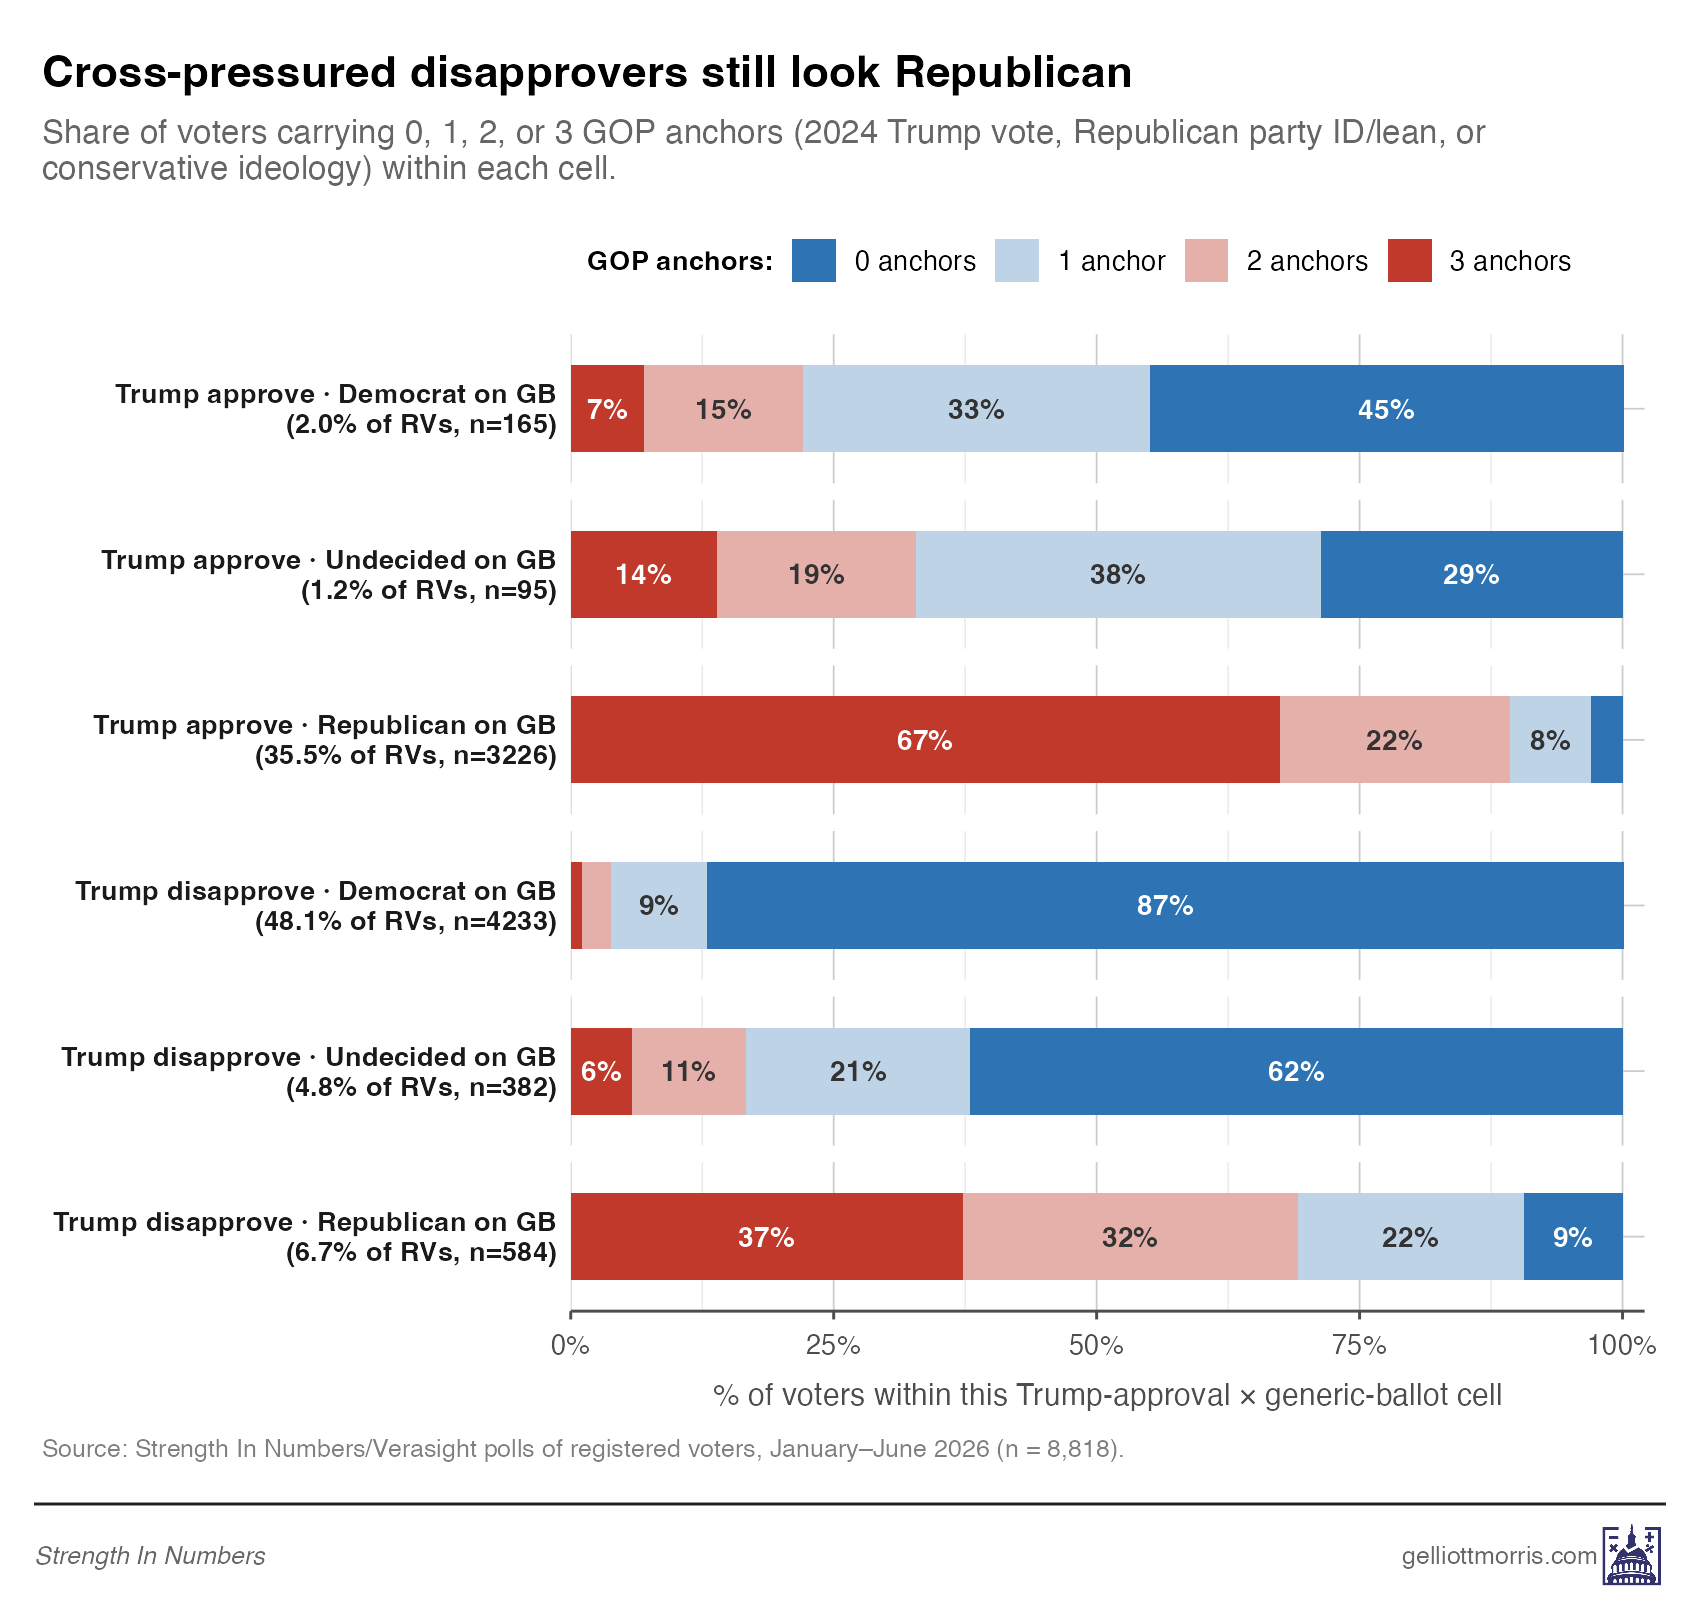
Now to Laurence’s actual question: here’s the generic ballot for each anchor combination, split by Trump approval:
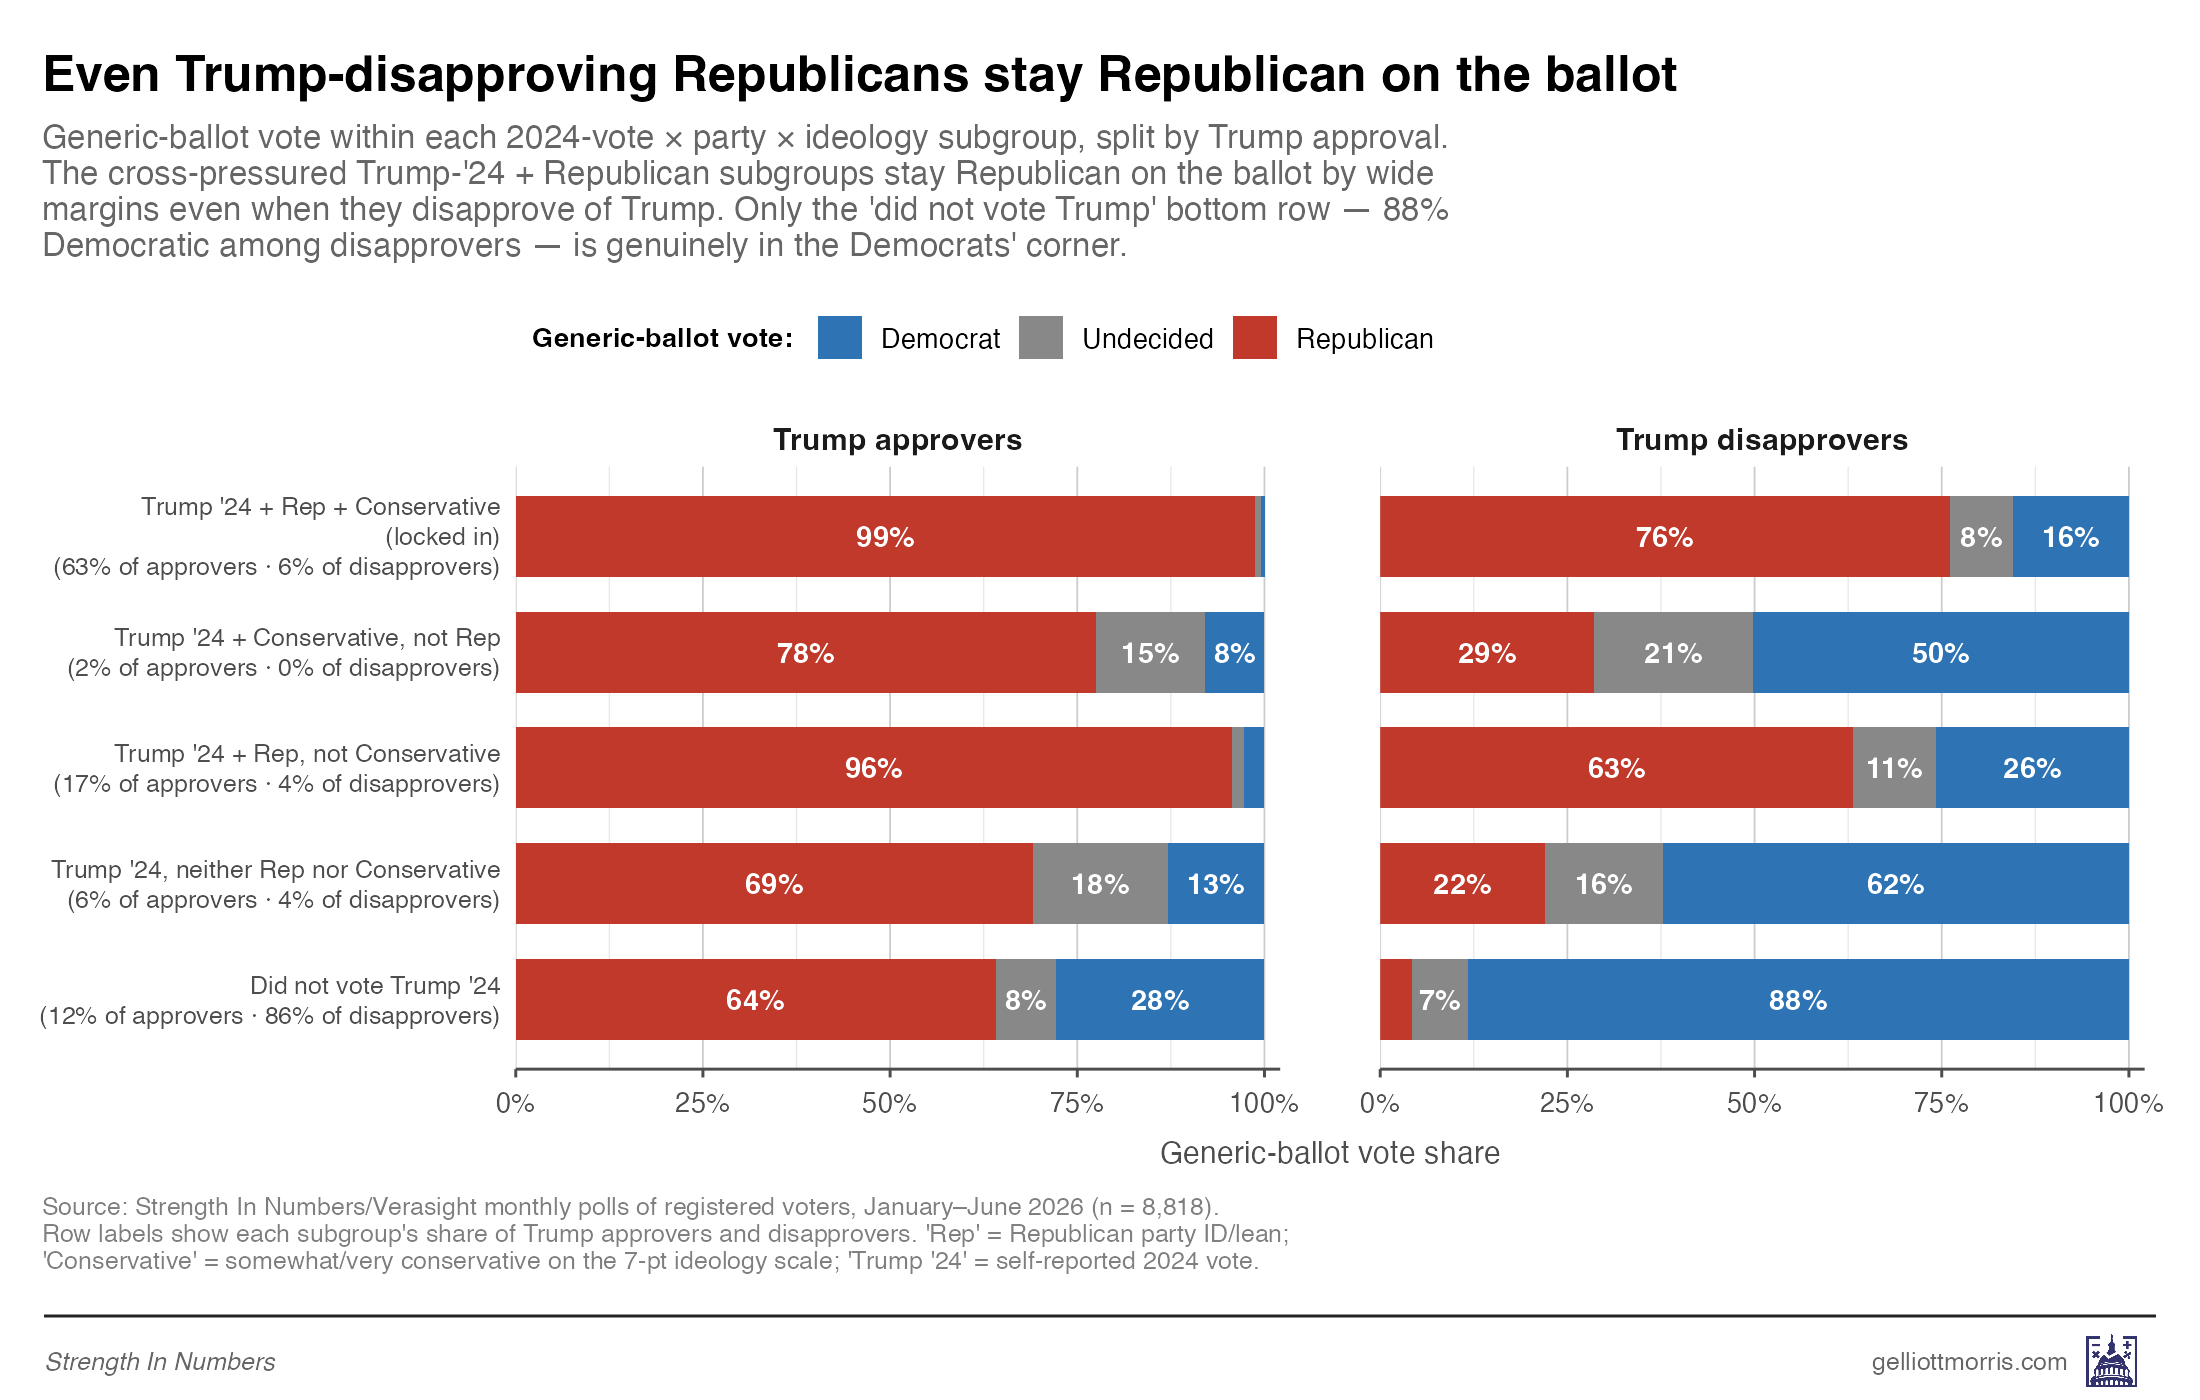
This chart is great, even if it takes a while to grasp, because now we can see how your anchors condition your behavioral response to Trump’s presidency. Disapproving of Trump when you’re otherwise a solid Trump voter doesn’t mean you’ll become a Democratic voter in the midterms.
Here are the numbers: Voters carrying all three anchors (a Trump ‘24 ballot, Republican in party affiliation, and conservative self-ID) are still voting Republican 76% to 16, so disapproving of Trump barely dents them. Voters who pulled the lever for Trump in ‘24 and call themselves Republicans but not conservatives stay Republican too, at 63% to 26.
But drop the party label and everything changes. Disapprovers who voted for Trump in 2024 yet call themselves neither Republican nor conservative now go Democratic 62% to 22, an outright flip. The Trump-plus-conservative-but-not-Republican cell (second column, second row) points the same direction, at 50% Democratic to 29 Republican (though it contains just 24 respondents across six months of polling, so treat that finding as directional).
The pattern is hard to miss. The subgroups that keep “Republican” in their identity stay Republican by 37 points or more in the generic ballot even while disapproving of the man leading their party, — while both subgroups without it defect to the Democrats by a margin of 30-plus points. Party identity is doing a lot of work, even among Trump voters.
This is why I called this group “closet Republicans,” and I think that characterization stands.
The usual caveats apply: this analysis pools six monthly waves of data, so some of the underlying data may be out of date, and some of these breakdowns have only a few dozen voters in them so I wouldn’t take the exact estimates to the bank. But I think the broader point about GOP identity stands — and, more to the point of the Data Lab, I think I’ve answered Laurence’s question now!
If you have a question you want me to answer with our poll, leave it in the comments below or on the SIN Discord and it might become a future dispatch.


16% or 26% flippers is also enough to flip a number of elections, and that’s before gas prices and food prices suffer from additional inflation between now and the election.
They are cultists. Anyone who will put aside their values and morals just to stay with their party are cultists plain and simple.