

Pundits are wrong about the Democrats’ "missing" voters
In individual-level polling data, two-thirds of Trump disapprovers who aren’t backing Democrats on the generic ballot look like closeted Republicans, not swing voters waiting for a pivot on crime

Strength In Numbers is reader-funded. This piece is free to read, but it was not free to produce. Paid subscriptions keep the monthly Strength In Numbers/Verasight poll going, fund data infrastructure for bigger projects, and make analysis articles like this possible.
A month ago, I wrote about a puzzle that has dogged Democratic strategists all cycle: Donald Trump’s approval rating is 20+ points underwater among registered voters, but Democrats lead the generic ballot by only mid-single digits. Why aren’t the two numbers closer?
My answer in April was that the gap is partly mechanical (different populations) and partly a story about cross-pressured voters — people who disapprove of Trump but haven’t committed to voting Democratic. The generic ballot has historically tracked at roughly 40% of net disapproval, so the gap isn’t anomalous. But I left open the question of who exactly the cross-pressured voters are, and what it would take to move them.
The question got a fresh boost this week when Lakshya Jain, a software engineer and the pollster for the pro-liberalism digital magazine The Argument on Substack, published an article arguing that Democrats are blowing their advantage by refusing to repudiate prior positions on crime. He writes:
Democrats still have tangible policy misalignments with many voters who dislike Trump.
I’m not here to argue that large numbers of people are basing their votes on the death penalty. Rather, I think this is symptomatic of the Democratic problems at large on things like criminal justice, LGBTQ rights, and immigration. Democrats are not actually repudiating the stances that they originally took; they are instead simply aiming to avoid talking about the issue in hopes that people will just forget.
and finally
Strong midterms can be deceptive. Many of the voters who sit out 2026 will show up in 2028 (low-propensity voters tend to show up more in presidential years), and if Democrats are still fundamentally mismatched on important issues like crime, that risks a much greater chance of being reexposed.”
I doubt this is Jain’s full accounting of the difference between the two measures, and let me tell you why: As someone who has spent a long time writing poll articles in different contexts and publications, my hunch is that this one big piece is the result of his editors stapling two separate poll write-ups, one on the generic ballot and one on crime, together to save space on the story calendar. But unfortunately, the crime answer does not convincingly answer the question, for a simple reason: very few voters, including the Democratic holdout group, say crime is central to their vote.
Several readers asked me what I thought about Jain’s piece, so I figured I’d take the opportunity to give the underlying questions the full Strength In Numbers treatment. Looking at the four months of polls I’ve conducted with our polling partner, Verasight, this year, what can we learn about these supposed Democratic holdouts? Who have they voted for previously, and what party do they identify with? What issues do they actually care about? Which party do they trust more on those issues?
Are these Trump disapprovers who say they will vote Republican or don’t know how they’ll vote on the generic ballot a hidden reservoir of persuadable moderates? Or is it mostly Republican-aligned Trump disapprovers — voters who identify as conservatives, hold firm stances on social issues, and will vote Republican in the midterms regardless of what Democrats do?
This week’s Chart of the Week is: Two-thirds of the Trump disapprovers who aren’t supporting Democrats for the midterms are actually just closeted Republicans. Or: Why we shouldn’t expect Democrats to win every single Trump disapprover, anyway.
1. Breaking down the generic-ballot / Trump-approval gap
This analysis pools four waves of Strength In Numbers/Verasight polls conducted from January through April 2026 (n=5,509 registered voters). In the combined sample, Trump’s job approval is 38.7% approve, and 59.5% disapprove, for a net approval of -20.8. On the generic ballot, Democrats lead 50.5% to 42.4%, with 7.0% undecided — a margin of D+8.1.
That leaves a 12.7-point gap between Trump’s net disapproval and the Democratic generic-ballot lead. The big question is: What can we learn about these supposed Democratic holdouts?
I call this group the “cross-pressured voters” — people who disapprove of Trump but do not currently say they vote for a Democrat on the generic ballot — and I break it into three subgroups, based on whether an individual has any of three Republican “markers” — traits that suggest they would vote for a Republican candidate regardless of campaign events, issue positions, or what-have-you. Those markers are: (1) voting for Trump in 2024, (2) identifying with or leaning toward the Republican Party, and (3) placing themselves on the conservative side of the traditional liberal-conservative ideology scale.
I call these three groups:
Pool 1 — real holdouts: 3.4% of registered voters. This group did not vote for Trump in 2024 and has no other Republican markers at all. These voters are the most likely to vote Democratic in 2026.
Pool 2 — Trump’s borrowed coalition: 0.8% of RVs. These are Trump disapprovers whose only Republican marker is casting a Trump vote in 2024; otherwise, they are independent and moderate or liberal. They are more Republican-leaning than the average voter, but not reliable members of the Republican coalition.
Pool 3 — Republican-aligned Trump disapprovers: 6.8% of registered voters. These are cross-pressured voters with current Republican markers: they identify with or lean toward the GOP and/or place themselves on the conservative side of the ideology scale. Many, but not all, also voted for Trump in 2024.
Note that the clear majority of these supposed Democratic holdouts — 62% — are clear Republican sympathizers, not moderates or swing voters. Many have multiple Republican markers, and most say they are going to vote Republican.
So right off the bat, a reasonable guess is this: if roughly 62% of the holdouts are actually Republican-aligned, then only about 38% of the 12.7-point gap is plausibly available to Democrats. That implies a rough ceiling around D+13 — very close to what the scenario analysis below shows.
But we can do better than a reasonable guess. The chart below walks through what happens if Democrats flip each of the three groups above in sequence.
We start at the left with the world as it exists now: D+8.1 on the generic ballot.
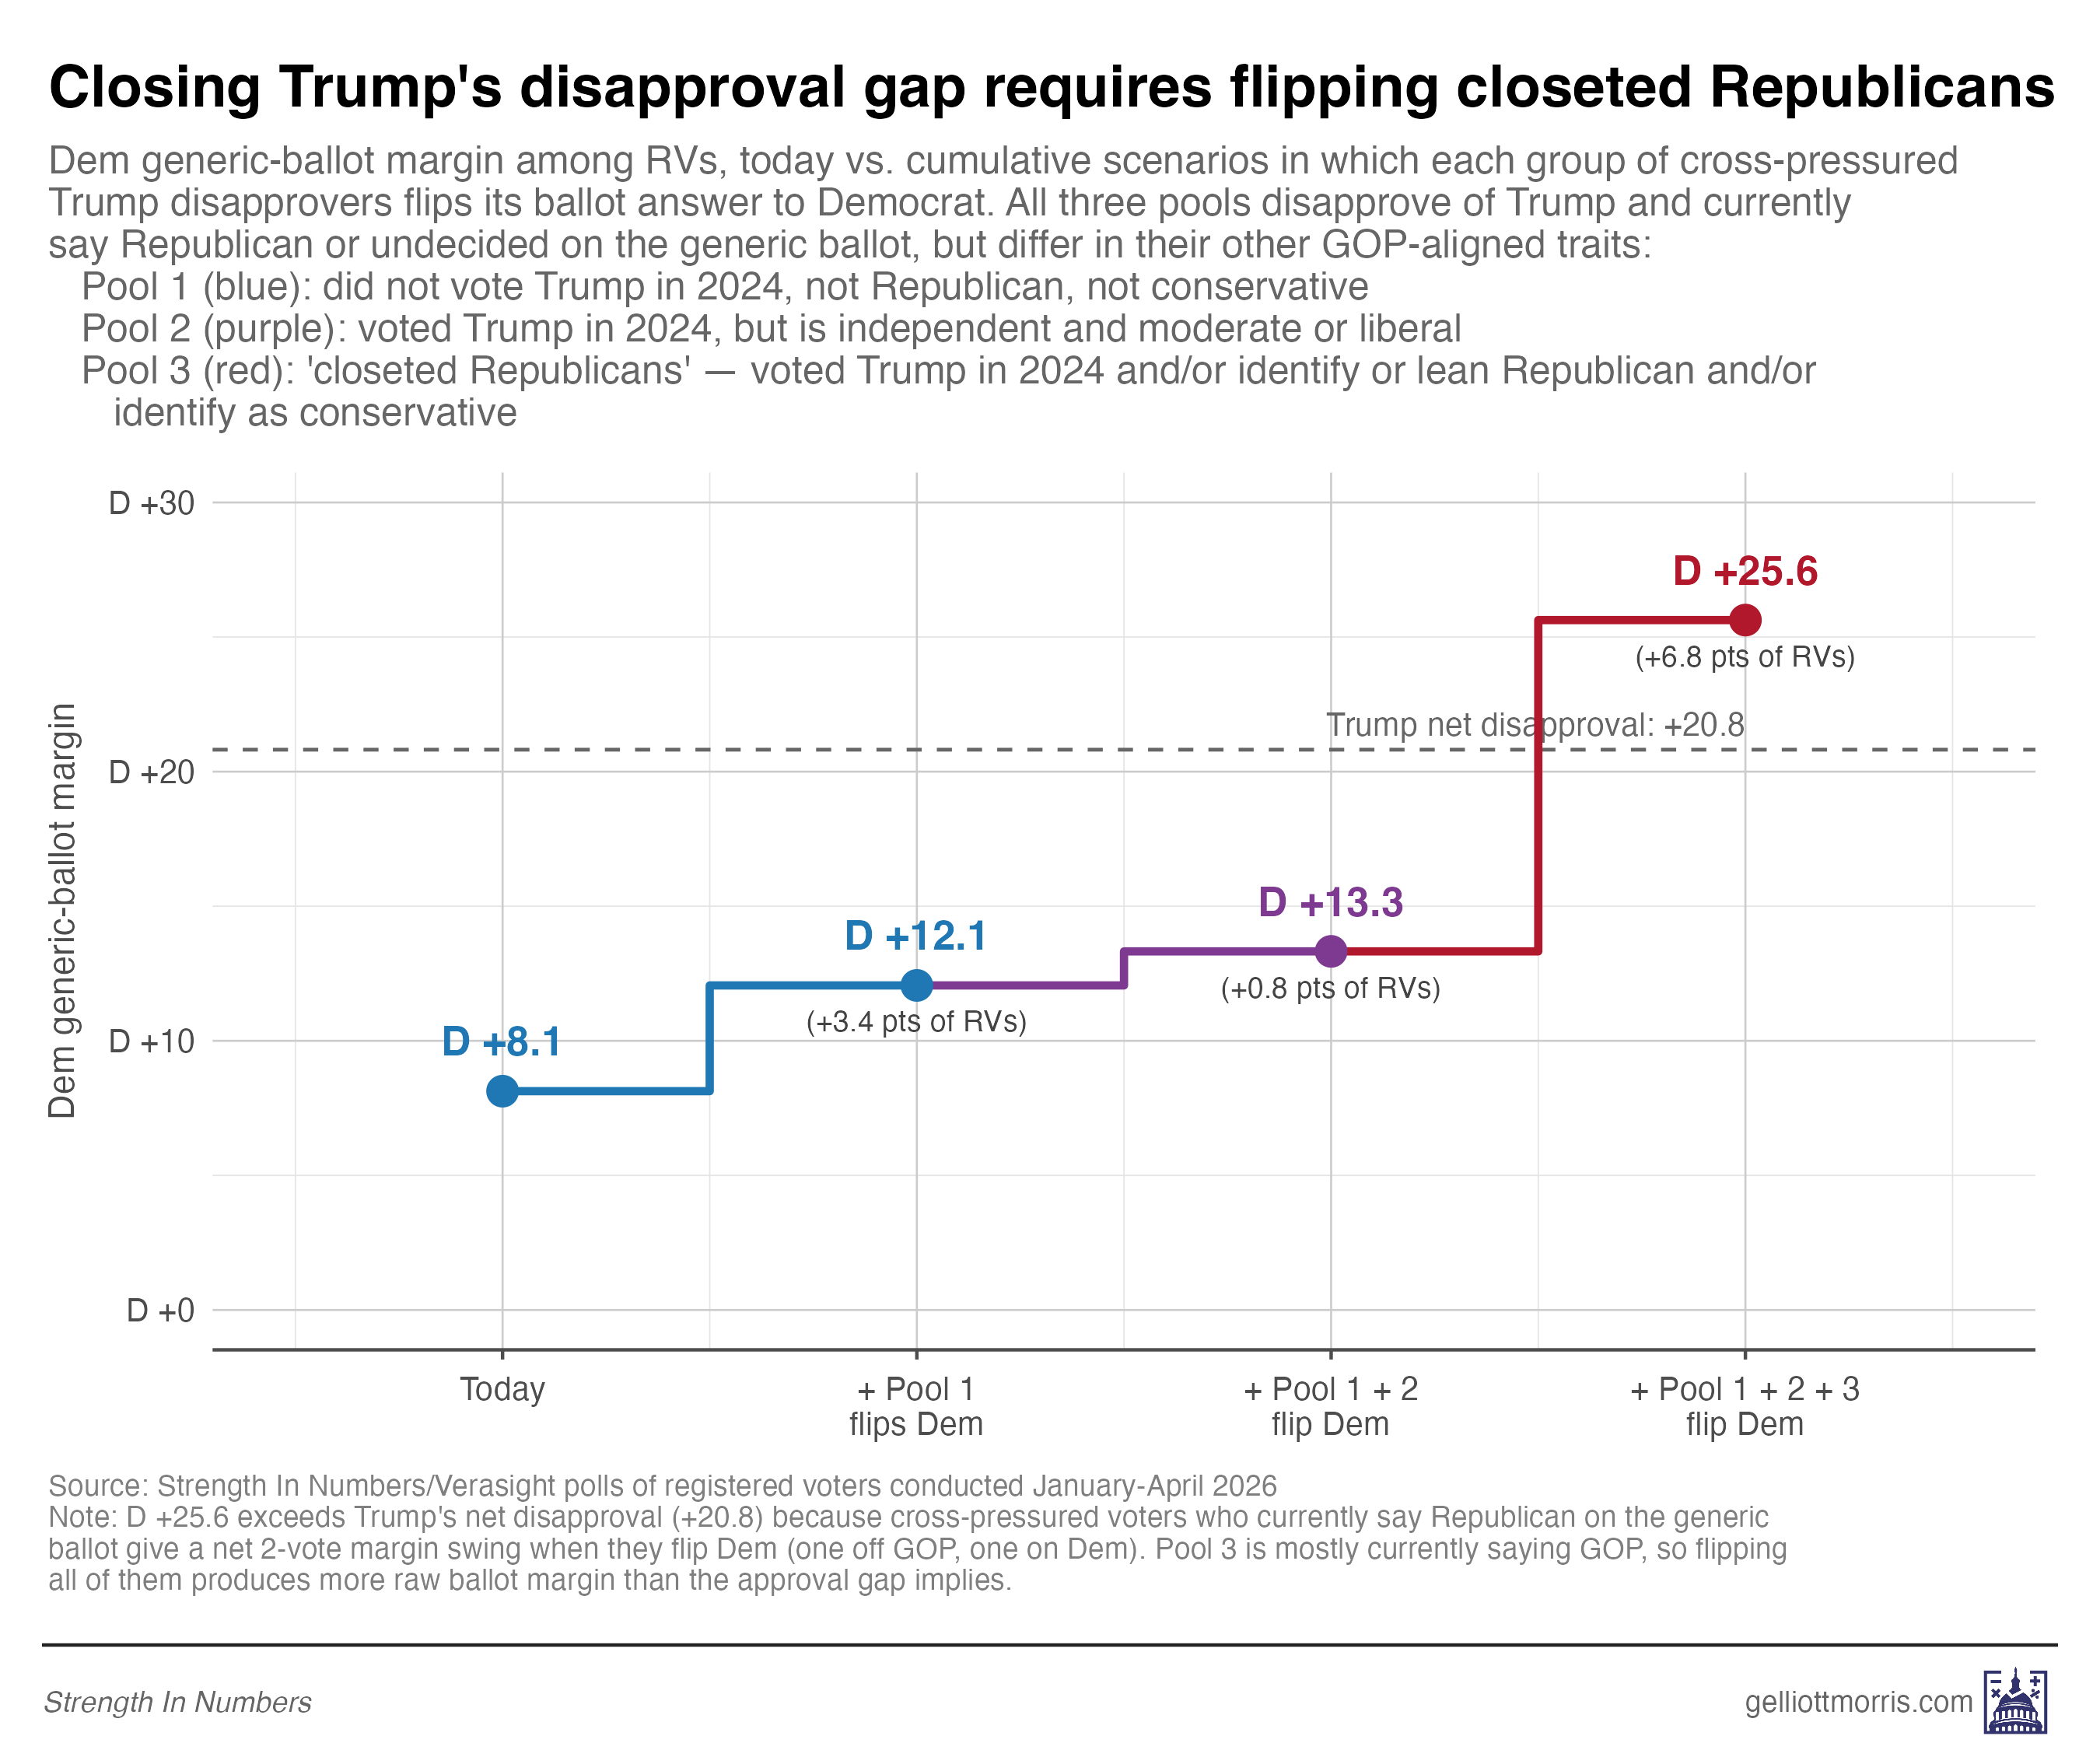
The first step, in blue, adds Pool 1. If every one of these real holdouts moved to the Democratic side, the margin would rise to D+12.1. That is a meaningful improvement, and it tells us this group is sizable enough to consider how to win over.
The second step, in purple, adds Pool 2. Flipping those voters raises the margin only modestly further, to D+13.3. At that point, Democrats have already captured most of the realistically persuadable voters, and are now relying on flipping former Trump 2024 voters.
The final step, in red, adds Pool 3 — the Republican-aligned Trump disapprovers. If Democrats somehow flipped that group too, the generic ballot would jump all the way to D+25.6, which even exceeds Trump’s net disapproval (shown by the dashed line at +20.8). That overshoot happens because many of these voters currently say Republican on the ballot; flipping them to Democrat moves the margin by two votes, not one.
That last step is the point of the chart. Closing the full approval-to-ballot gap would require Democrats to win back a bloc that is already almost certainly voting Republican in November. Pool 3 alone accounts for nearly all of the gap between the generic ballot and Trump’s approval. But these voters are 66% Trump 2024 voters, 89% Republican by party ID or lean, and 62% conservative. They are not unattached moderates waiting to be won back. They are Republican voters expressing dissatisfaction with Trump while still likely behaving like Republicans on the ballot. If we had a record of their vote in 2022, I’d bet that north of 80% of them supported Republicans that year.
That is also where Jain’s striking statistic appears to land. He writes that “among the 9% of the electorate who disapproved of Trump but also leaned toward voting Republican in 2026, Republicans led on crime 47% to 1%.” That group appears to line up much more closely with Pool 3 than with the voters Democrats can realistically move. In other words, the 47–1 trust gap describes voters who overwhelmingly trust Republicans on crime and look like usual Republican voters.
Should we even consider those GOP-voting Trump disapprovers as potential Democrats? Or are we making a category error in deciding who a possible Democratic voter is? Because you can disapprove of Trump and still vote for a Republican, treating all Trump disapprovers as the same thing as “persuadable Democratic voter” is an overly general category. For many of these voters, disapproval is evidently not a sign of partisan availability; it is just intra-party dissatisfaction.
And that is the practical takeaway from the chart: even if Democrats won over every voter in Pool 1 and Pool 2 — 4.2% of registered voters combined — their lead would rise only to about D+13 — better than today, but still well short of Trump’s -20.8 net approval.
A historical comparison here is apt. Plenty of Democrats disapproved of Joe Biden in 2022 and still voted Democratic — his approval rating among U.S. adults was -15 that year, yet Republicans won the House popular vote by just 2.8 points. Disapproval and vote intention do not always travel together.
2. Most persuadable holdouts are just politically disengaged, not anti-left moderates
That brings us to those voters in Pool 1 — 3.4% of registered voters. This is the significant slice of the electorate that is potentially winnable by Democrats. So what might convince them to vote D in November?
The first thing to know is that these voters have not really chosen against Democrats. For the most part, they have just not chosen at all. On the generic ballot, 83% of these voters say they “don’t know” how they’d vote, and just 17% say they’d vote for the Republican in their local district.
It is also, very clearly, a turnout story. Nearly 40% of Pool 1 did not vote in 2024. Another 26.1% voted for a third-party candidate. Only 34.0% voted for Harris, and none voted for Trump (because of the way we defined this group). The non-voter rate in this group is roughly four times that of firm Democratic voters.
And their demographic profile does not look much like the familiar suburban-moderate caricature. Pool 1 is 42.8% with no education beyond high school, 37.3% under $50,000 in household income, 24.3% Hispanic, 18.3% Black, and 26.0% under age 30, compared with just 8.1% over 65. More than three-quarters — 76.8% — are pure independents on the five-point party ID scale, and 57.2% are women.
In short, these voters are working-class, multiracial, heavily independent, and significantly politically disengaged. These are not voters who have carefully weighed the parties and decided they prefer Republicans. They are voters who are barely engaged. As I argued in “The Strategist’s Fallacy”, many voters do not think about politics the way analysts do. Pool 1 is a perfect example of this: they are low-information voters who have not fully sorted themselves onto either ideological camp. The biggest challenge in winning them is engagement, not persuasion.
That matters for strategy. If the movable voters in the gap are mostly low-engagement independents who are weakly attached to politics, then the Democratic challenge is not to reposition on crime, as Jain suggests. It is to activate voters who are only loosely connected to either party and who have not yet fully entered the campaign.
If your advice to the Democrats is to moderate their stance on crime and the border to target those voters who say they are Republicans, voted Trump in 2024, and call themselves conservatives, you’re (a) fighting a losing battle; and (b) targeting the wrong group! That’s not the persuadable voting bloc!
3. What persuadable voters actually want
One of the tired things I see pundits do a lot is they point out a big problem in politics, and then shoehorn in their favored ideological fix for that problem. This is especially annoying when it comes to coverage about polls, because we don’t have to guess what voters care about; we can just ask them, in a poll!
And before asking which party voters trust on an issue, we should ask whether they care about that issue in the first place.
That is where the crime theory of the approval-generic ballot gap starts to break down. The chart below shows the most-important-issue ranking for four groups: registered voters, our persuadable group of holdouts (Pool 1), our closeted partisans, and Trump approvers. Among all registered voters, prices and inflation dominate as the most important problem for voters. Among Pool 1 — the Trump disapprovers with no Republican anchors, and therefore the voters Democrats can most plausibly move — the pattern is even more lopsided: 38% name prices or inflation, 21% name jobs and the economy, and 12% name health care.
Crime is cited as America’s most important problem by just 3% of voters in the key persuadable group.
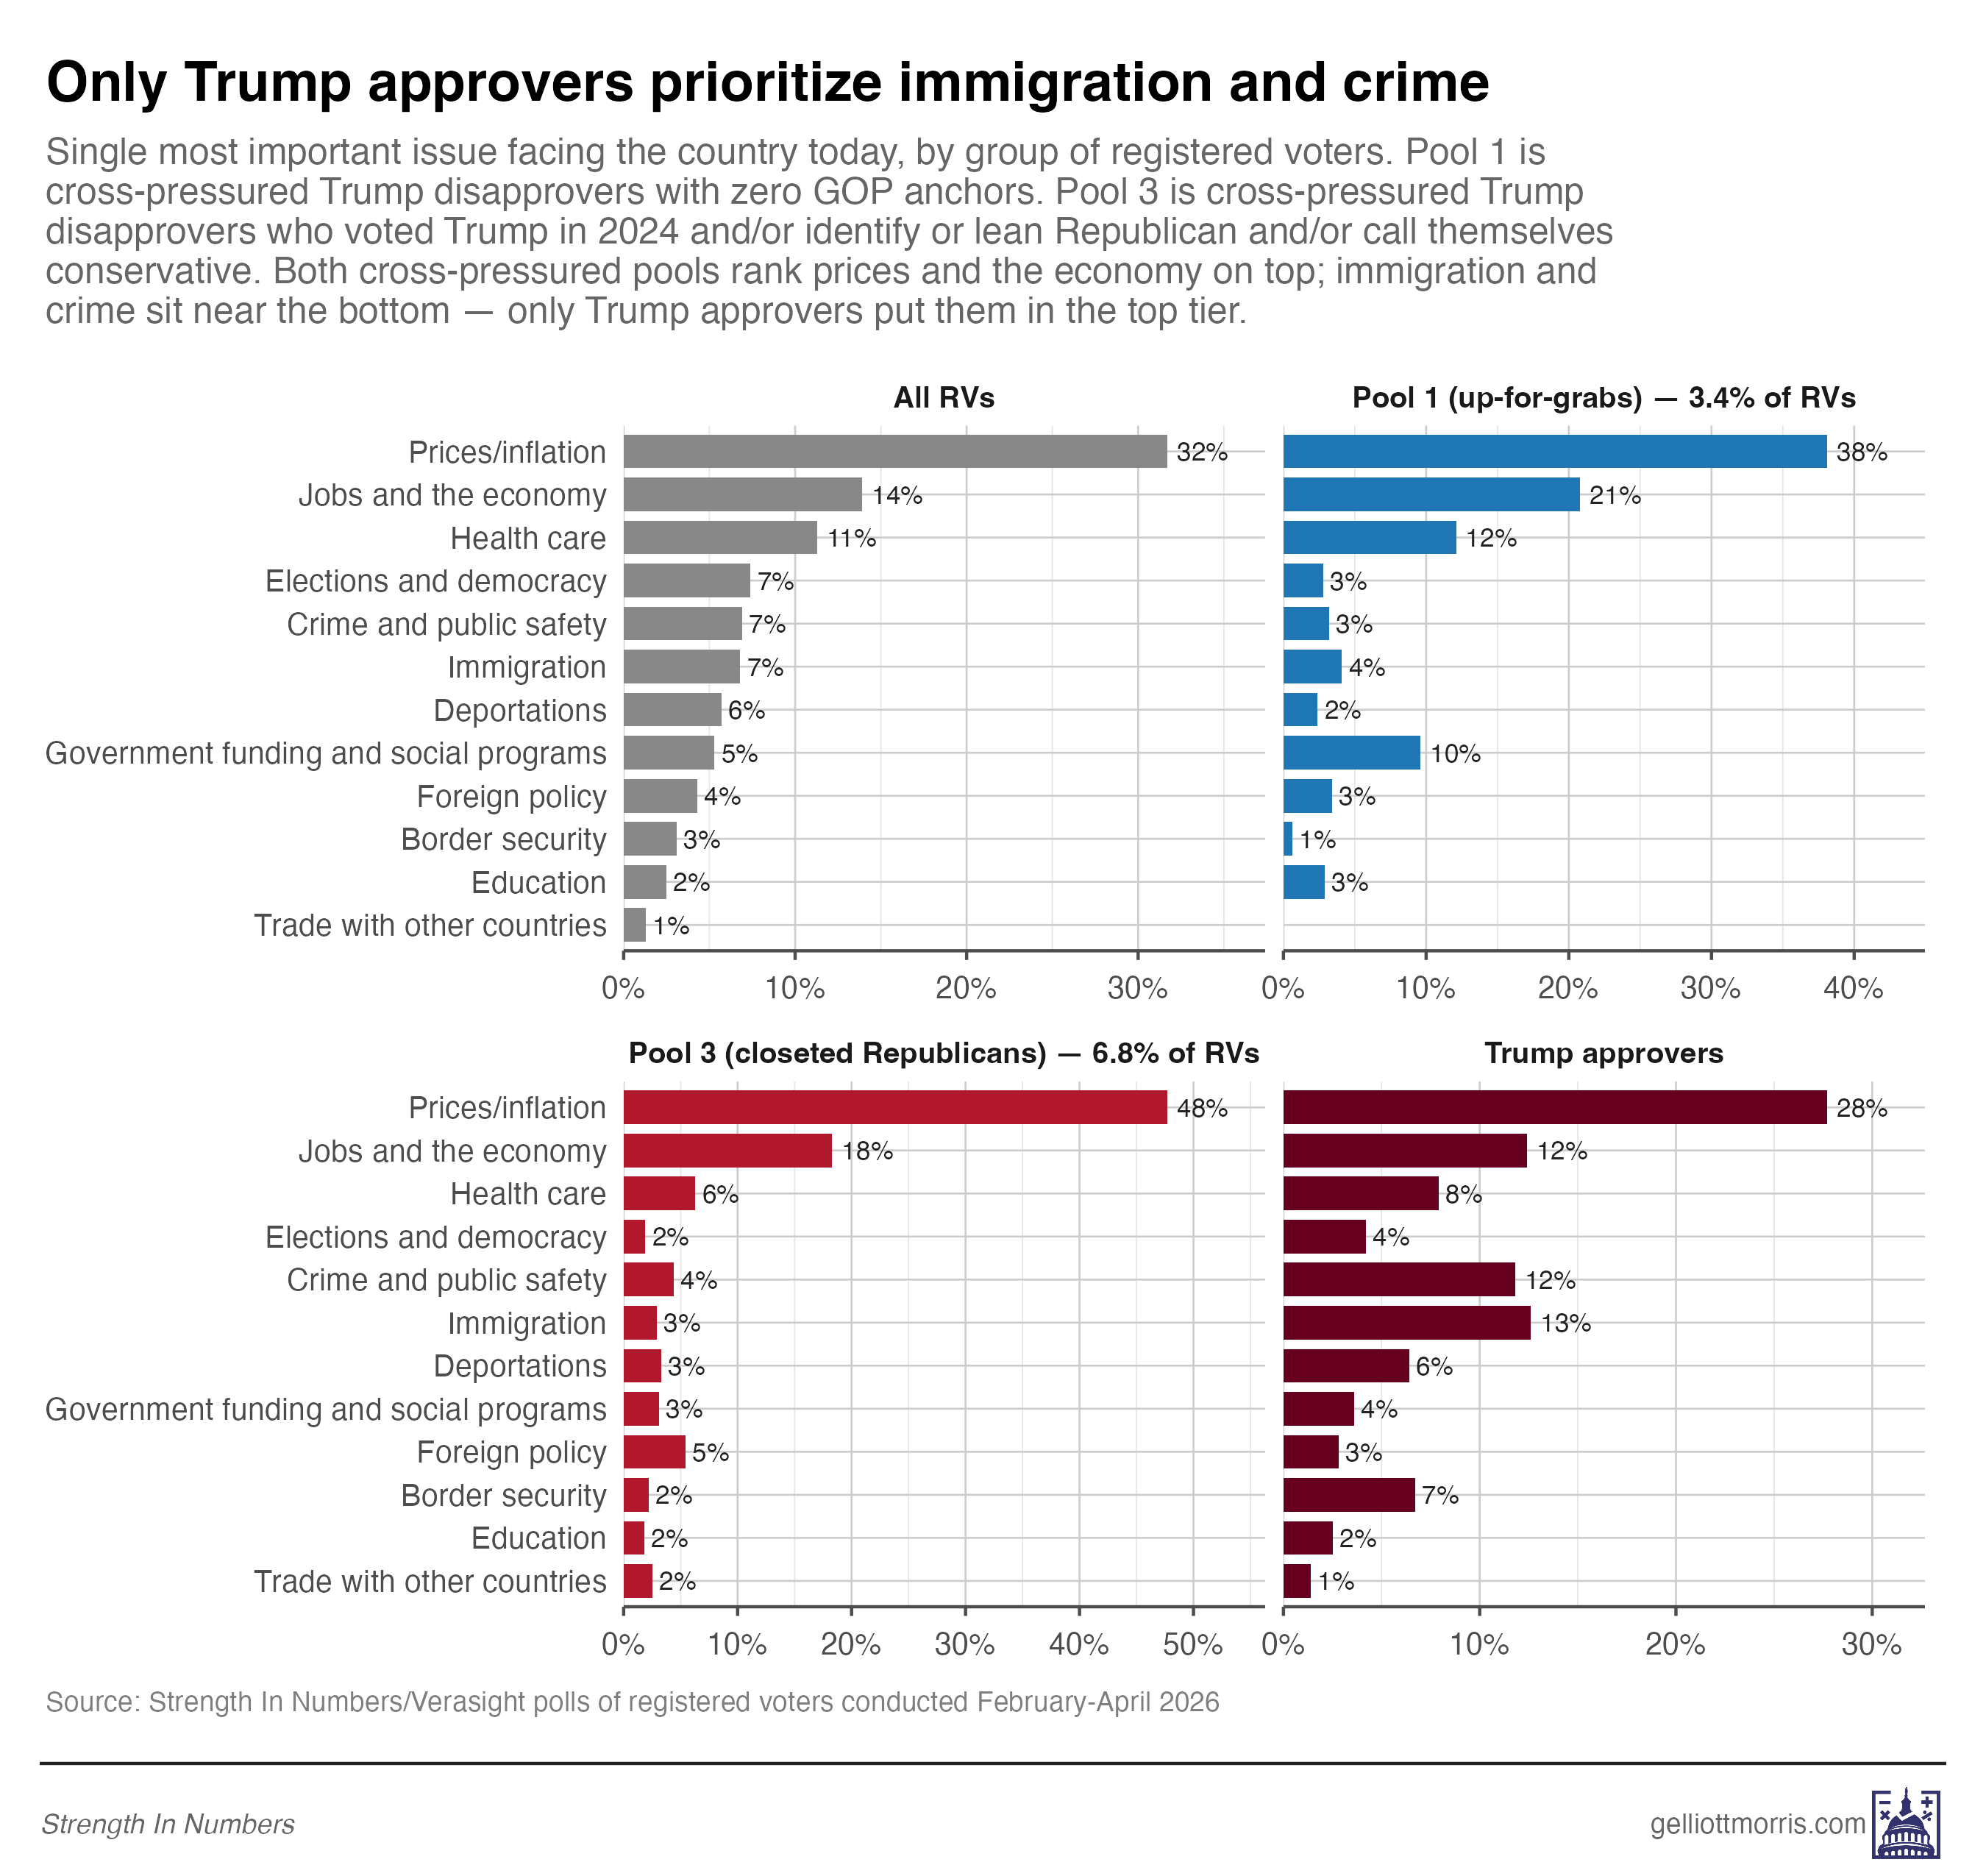
The voters in Pool 1, in other words, do not look like the type of group that is just waiting in the wings for a Democratic pivot on crime. This group is worried about the cost of living, health care, and social programs. And for what it’s worth, <1% is worried about border security.
The same is true, somewhat surprisingly, for Pool 3. These are the Republican-aligned Trump disapprovers who make up nearly two-thirds of the approval-versus-generic-ballot gap. If the crime-and-immigration interpretation of the gap were right, this would be the group where those issues should really pop out high on the MIP scale. But even here, prices and inflation are the dominant issue: 48% of voters in Pool 3 name prices as the nation’s MIP, and another 18% name jobs and the economy. Crime is at 4%, immigration 3%, and border security 2%.
Now, looking at the bottom-right panel, the group that actually prioritizes crime and immigration is not the cross-pressured Trump disapprovers, but Trump approvers. Among Trump approvers, immigration, crime, deportations and border security all rank much higher than they do among either Pool 1 or Pool 3.
That matters for Jain’s argument. His diagnosis of the Democratic brand problem is not fictional. There is a real trust gap on crime in some parts of the electorate. Some voters really do prefer Republicans on crime and immigration. And the 47–1 number he cites is brutal, if somewhat questionable (Jain apparently removed from this group any voter who said they were unsure how they’d vote on the generic ballot).
But the MIP data shows why the crime gap does not answer the generic-ballot puzzle. The voters with the strongest Republican trust advantage on crime are not the movable voters in the gap. They look much more like Republican-aligned Trump disapprovers who are already voting Republican. The voters Democrats can actually mobilize are not naming crime as their problem.
For Pool 1, the combined economic bundle — prices, jobs, health care, and government funding — accounts for 80.6% of most-important-issue responses, compared with 62.2% among all registered voters. The cultural-grievance bundle — immigration, border security and deportations — is just 7.1% of Pool 1, compared with 15.6% among all registered voters. Crime alone is 3.2%, less than half the all-voter average.
Prices are roughly 12 times more important to Pool 1 than crime is.
Now, consider the party trust numbers on these issues, rather than the MIP numbers.
The persuadable voters tilt toward Democrats by +12 to +30 points on every economic issue, and only give Republicans a +9 advantage on handling crime. But these margins mask a more important finding: most of the cross-pressured voters say they have no idea who they trust more to handle most issues. The most common answer on the question “who do you trust more to handle X, Democrats or Republicans?” is simply “I don’t know”.
Because I don’t have the energy to make another nice-looking table, here’s a screenshot straight from my survey programming software:
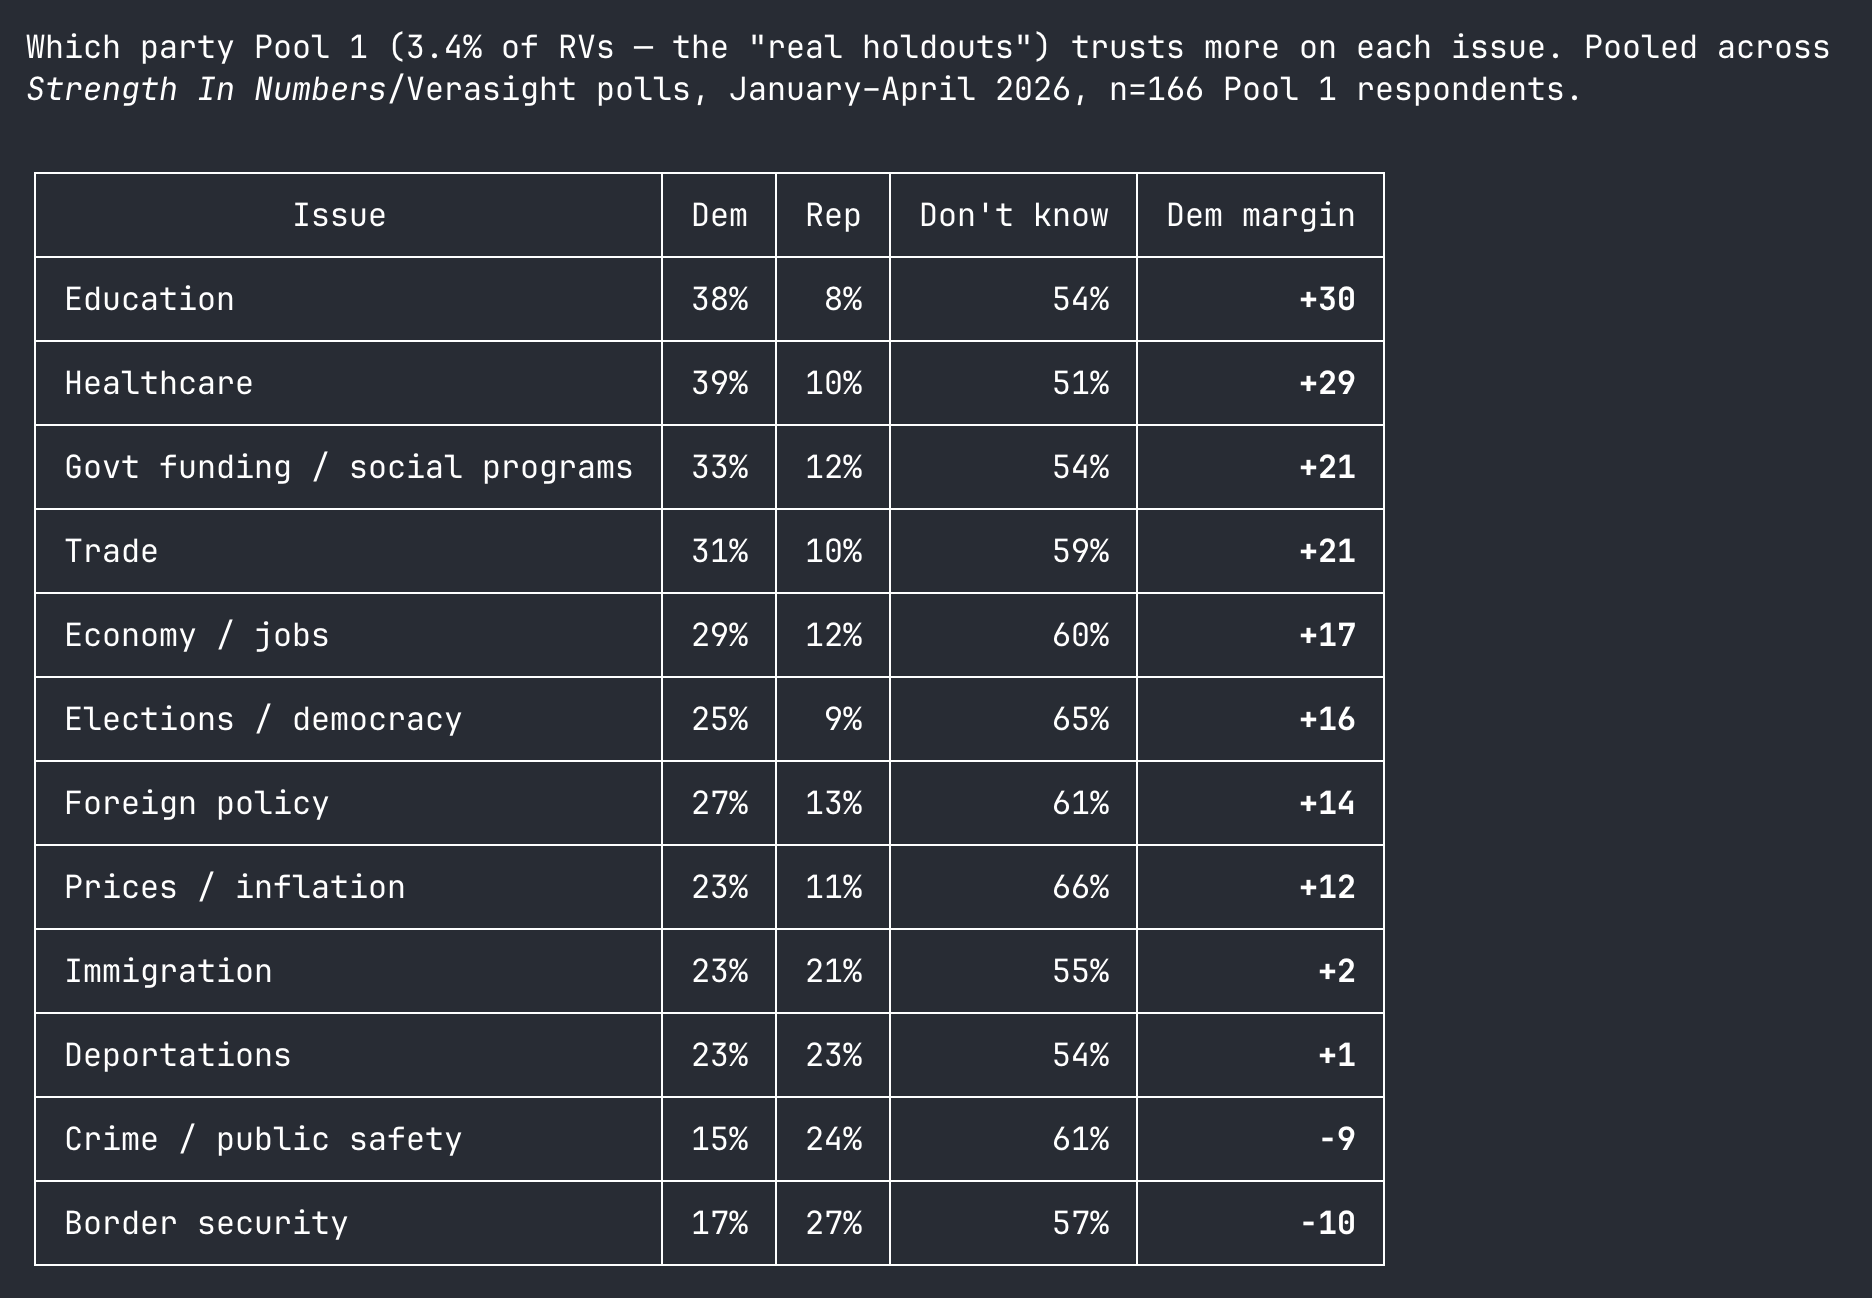
The “don’t know” shares here are huge, especially on crime. That is the activation problem again: many of these voters have not yet formed a firm view of which party they trust, but when they do have an issue priority, it is overwhelmingly economic. They tilt slightly Republican on crime and border security, but those issues sit near the bottom of their stated priorities, and the DK rate is really high.
So the problem for Democrats is not that Pool 1 is clamoring for a crime repudiation. It is that these voters are weakly attached to politics, economically stressed, and not yet activated. These are not a bunch of voters reading online discourse about the party’s supposed positions and obscure academic theories of protest (which The Argument likes to link to as a criticism of the party).
4. Disapproving of Trump doesn’t make you a Democrat
The big mistake in this whole discourse is treating the entire group of Americans who disapprove of Donald Trump as a pool of voters Democrats ought to be winning. That’s not how these gaps have worked historically, and as this survey data shows, the individuals who make up the gap are not homogeneous and undecided. Some — about a third — are low-engagement, anti-Trump voters who have a loose grasp of what the parties stand for and are undecided across many questions. But most — about two-thirds — are Republican-aligned voters who disapprove of Trump while still looking, on every other measure, like regular Republican voters.
A voter who disapproves of Trump but voted for him in 2024, identifies with or leans toward the Republican Party, and calls themselves conservative does not pose the same kind of pickup opportunity as a voter who disapproves of Trump, has no Republican markers, and says they do not know how they will vote. So we should take those voters out of the denominator; there’s not a 12-point gap between where Democrats are now and where they “should be,” but a 3-4 point gap between their current margin (D+8 in our poll) and their ceiling (D+12).
That distinction has huge strategic implications. Pool 3 is the clearest example. These voters make up two-thirds of the current GB-approval gap, but they are not really a Democratic persuasion target. They are 66% Trump 2024 voters, 89% Republican by party ID or lean, and 62% conservative. They may dislike Trump, or at least say they do, but their political traits suggest they will vote for Republicans regardless of factors like the Democratic Party line on crime (which, contrary to what The Argument suggests, was never pro-shoplifting).
The persuadable voters, on the other hand, should really be thought of as mobilization targets, not persuasion targets. These voters are not waiting for Democrats to repudiate old positions on crime; they are disengaged voters who do not have hard political attitudes and do not spend time thinking about politics or consuming political information. Their top issues are prices, jobs and health care. They already lean toward Democrats on those issues, when they have an opinion at all. The problem is that many of them do not vote reliably.
So the Democratic shortfall relative to Trump’s approval rating is both narrower than the topline approval number implies, and solved via a different mechanism than pundits are proposing. The path from D+8 to something like D+13 runs through widespread activation of sympathetic undecideds and non-voters: giving low-engagement, economically focused Trump disapprovers a reason to vote Democratic. Going from D+13 to D+21, on the other hand, would require flipping Republican-aligned voters, who are still behaving like Republican voters, and say they’ll vote Republican on the generic ballot. I know what I would spend my time and money on.
The gap between the Democrats’ +8 margin on the generic ballot and Trump’s -20 net approval rating is not made up of a hidden mass of persuadable anti-Trump Republicans. It is mostly made up of closeted Republicans. And this was an incredibly easy thing to diagnose, once you know where to look.
The best way to support my work making analyses like this is via a paid subscription to Strength In Numbers. Thank you.


Very insightful as always!
Once again, Mr. Morris produces statistics that give us hope.
For decades, Republicans have used negative campaigning (which I still deplore) to convince people what to vote AGAINST, what they HATE. And they succeed, because eliciting visceral reactions in people makes them far more determined to vote: abortion, gay marriage, "transgender for all", gun control, fear of religious persecution and fear of crime (even when those issues are falsely and obviously exaggerated for purely partisan purposes) have pretty much produced today's loyal Republican voters. Then there's the ongoing undercurrent of the belief that taxes are just a Democratic scheme to redistribute wealth from the hardworking, smarter, deserving rich to the lazy, undeserving, freeloading poor/minorities/women (thanks to Heather Cox Richardson for that apt theory).
So, where that leaves us is MESSAGING, at which Dems are at a disadvantage because we recognize that many of these issues are complex and multi-faceted, and Republicans yearn for simplistic, black-and-white, own-the-libs slogans of smack-down dominance.
One message that more and more people are getting on board with these days is the reality that our current billionaire class is out of control and becoming dangerous to the future of our republic. Tying that "rage" to affordability may bring a few more swing voters over to our side. They need to vote AGAINST the corruption and exploitation of Trump and his cronies/family so that more families can be financially stable and have opportunities to get ahead.