


The Republican pollster Patrick Ruffini published the following chart in a Substack post this week, arguing that “Senate polls are always worse in the summer.” The chart shows that polls of Senate races have, over the past 4 election cycles, overestimated support for Democratic candidates by about 6 points relative to real vote margins on Election Day:
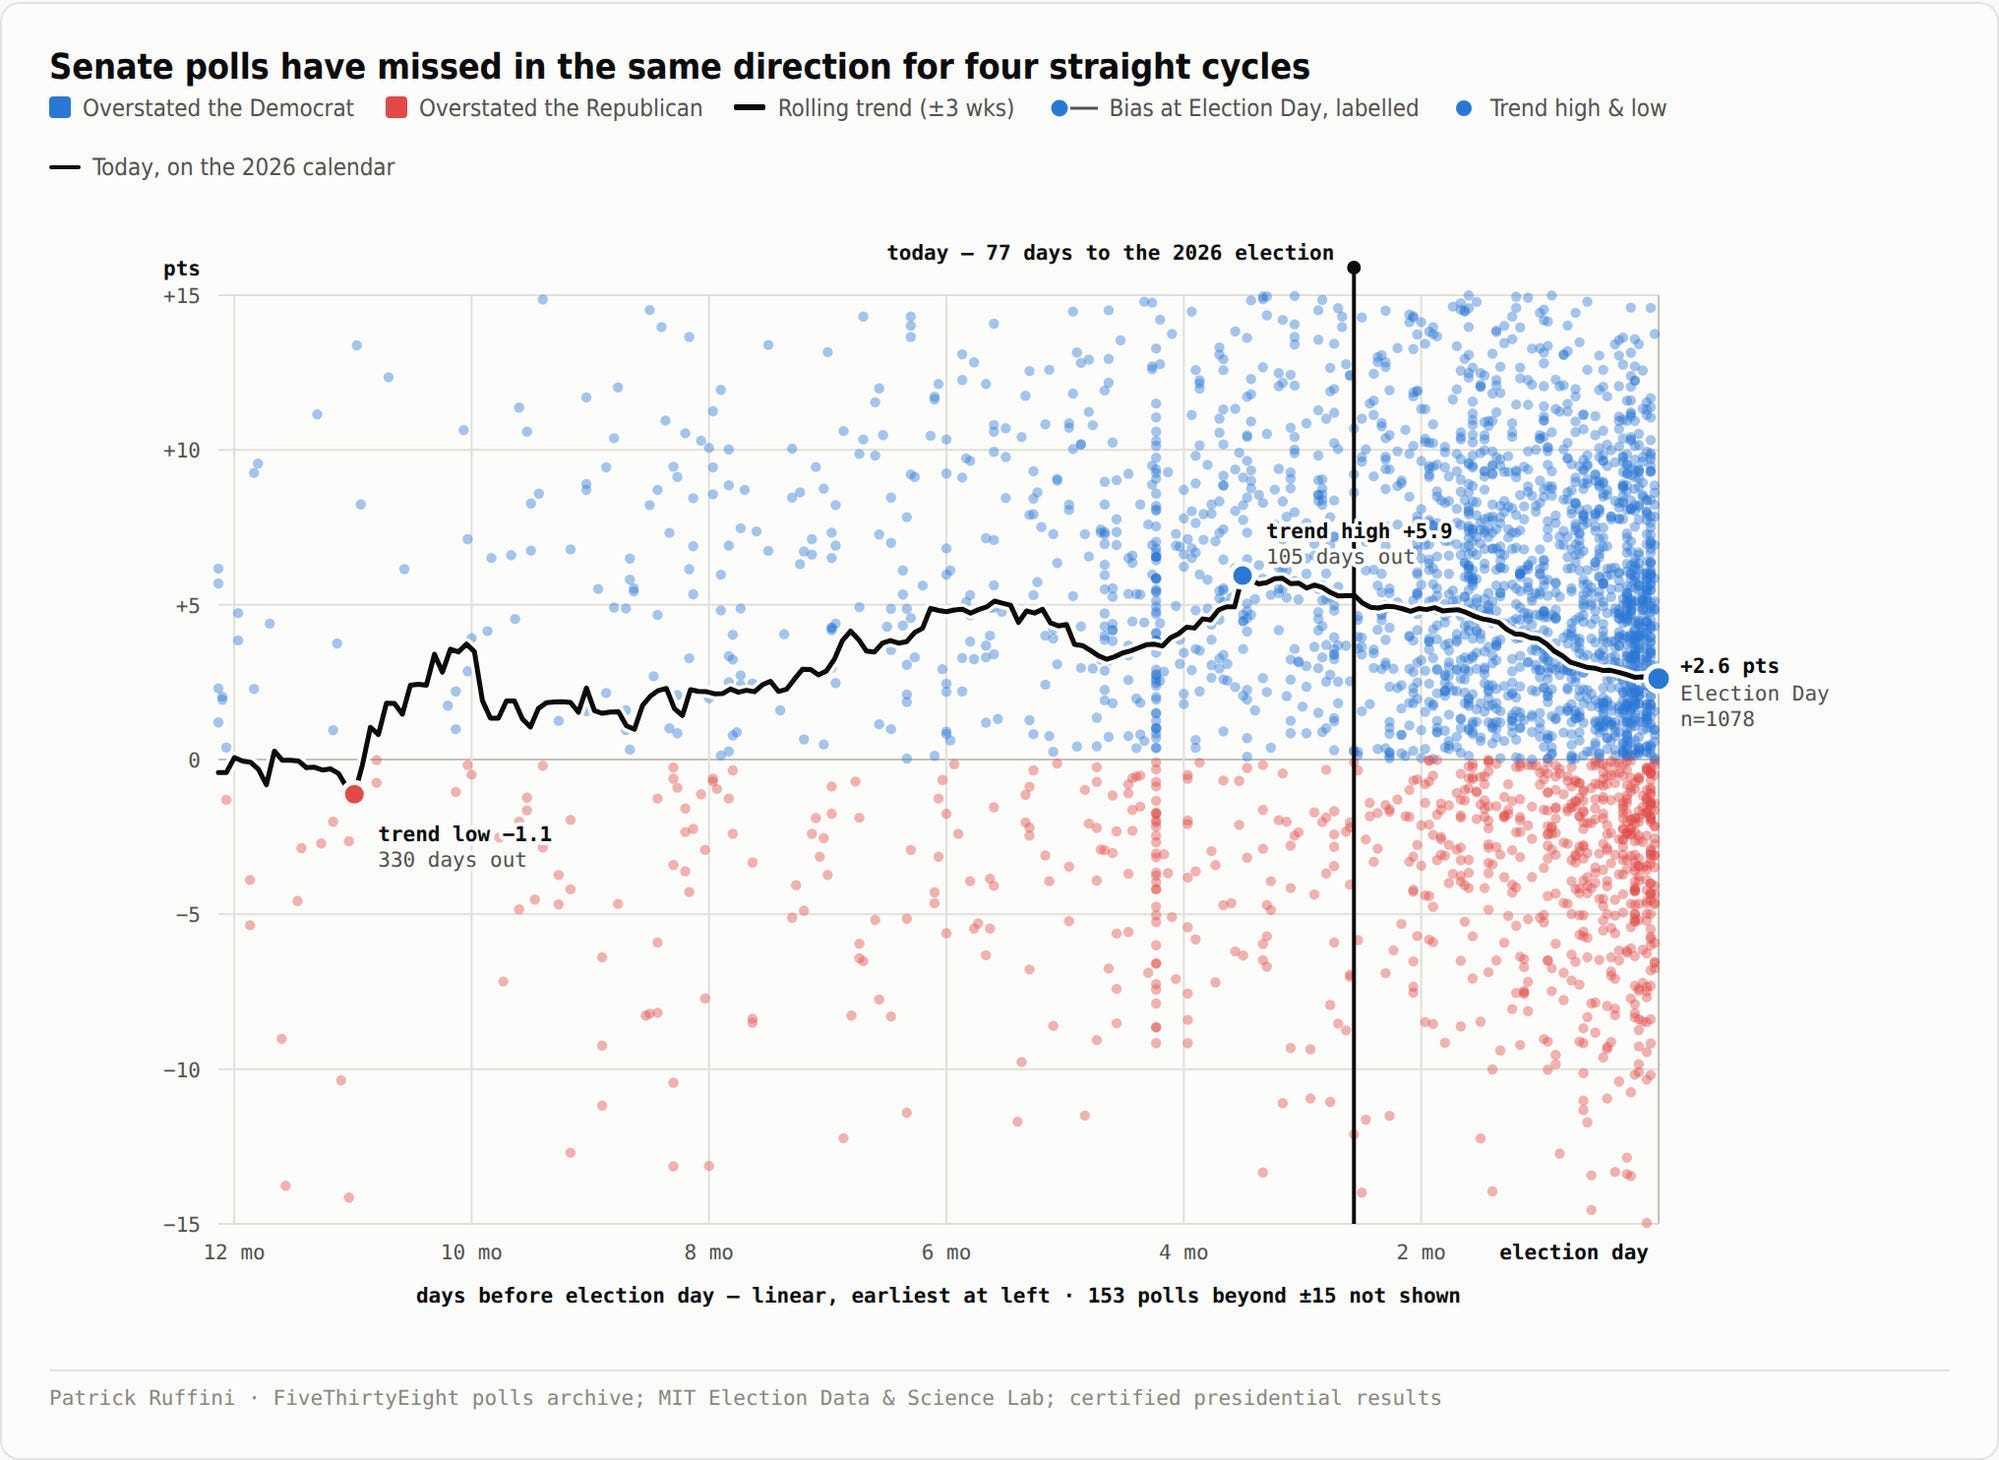
While polls often overestimated support for Republicans as well, the average survey overestimated Democrats significantly. For any given Senate poll released in August of 2024, 2022, 2020, or 2018, you had a much better-than-even shot at predicting Republicans would beat it. About 70% of August polls in the past 8 years have overestimated support for Democrats.
Ruffini’s chart is in many ways unsurprising. The window contains both the 2024 and 2020 elections, years we know surveys had too many Democrats in them, and where preferences moved right in the final months. But it also contains 2022 and 2018, when polls did much better. In 2022, polls on Election Day actually overstated support for Republicans, bucking the previous cycles’ trend.
But the big question this piece prompts us to ask — indeed, prompted dozens of you to email me about — is this: so are the polls overestimating Democrats again this year?
The truth is, Ruffini’s argument is right in some ways and wrong in others. He is right to point out that polls early are often “wrong” (only if you view early polls as forecasts of future preferences instead of snapshots of opinion at the time they were taken), and the election forecasting model I built for FiftyPlusOne.news goes to great lengths to treat polls with the proper amount of uncertainty/skepticism.
But the implication or the piece — that polls are likely biased toward Democrats right now — is not warranted by looking at the historical data. Ruffini only has 4 cycles of polls in his analysis. But I have polls going back to 1998, so in this week’s Chart of the Week, I show that bias in polls tends to change randomly from year to year. Like taking the under on low-probability bets, predicting polling error from previous cycles’ misses works until it doesn’t.
This is post is free to read, but if you want to support my independent data-driven political journalism and get premium posts like these sent to your inbox 2x a week, become a paying subscriber to Strength In Numbers today. Members also get early access to data products, a private community on Discord for our political data nerds, and an ad-free newsletter experience.
If a paid subscription is out of reach, the next best thing you can do is to share this article with a friend. Organic recommendation is the #1 driver of new readers here at Strength In Numbers.
“Unskewing” the polls usually increases error
I have taken FiftyPlusOne’s dataset of all horse-race general election polls since 1998 and filtered it down to polls released by August 31 in each year. Then, I calculated rolling 45-day polling averages for each competitive Senate race in those cycles and compared those polling averages to the November results in each race.
The table below shows the average bias of polls in the average race by year, going back to 1998. It also contains, for each year, (a) the average bias of polls on Election Day and (b) the average bias in polls released in August in the prior 4 election cycles.
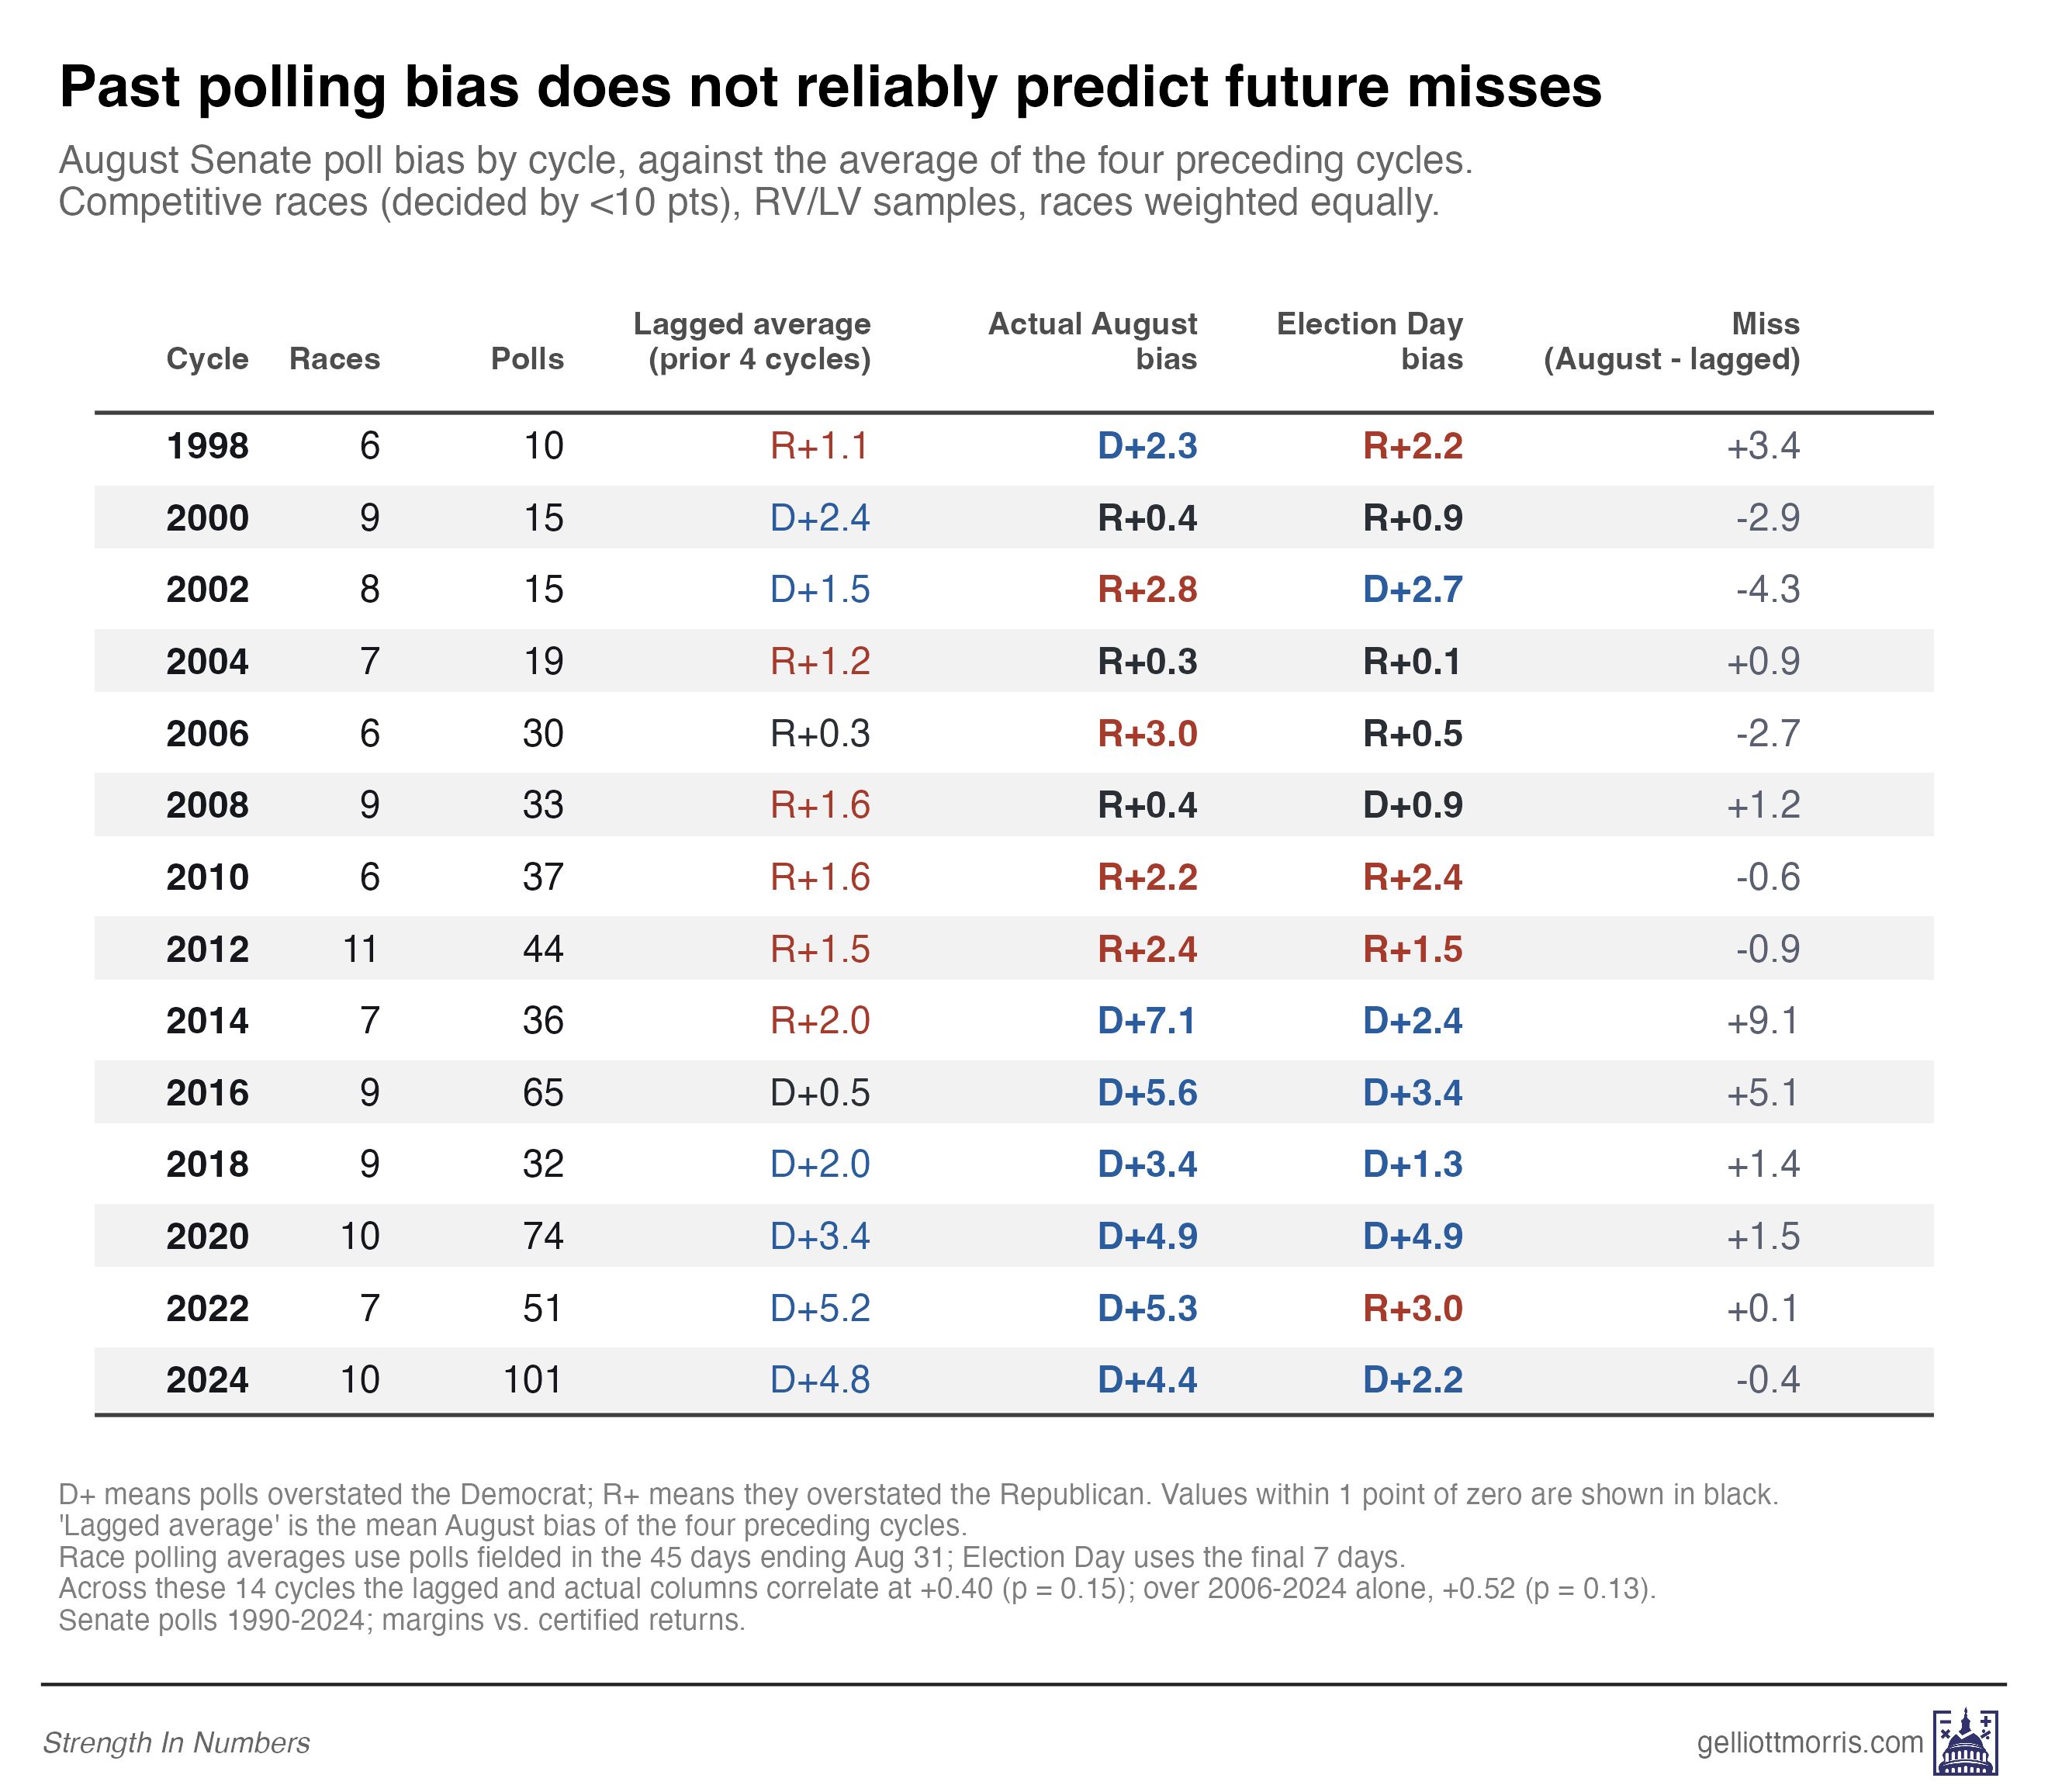
As Ruffini found, those August polls have been overestimating Democrats recently. But note (a) that this wasn’t/is not always the case, and (b) polls often improve in predictive performance as we get closer to November.
What’s really striking from this table, though, is how poorly lagged cycle bias predicts future poll misfires.
The lagged average bias of polls in year Y-8:Y got the direction of bias in year Y right in ten of fourteen cycles. But it missed the magnitude by an average of 2.5 points, and the direction about 30% of the time. And the predictive failures one would make using the heuristic “polls will be as biased as they have been recently” are not small ones. In 2014, the four preceding cycles pointed to polls understating Democrats by two points; August polls that year overstated them by seven. You would have created a 9-point error in the wrong direction in your poll or election forecast if you had applied the lagged error to the average survey.
Similarly, in 2016, the 4-cycle lagged average bias suggested the polls were essentially clean, and they turned out to be off by nearly six. Back in 2002. You would have predicted a pro-Democratic polling environment on the historical data, but surveys had a two-and-a-half-point Republican tilt instead.
Plotting the same data above makes the problem inherent in predicting poll bias easy to see. While two variables — observed poll bias and lagged bias — are generally related, they are not highly correlated, and there are some very big differences.
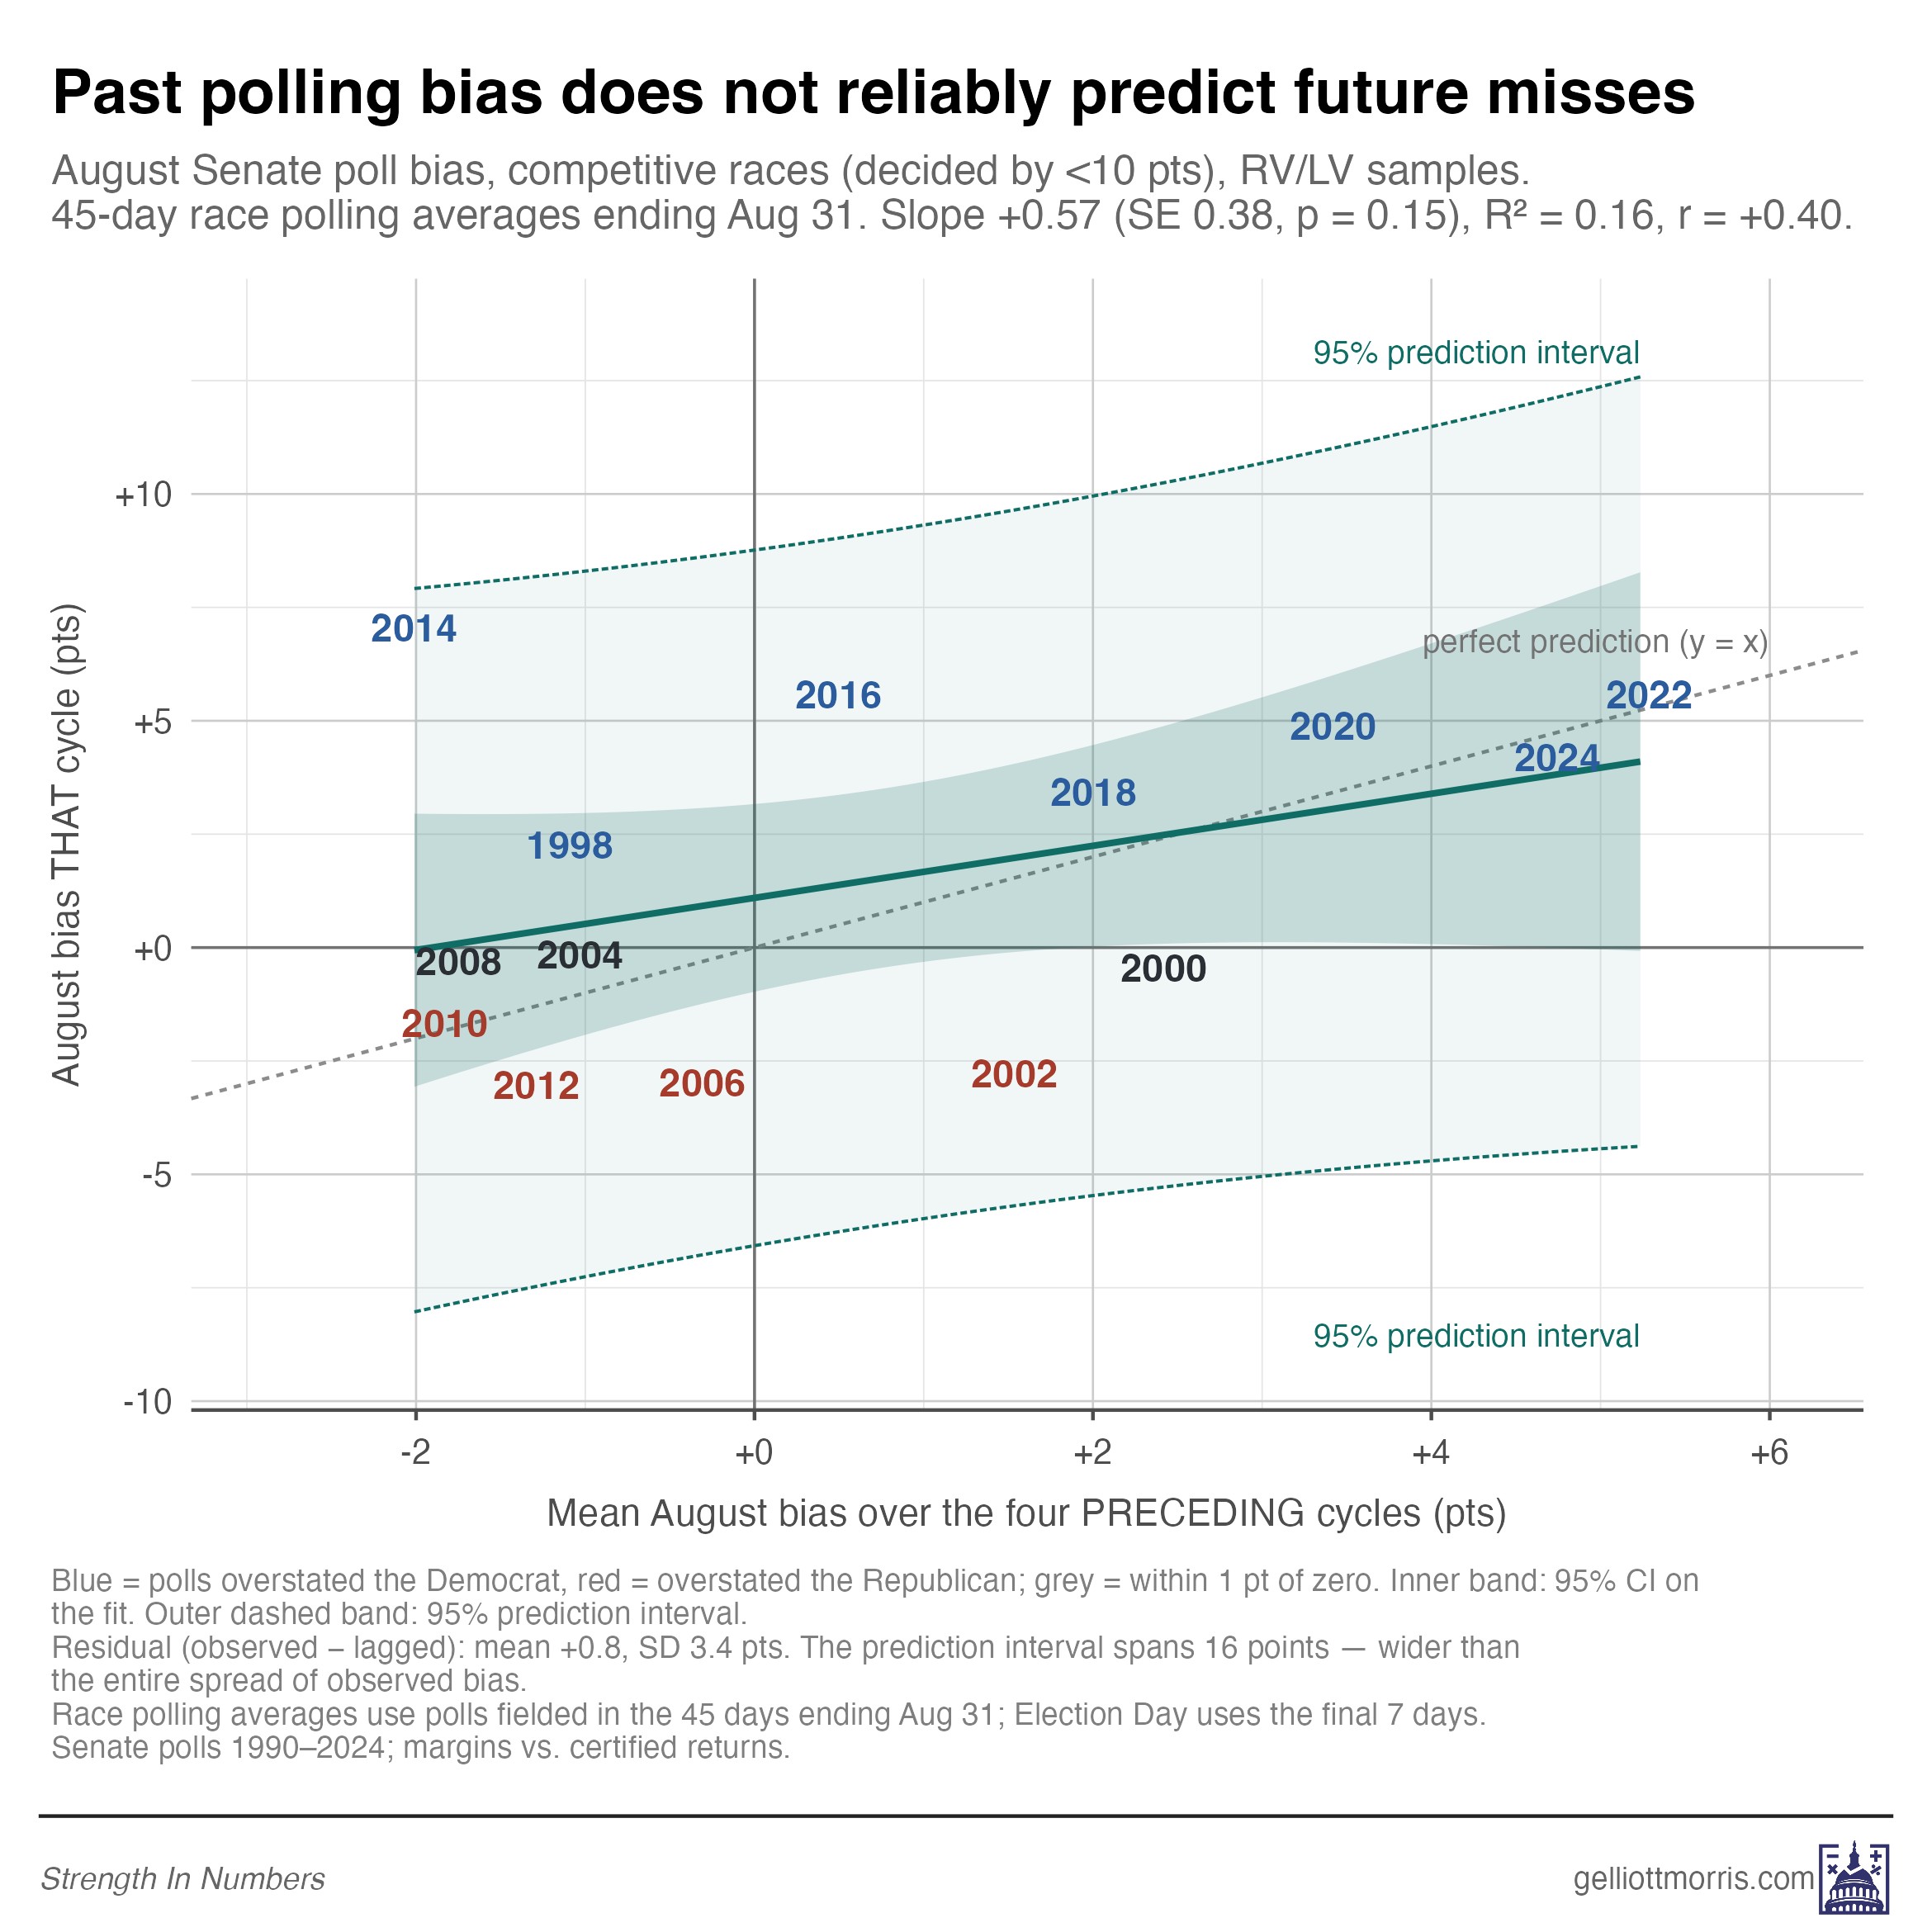
Each election year occupies the point in the graph above corresponding to its cycle’s lagged average bias on the horizontal axis and its observed August bias on the vertical. If past bias predicted future bias, the years would line up along the dashed diagonal. Instead, they scatter.
The fitted line slopes upward at 0.57 — meaning a one-point pro-Democratic tilt in the last four cycles came with about half a point in the next one. But the standard error of that slope is 0.38, which means we cannot statistically distinguish it from zero. Zero is what you would get if the past told you nothing about future polling bias at all.
But the wider shaded band is the real kicker here. That is the 95% prediction interval — the uncertainty interval around predictions of future bias given lagged bias over the past 4 cycles. It is huge. Knowing what polls did in the four previous cycles narrows your expectation for the next one by essentially nothing.
Ruffini’s post is about August polls, but for the record, the serial correlation of poll bias is even worse on Election Day. Bias by Nov tends to even revert somewhat from the previous cycle.
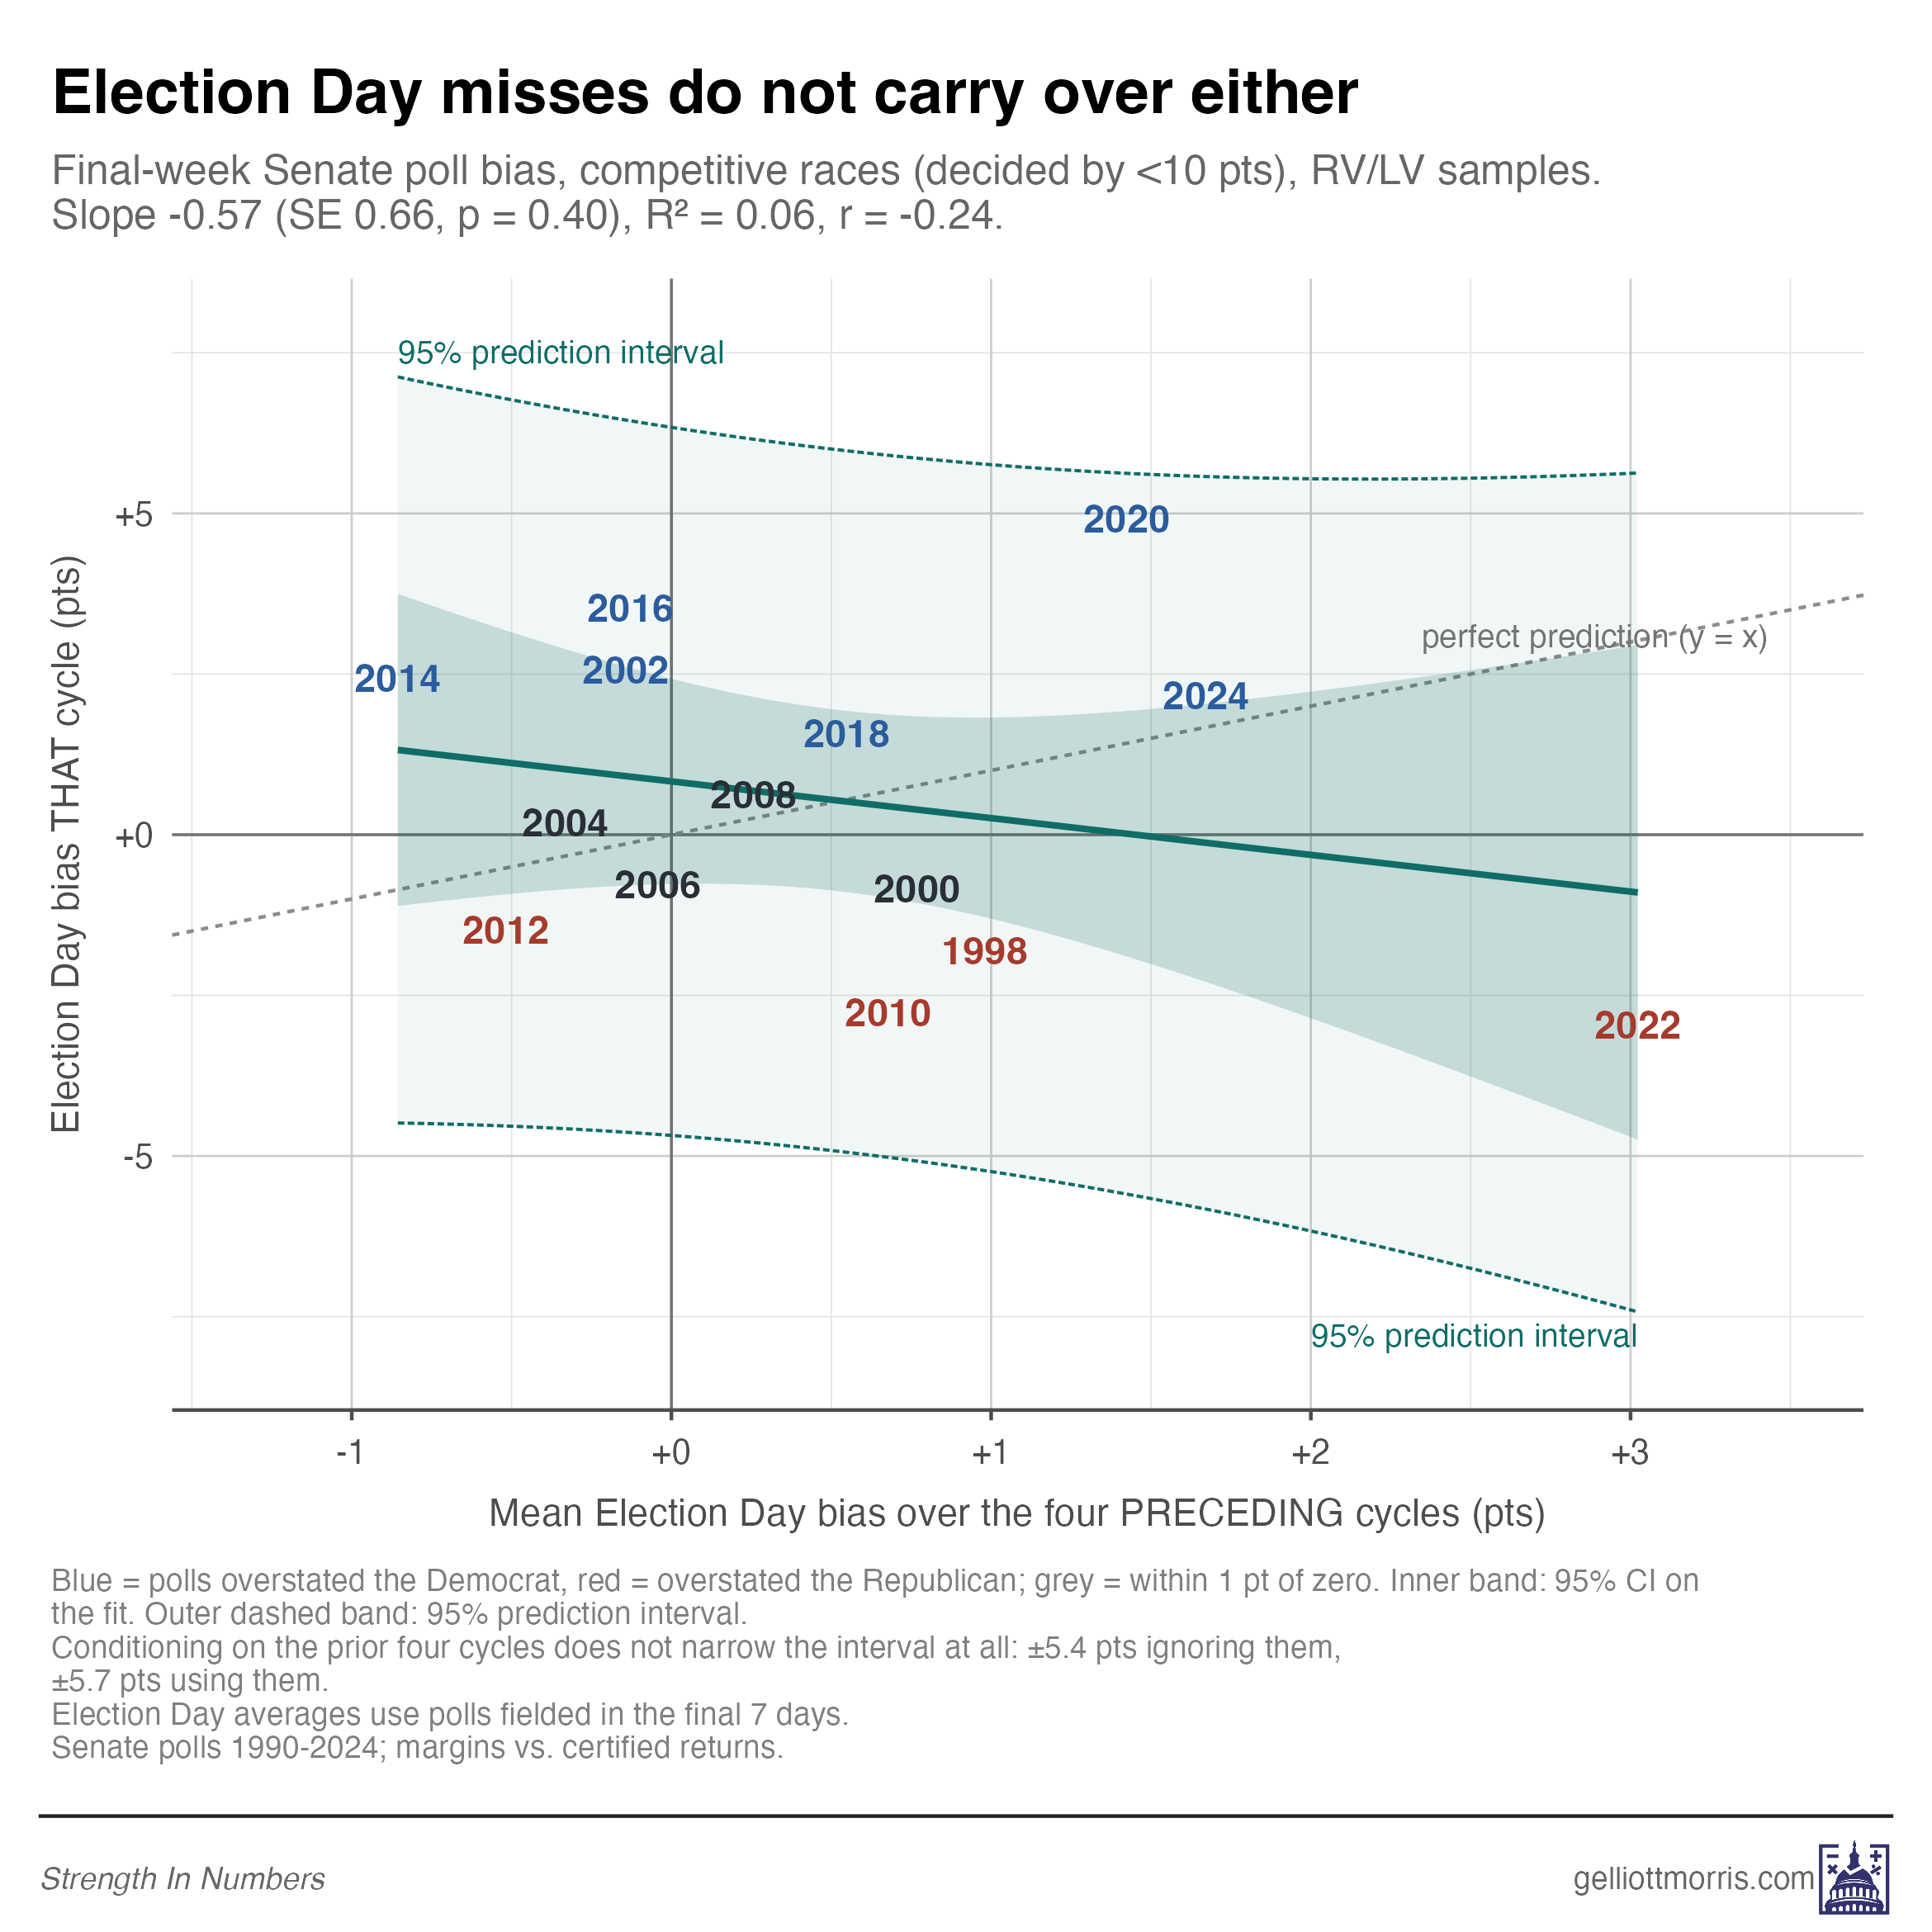
Check out 2022 there, on the far bottom right of the graph. The lagged bias then predicted a 3-point overestimation of Democrats in Senate races, but the bias ended up by a 3-point miss in the opposite direction. If you had adjusted polls for past bias in 2022, you would have massively messed up your election predictions based on those polls.
And this is the finding that really matters — because if you’re going to put your thumb on the scale for a party, you want there to be a close to zero chance of causing a larger error than if you had left the polls alone. We can test this too.
“Unskewing” also introduces high “risk of ruin”
I went back to my historical dataset of polling averages, took the lagged bias values from the first table of this post, added those lagged direction biases to the polls in each year, and then calculated the average bias of the resulting polls. Then I did the same thing, assuming no average bias in the polls.
The chart below shows the distribution of signed error in Senate polling averages under each scenario, and for polls as of August and November.
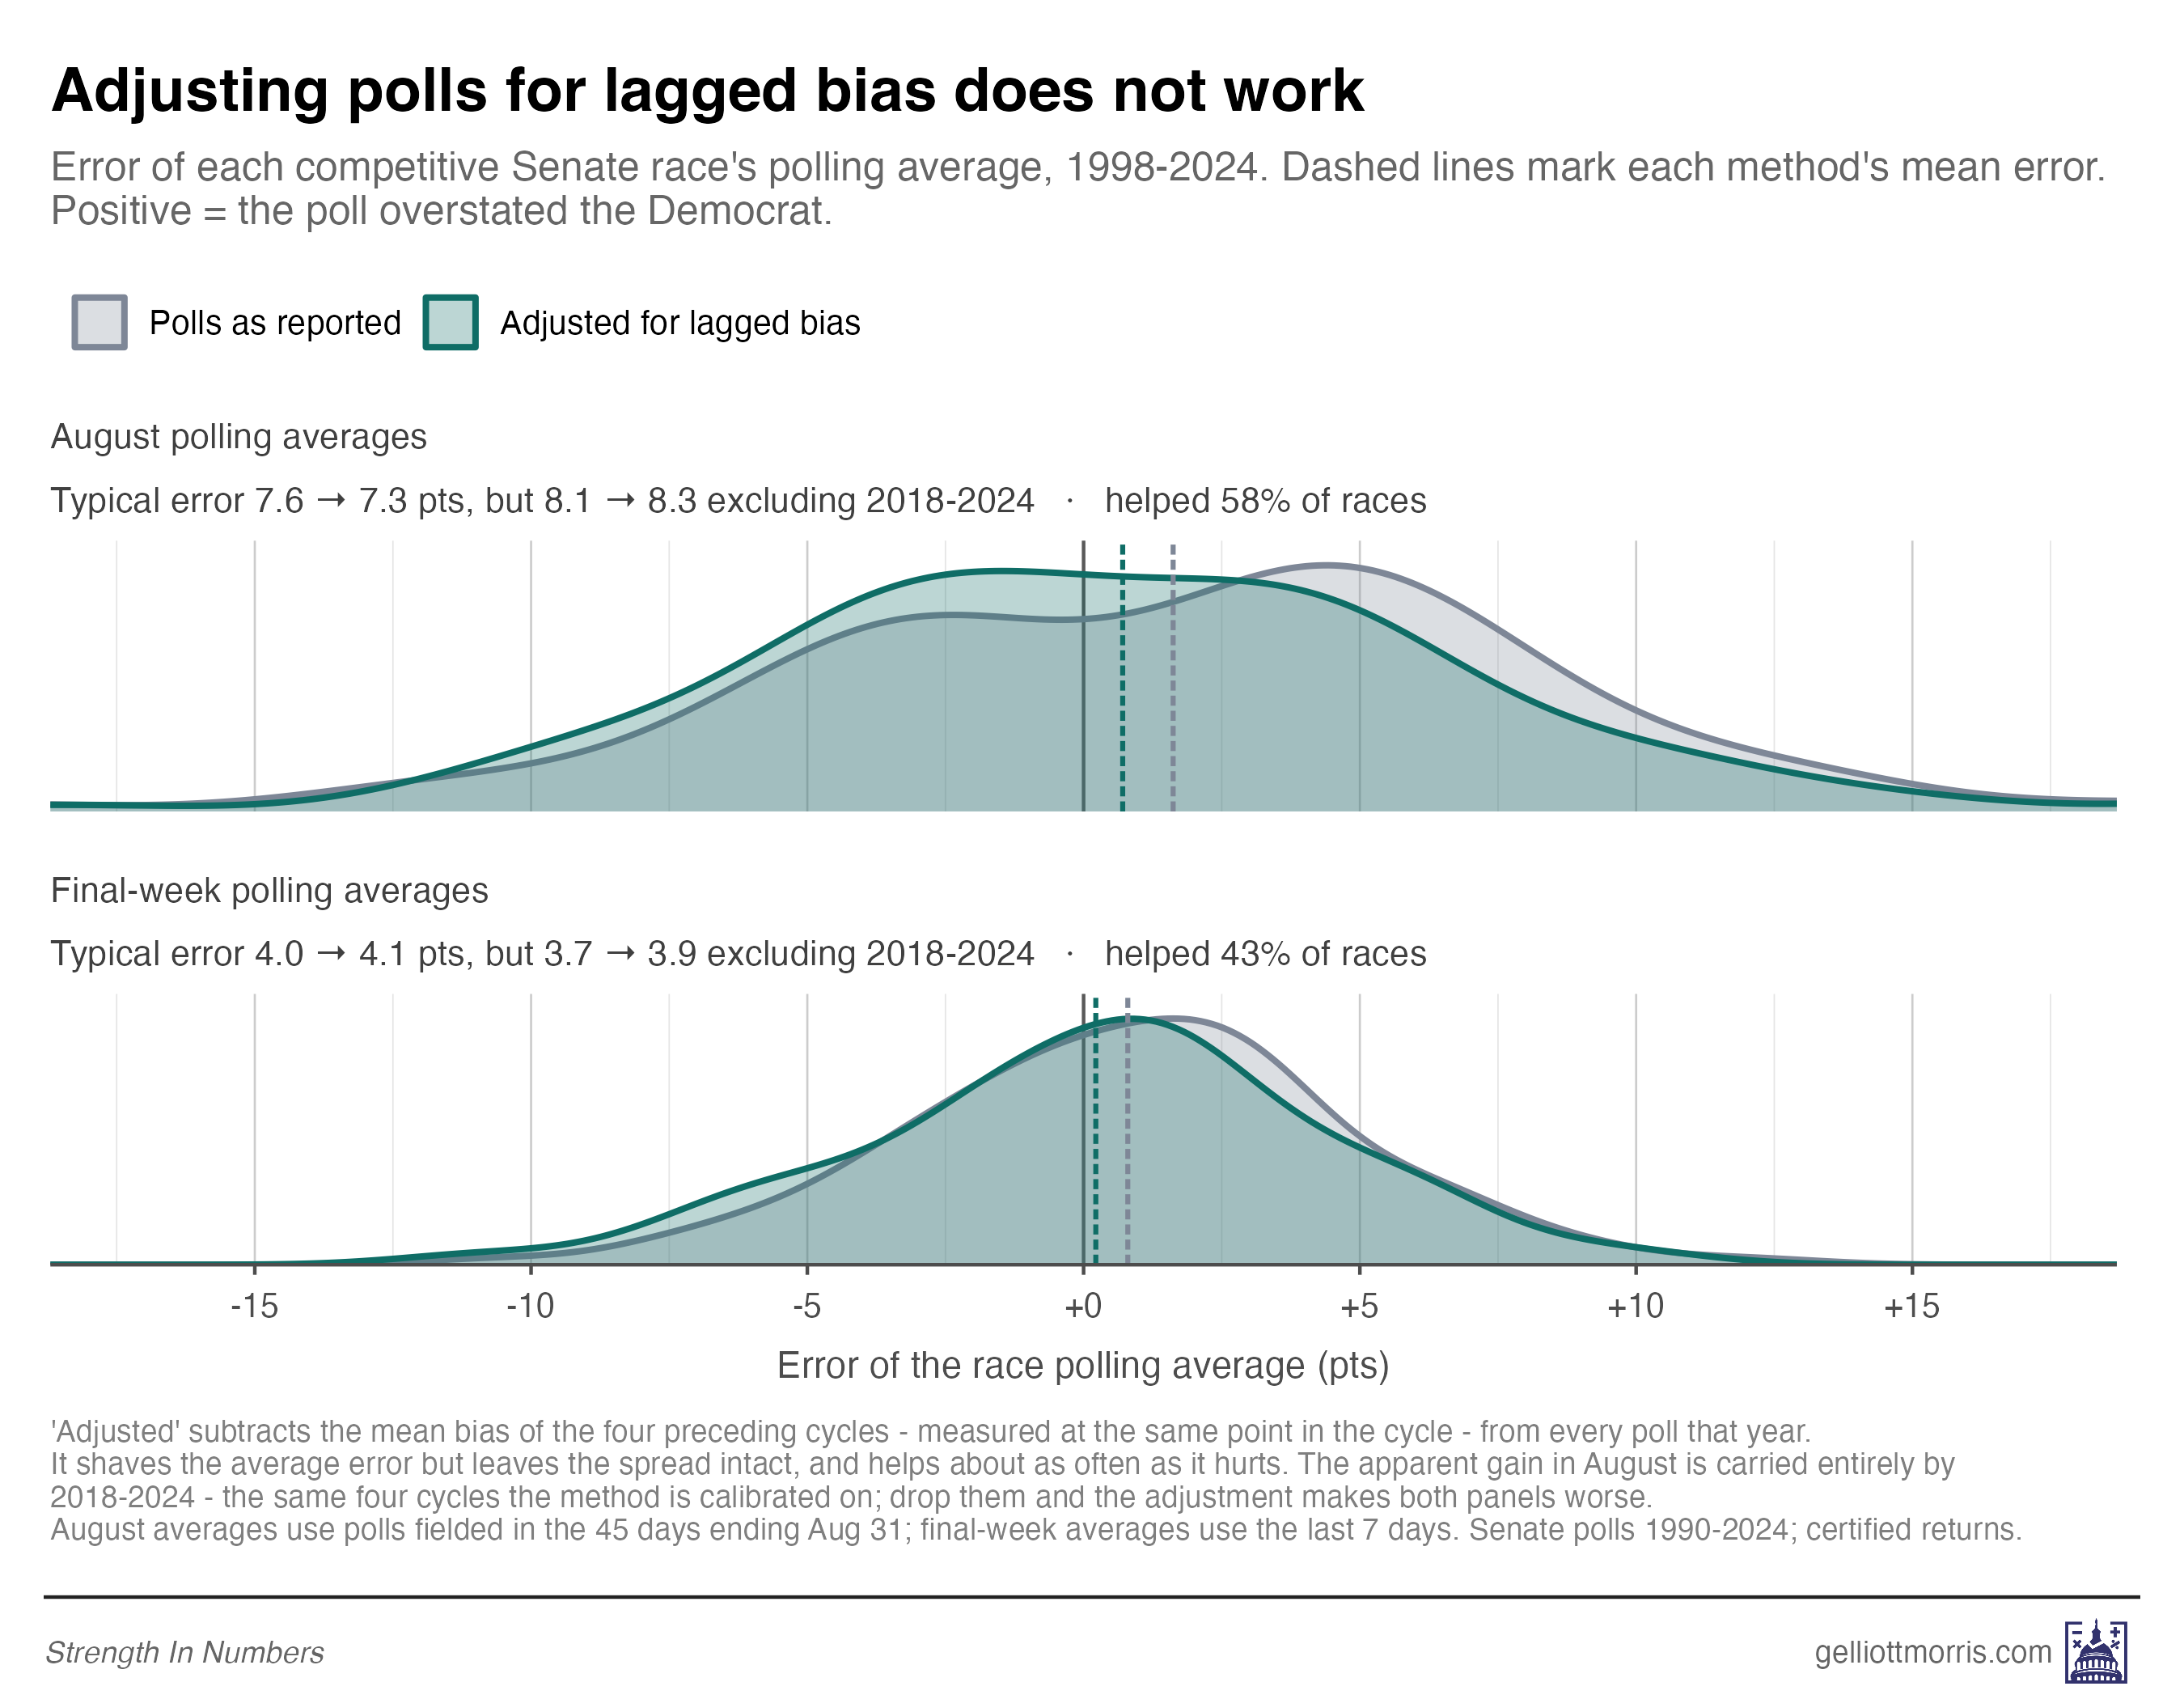
Note that the adjusted polls do not systematically outperform the unadjusted polls — and in many cases actually do worse. Since polls tend to do well or poorly across the country by similar amounts each cycle, this thumb-on-the-scale adjustment of polls also creates the problem that a forecaster releasing adjusted numbers tends to increase all their errors across all races at the same time.
The 2022 election is a good example of this. If one were to have calculated averages in each Senate race and then subtracted out the bias in polls from 2014-2020 from them, one of have pushed all the polls to the right by exactly 3 percentage points. This would have increased your error in 8 out of 8 key Senate races, and called 4 races for Republicans that polls said Democrats lead in.
If that sounds familiar to you, it’s exactly what RealClearPolitics did in 2022. I wrote about how stupid this was while it was happening here. Back then, I wrote:
These results suggest that if RCP repeated its adjustment procedure for all Senate elections since 2002, they would have ended up with more biased polling averages than if they had stuck with the raw average in 7 of the last 10 election cycles. The only years in which their adjustment would have made their averages more accurate are 2010, 2012 (barely) and 2020
For Senate races in August, adjustment would have improved your forecasts in 9 out of 14 of the last elections and worsened them in 5/14. By Election Day, the results flip, and an adjustment would have cost you in 10/14! In those races, it would have been better for you to leave the polls alone and focus on measuring uncertainty, not predicting bias.
Why 2026 may be different
Zooming out before conclusion, it’s worth a couple of paragraphs to think about the mechanisms of “error” here. Looking back at Ruffini’s chart, why was there such a reliable shift from August to Election Day in 2018-2024?
Well, one thing to say is that early polls are not meant to perfectly predict election outcomes. Voters’ preferences can change over the campaign as they tune in to information and socialize about key races. Some of this “error” in August polls is likely measurement error, I grant that — but it’s also the case that it’s truly just pretty early in the campaign still. Most people are checked out until after Labor Day.
But another plausible reason is that early polls tend to sample adults or registered voters instead of likely voters. But as Election Day approaches, pollsters tend to make the switch to the more accurate voter screen.
In the past few cycles, Democrats were doing better in RV and A polls than in polls of likely voters. So the LV switch produced a natural curve to the right that made it look like Democrats were losing ground — when in reality, their support in early polls was inflating because they sampled the wrong populations.
But, as Ruffini’s own polls have shown, this is not the case for 2026. Democrats are doing about a point better in LV polls vs adult and RV samples this year. So one could even argue we should naturally see the opposite drift this year as pollsters switch to LV screening.
In 2022, you also had Dobbs in the summer, which delayed but did not eventually disrupt the typical midterm dynamic of the party in power losing ground as Election Day approached. There is no Dobbs in 2026 disrupting that cycle, so the data points from that summer may be useless in anticipating potential poll bias.
Still, none of this should be read as me arguing that the polls are all fine and affirmatively won’t be biased come November. Early polls will not be a perfect prediction of the November election results — that much we know pretty much for sure.
This is a good reason not to take the polls at face value and to instead use something like the FiftyPlusOne.news election forecast that (a) simulates uncertainty in polls according to this exact historical distribution of error and (b) combines the polls with other predictors of election outcomes, including “the fundamentals” (past district history, incumbency status in a seat, etc) and race ratings.
In sum, it is undisputed that polls have been trending in a pro-Democratic direction recently. But that does not mean that they are reliably biased in a knowable direction, such that you can subtract the error in advance and arrive at an unskewed result. Ruffini argues that Senate polls are “always worse in the summer.” This is true with his limited post-2018 data, but it is not supported by a full historical study back to 1998.
Adjusting your polls in the way Ruffini’s findings imply you should would have made your forecasts worse in many key races — including in 2022, when early polls forecast Democrats would hold onto their majority in the U.S. Senate, which they ultimately did.
Given the stakes of elections today (and frankly, the reward in making overconfident forecasts months out), it is tempting to try to forecast future polling misfires using those in the recent past. But the historical evidence suggests this is a fool’s errand. After all, predictions are hard, especially about the future.
If you believe in the importance of data-driven coverage of polling and public opinion, the best way to support my work is with a paid subscription to this newsletter.


As usual, stellar analysis.
Thanks for always educating us as you explore the nagging questions surrounding polling.