


This article reports results from the August 2026 Strength In Numbers/Verasight poll. A methodology description is included at the end of this article. You can find toplines for this as well as our previous poll releases at the Strength In Numbers polling portal.
Paying subscribers to Strength In Numbers have access to additional visuals and a full archive of crosstabs here, and can suggest questions for future polls in the comments section below!
On Aug. 13, the Department of Homeland Security announced there had been 15 straight months with zero releases of migrants at the southern border, part of a crackdown the administration says has cut daily apprehensions by 94% from the last year of the Biden administration. DHS says the border is secure for the first time in a generation.
Yet voters do not view the president’s handling of the situation positively.
In our new Strength In Numbers/Verasight poll, fielded Aug. 14–19, President Donald Trump’s net approval on border security — his best issue in this tracker for most of the past year and a half — fell to −5, the worst mark we’ve recorded on it and now squarely net-negative. Every one of the 12 issues we test is now underwater, and not one of them improved this month.
The president heads into the home stretch of the midterm elections at nearly a high point for intensity of opposition to him. In our new poll, the gap between Americans who strongly disapprove of him and those who strongly approve is now nearly 3-to-1. The movement against the president is now primarily in his own coalition, with significant softening in the share who say they “strongly support” the job he’s doing over the last two months.
Below, I report full results from our monthly Strength In Numbers/Verasight political tracking survey, including where prices and inflation now stand, how the generic ballot looks, and what voters told us about the direction of the country.
Headline poll findings
Job approval: Trump’s job approval this month is 37% approve / 60% disapprove (net −23), down from −21 in July. 49% strongly disapprove of his job as president vs. 17% who strongly approve.
Intensity: that’s a 32-point gap between strong disapproval and strong approval — nearly 3-to-1 — up from a 22-point, 2-to-1 average across all of 2025. Only 47% of Trump’s own approvers feel strongly about it now, down from 54% last year.
Every issue is underwater: Trump is now net negative on all 12 issues we test. Border security, the last one standing, fell from +1 in July to −5 — its worst reading yet.
Prices: net −48, a new record low in our tracker, down 6 points from July’s −42. Just 24% approve; 73% disapprove.
Generic ballot: Democrats lead 49–43 among registered voters (D+6), equivalent to June’s lead. They’ve now led in all 15 polls we’ve run since May 2025.
Party trust: Democrats lead on 8 of 12 issues, and by 10 points (46–36) on voters’ own most important problem. The party now nearly matches the Republicans on trust to handle immigration and deportations.
Direction of the country: 52% of U.S. adults say things are “going poorly” in the country and “major, disruptive changes are needed” — roughly the same as 49% in July. Just 7% say things are going well.
Top problem: 37% name prices/inflation as the single most important problem facing the country — and it’s the No. 1 problem for Republicans (36%), Democrats (37%), and independents (38%) alike.
Select questions held for future release.
Independent polling like this only works if readers fund it. For $10/month (or $90/year), you’ll get the full crosstabs for every survey, the ability to submit subscriber-only poll questions, and the knowledge that you’re keeping this work free of corporate sponsors and Super PAC influence. Plus, you get access to premium articles like my weekly Deep Dive every Tuesday, other exclusive posts, and a community Discord server for like-minded readers.
Trump hits new low, now net-negative, on border security
Since Trump’s inauguration in 2024, border security had been the one issue on which his head was above water for most of the life of this tracker, as high as +11 in May 2025 and still positive at +1 in July.
But in August, Trump finally lost his last positive issue, falling to a new low of net −5 in our survey. That’s the worst number since Strength In Numbers began polling in May 2025.
This isn’t the first time Trump has polled underwater or even on every issue we test. That happened in February, March, and May of this year. What’s new is that this is the first survey where the president’s rating is clearly below zero on every issue.
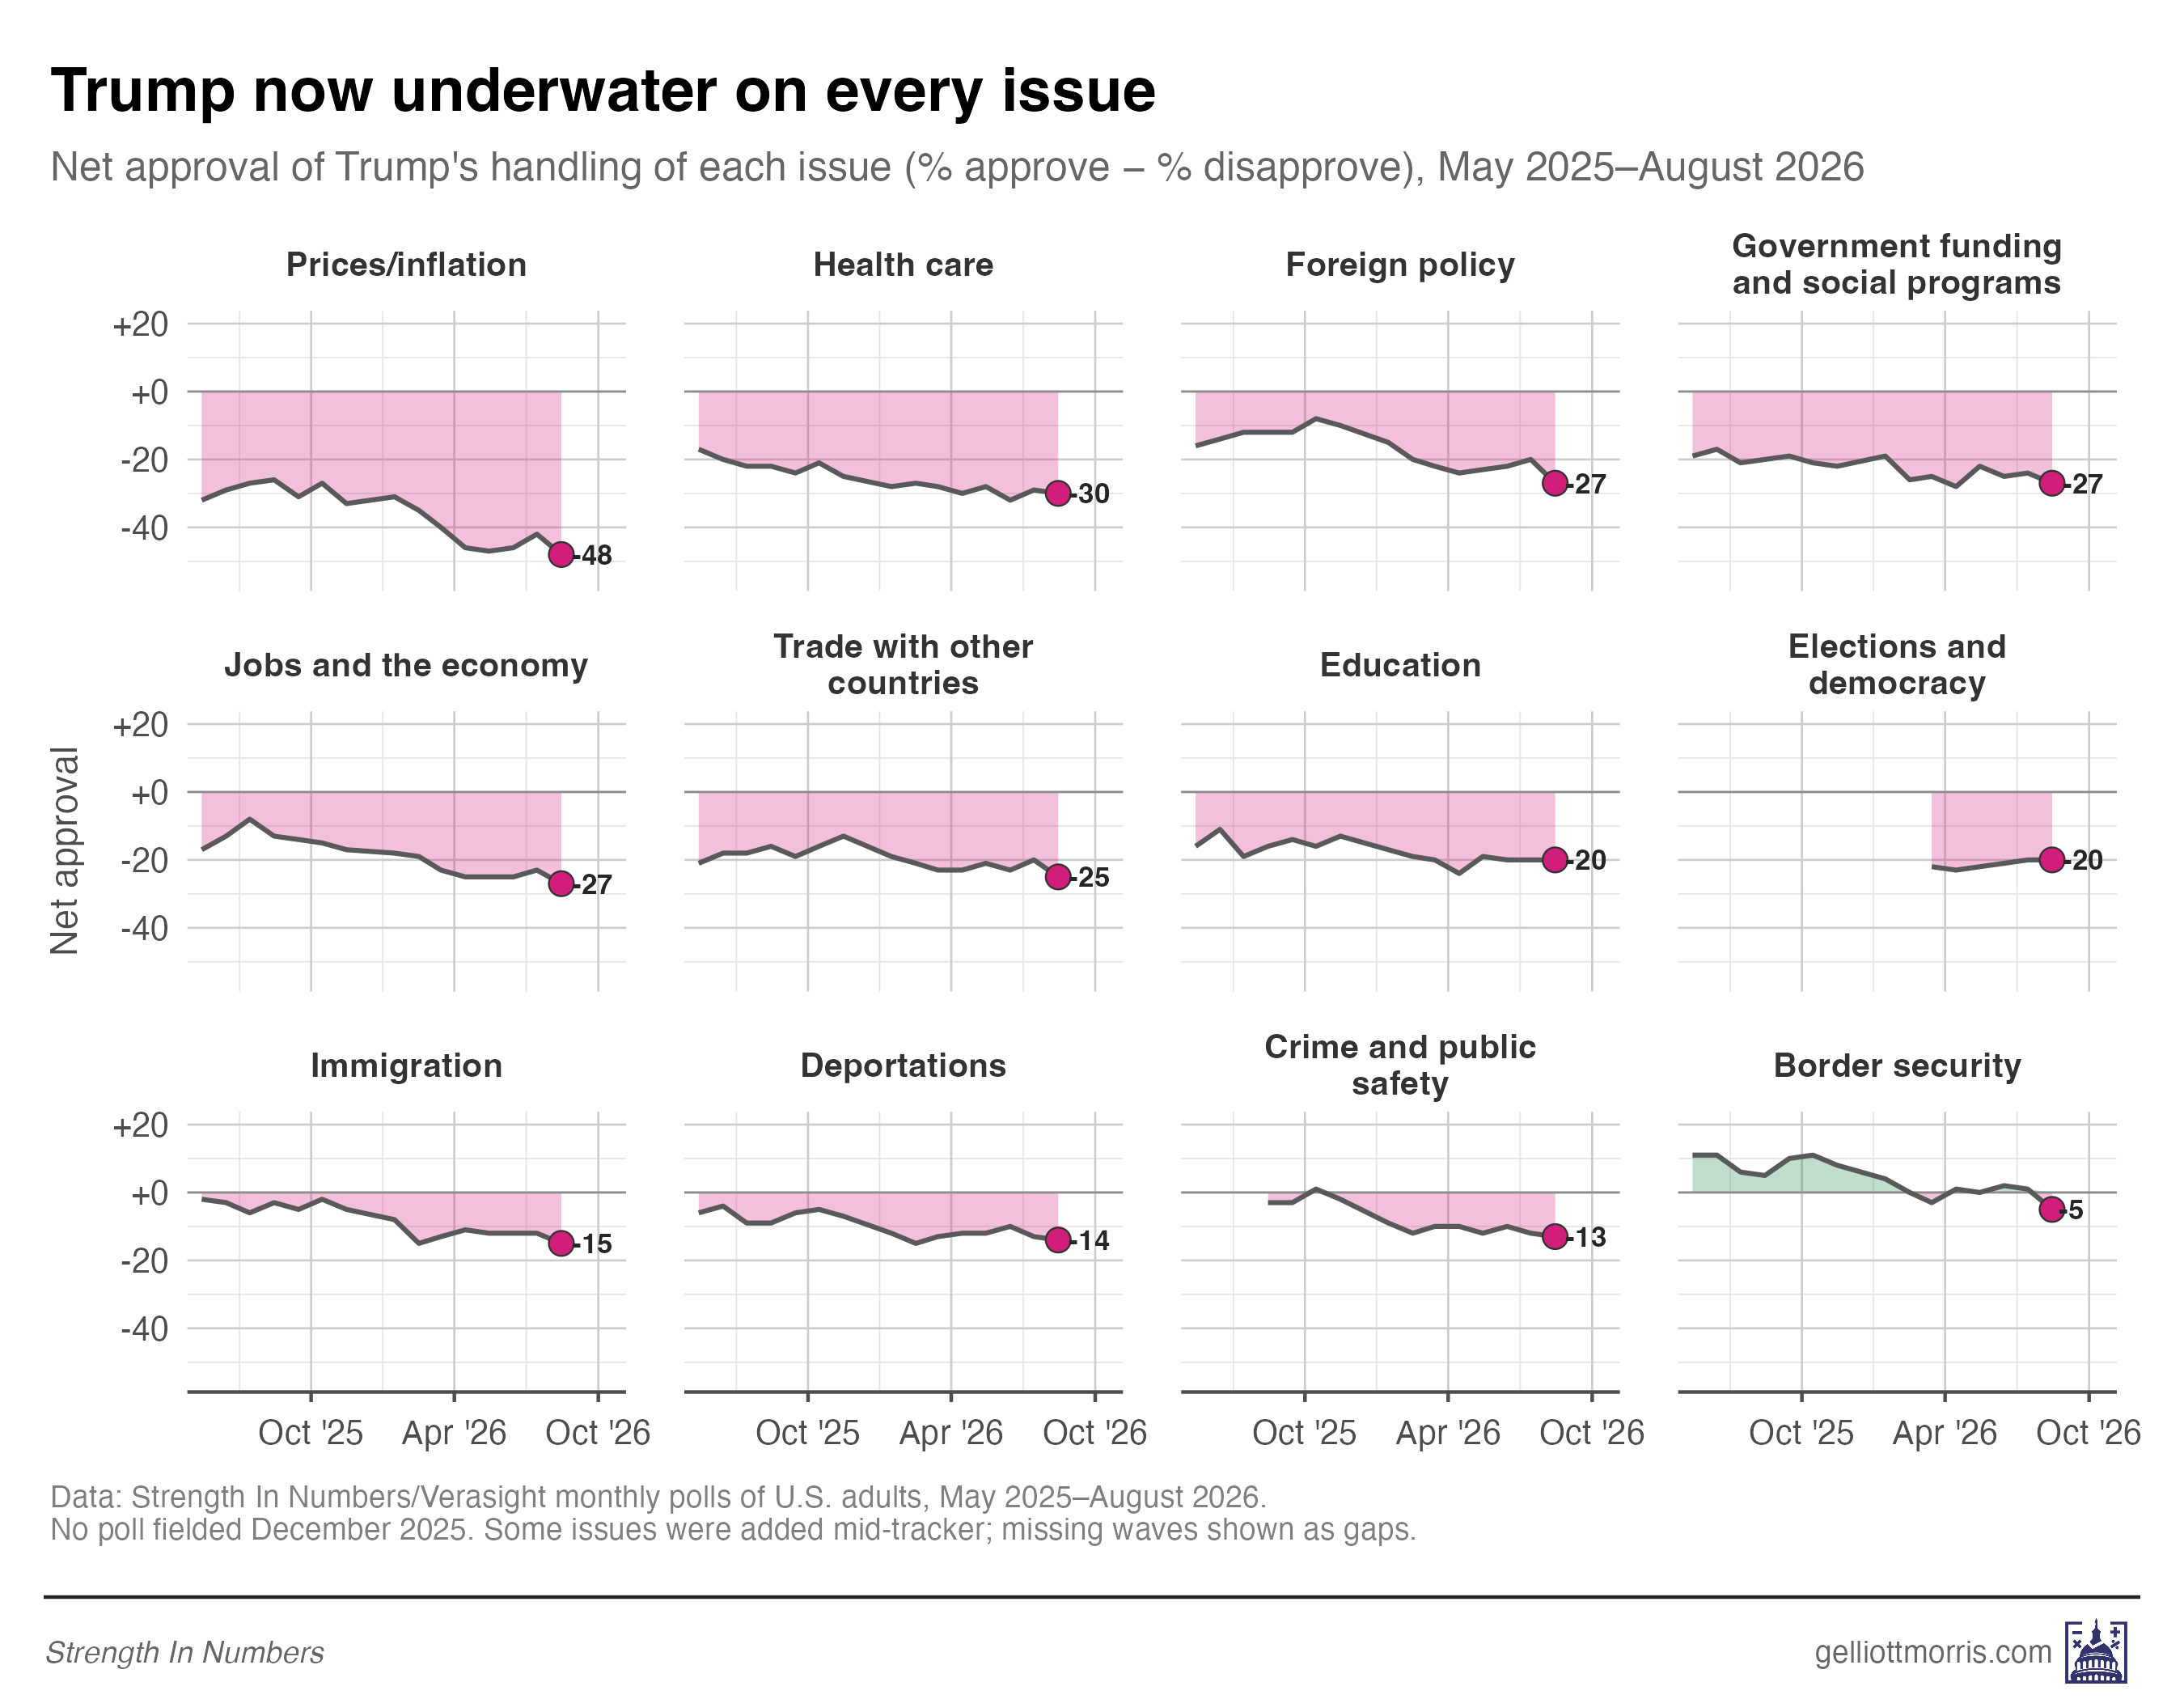
Trump saw some big dips elsewhere as well. His rating on foreign policy fell 7 points; prices and border security by 6; trade 5, and jobs and the economy 4. Only his ratings on education and elections and democracy held flat, and neither of those was in good shape to begin with.
Looking more closely at prices, Trump’s worst issue also got worse this month. Net approval on prices and inflation fell from −42 in July to −48, the lowest reading we’ve recorded on any issue in this tracker, beating the −47 set back in May. Just 24% of U.S. adults approve, and 72% disapprove of how the president is handling prices.
President Trump’s overall net approval also fell 2 points this month. Overall, 37% of adults approve, and 60% disapprove of the job Donald Trump is doing as president, a net of −23, down from −21 in July. That change is well within expected sampling variation, and still short of April’s −26 floor.
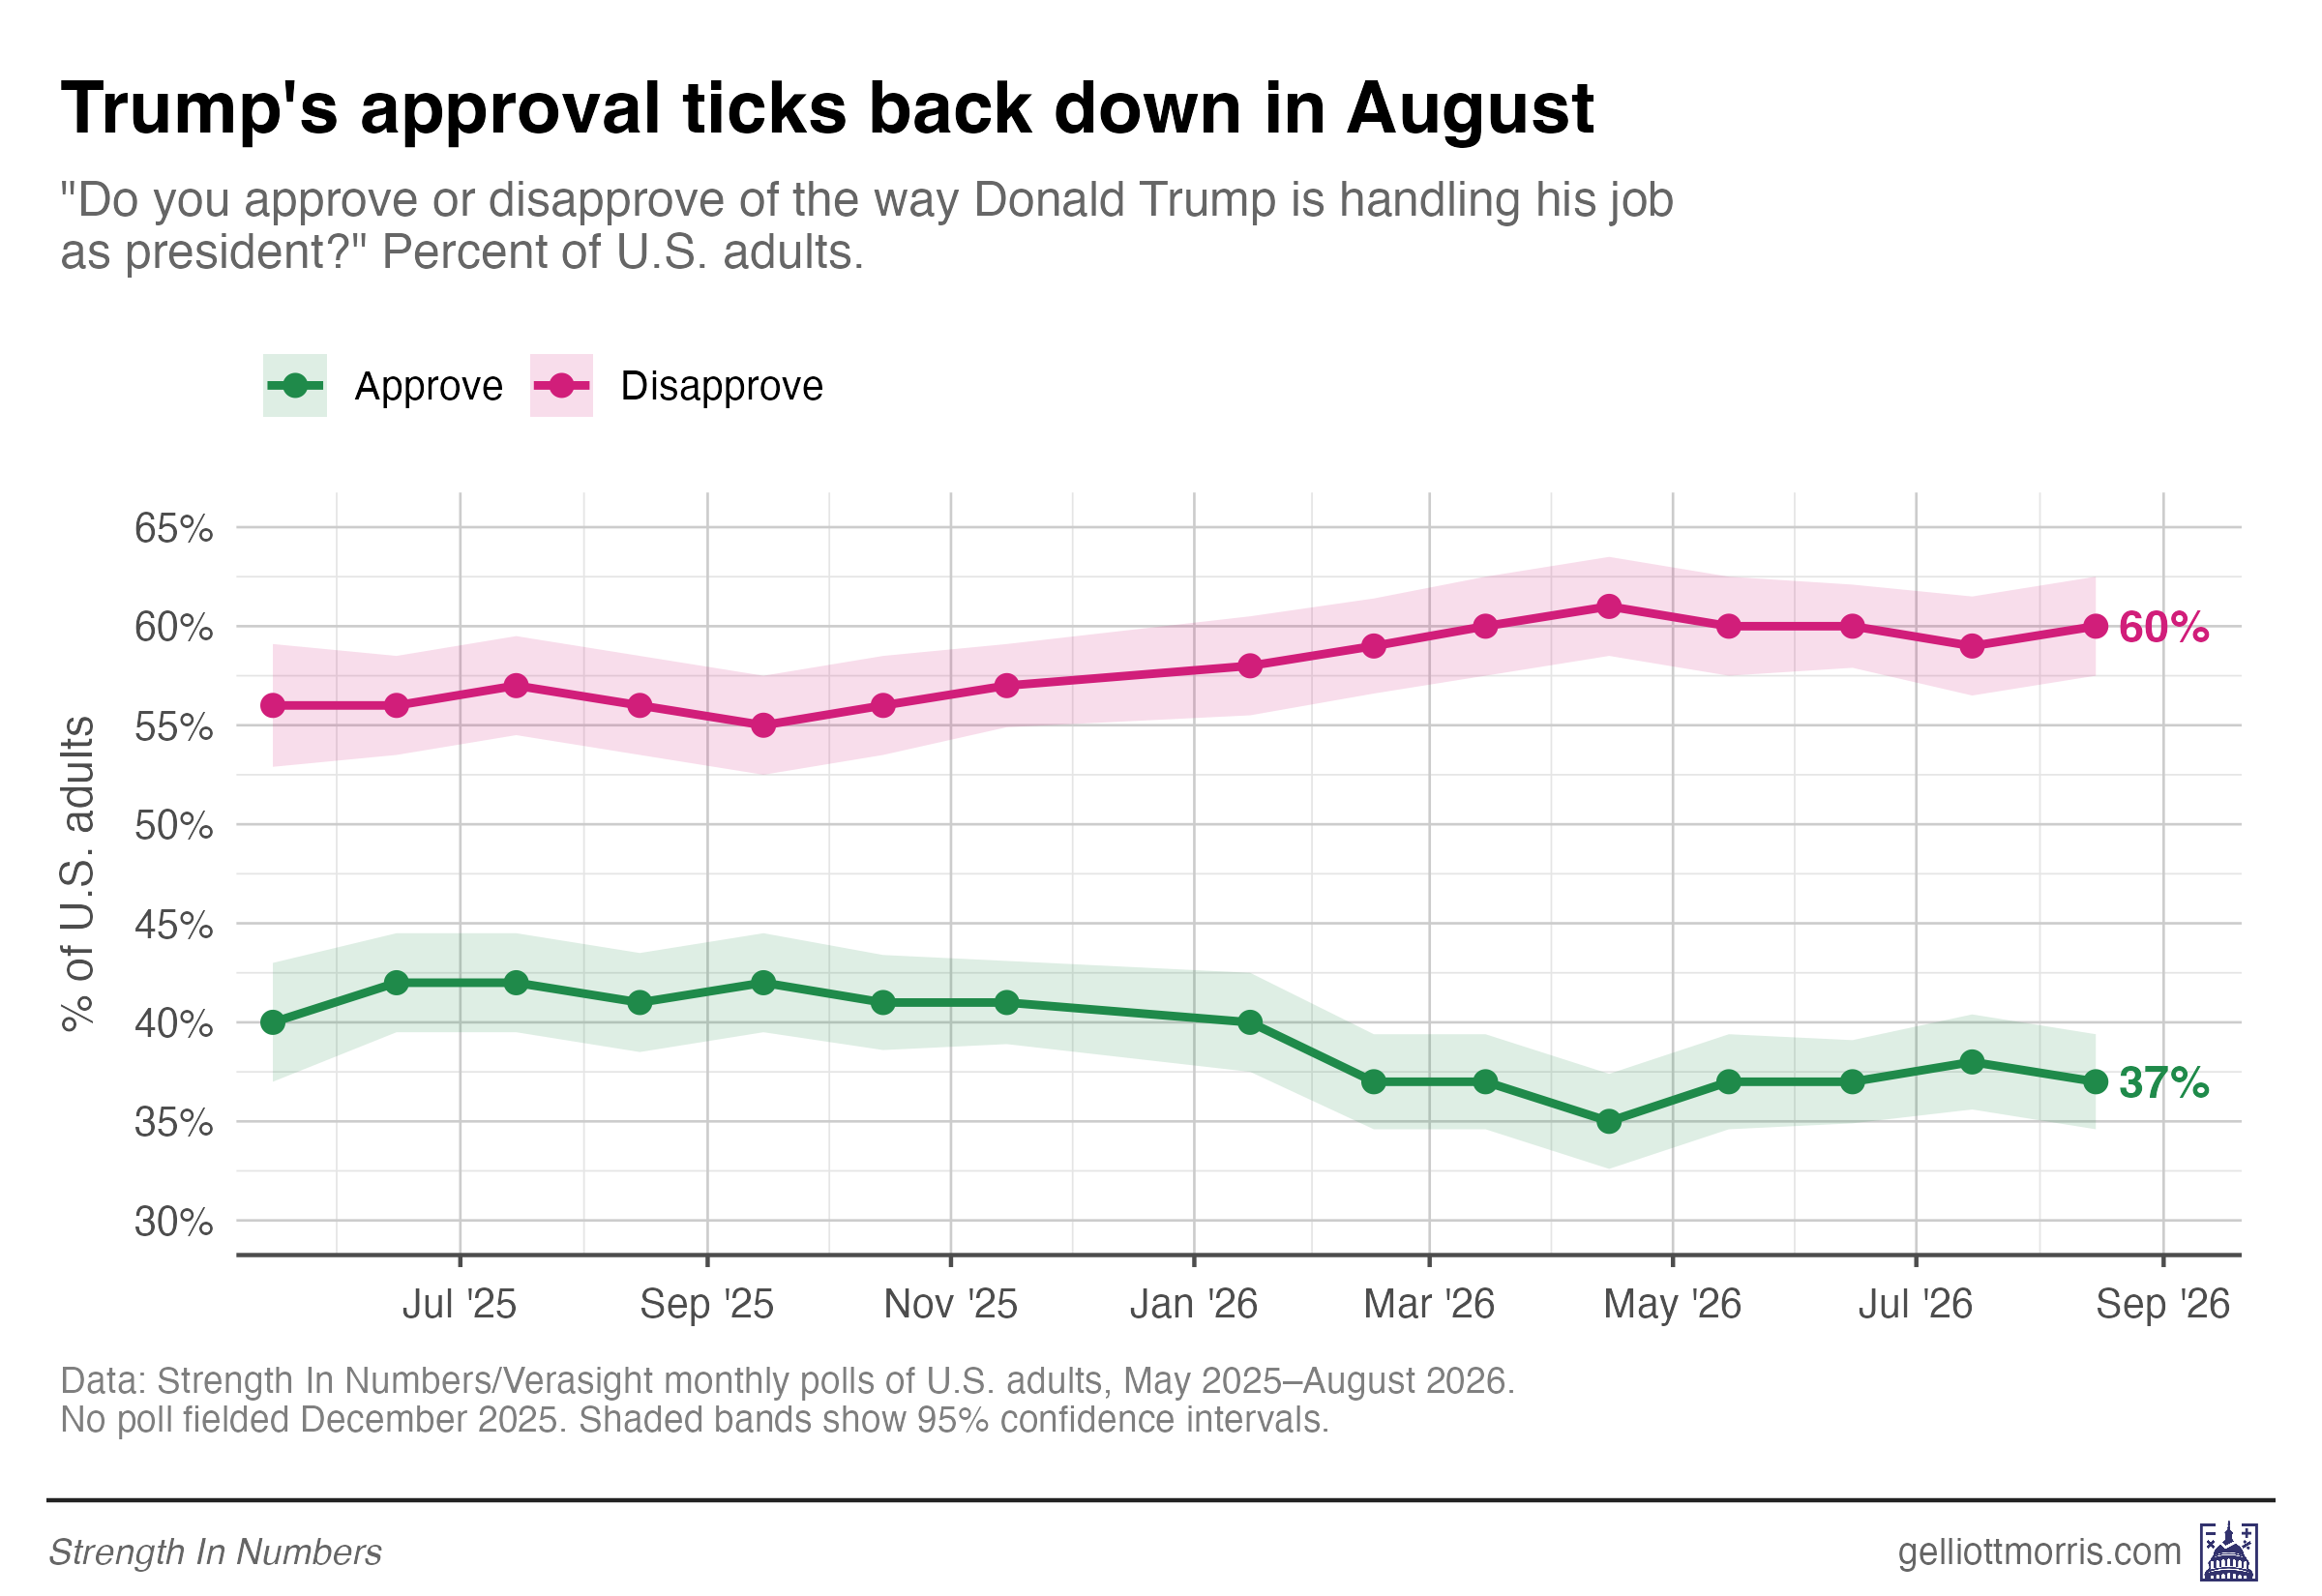
Trump’s overall net rating fell by 2 points, while five of these issue nets fell four points or more. Issue ratings are moving faster than the topline number, which may be a sign of erosion that hasn’t yet shown up fully in his approval rating.
Strong disapproval outnumbers strong approval by nearly 3-to-1
Nearly half the country does not merely disapprove of Trump, but disapproves strongly: 49% of adults strongly disapprove of how he is handling his job as president, against just 17% who strongly approve, a 32-point gap and a ratio of nearly 3-to-1.
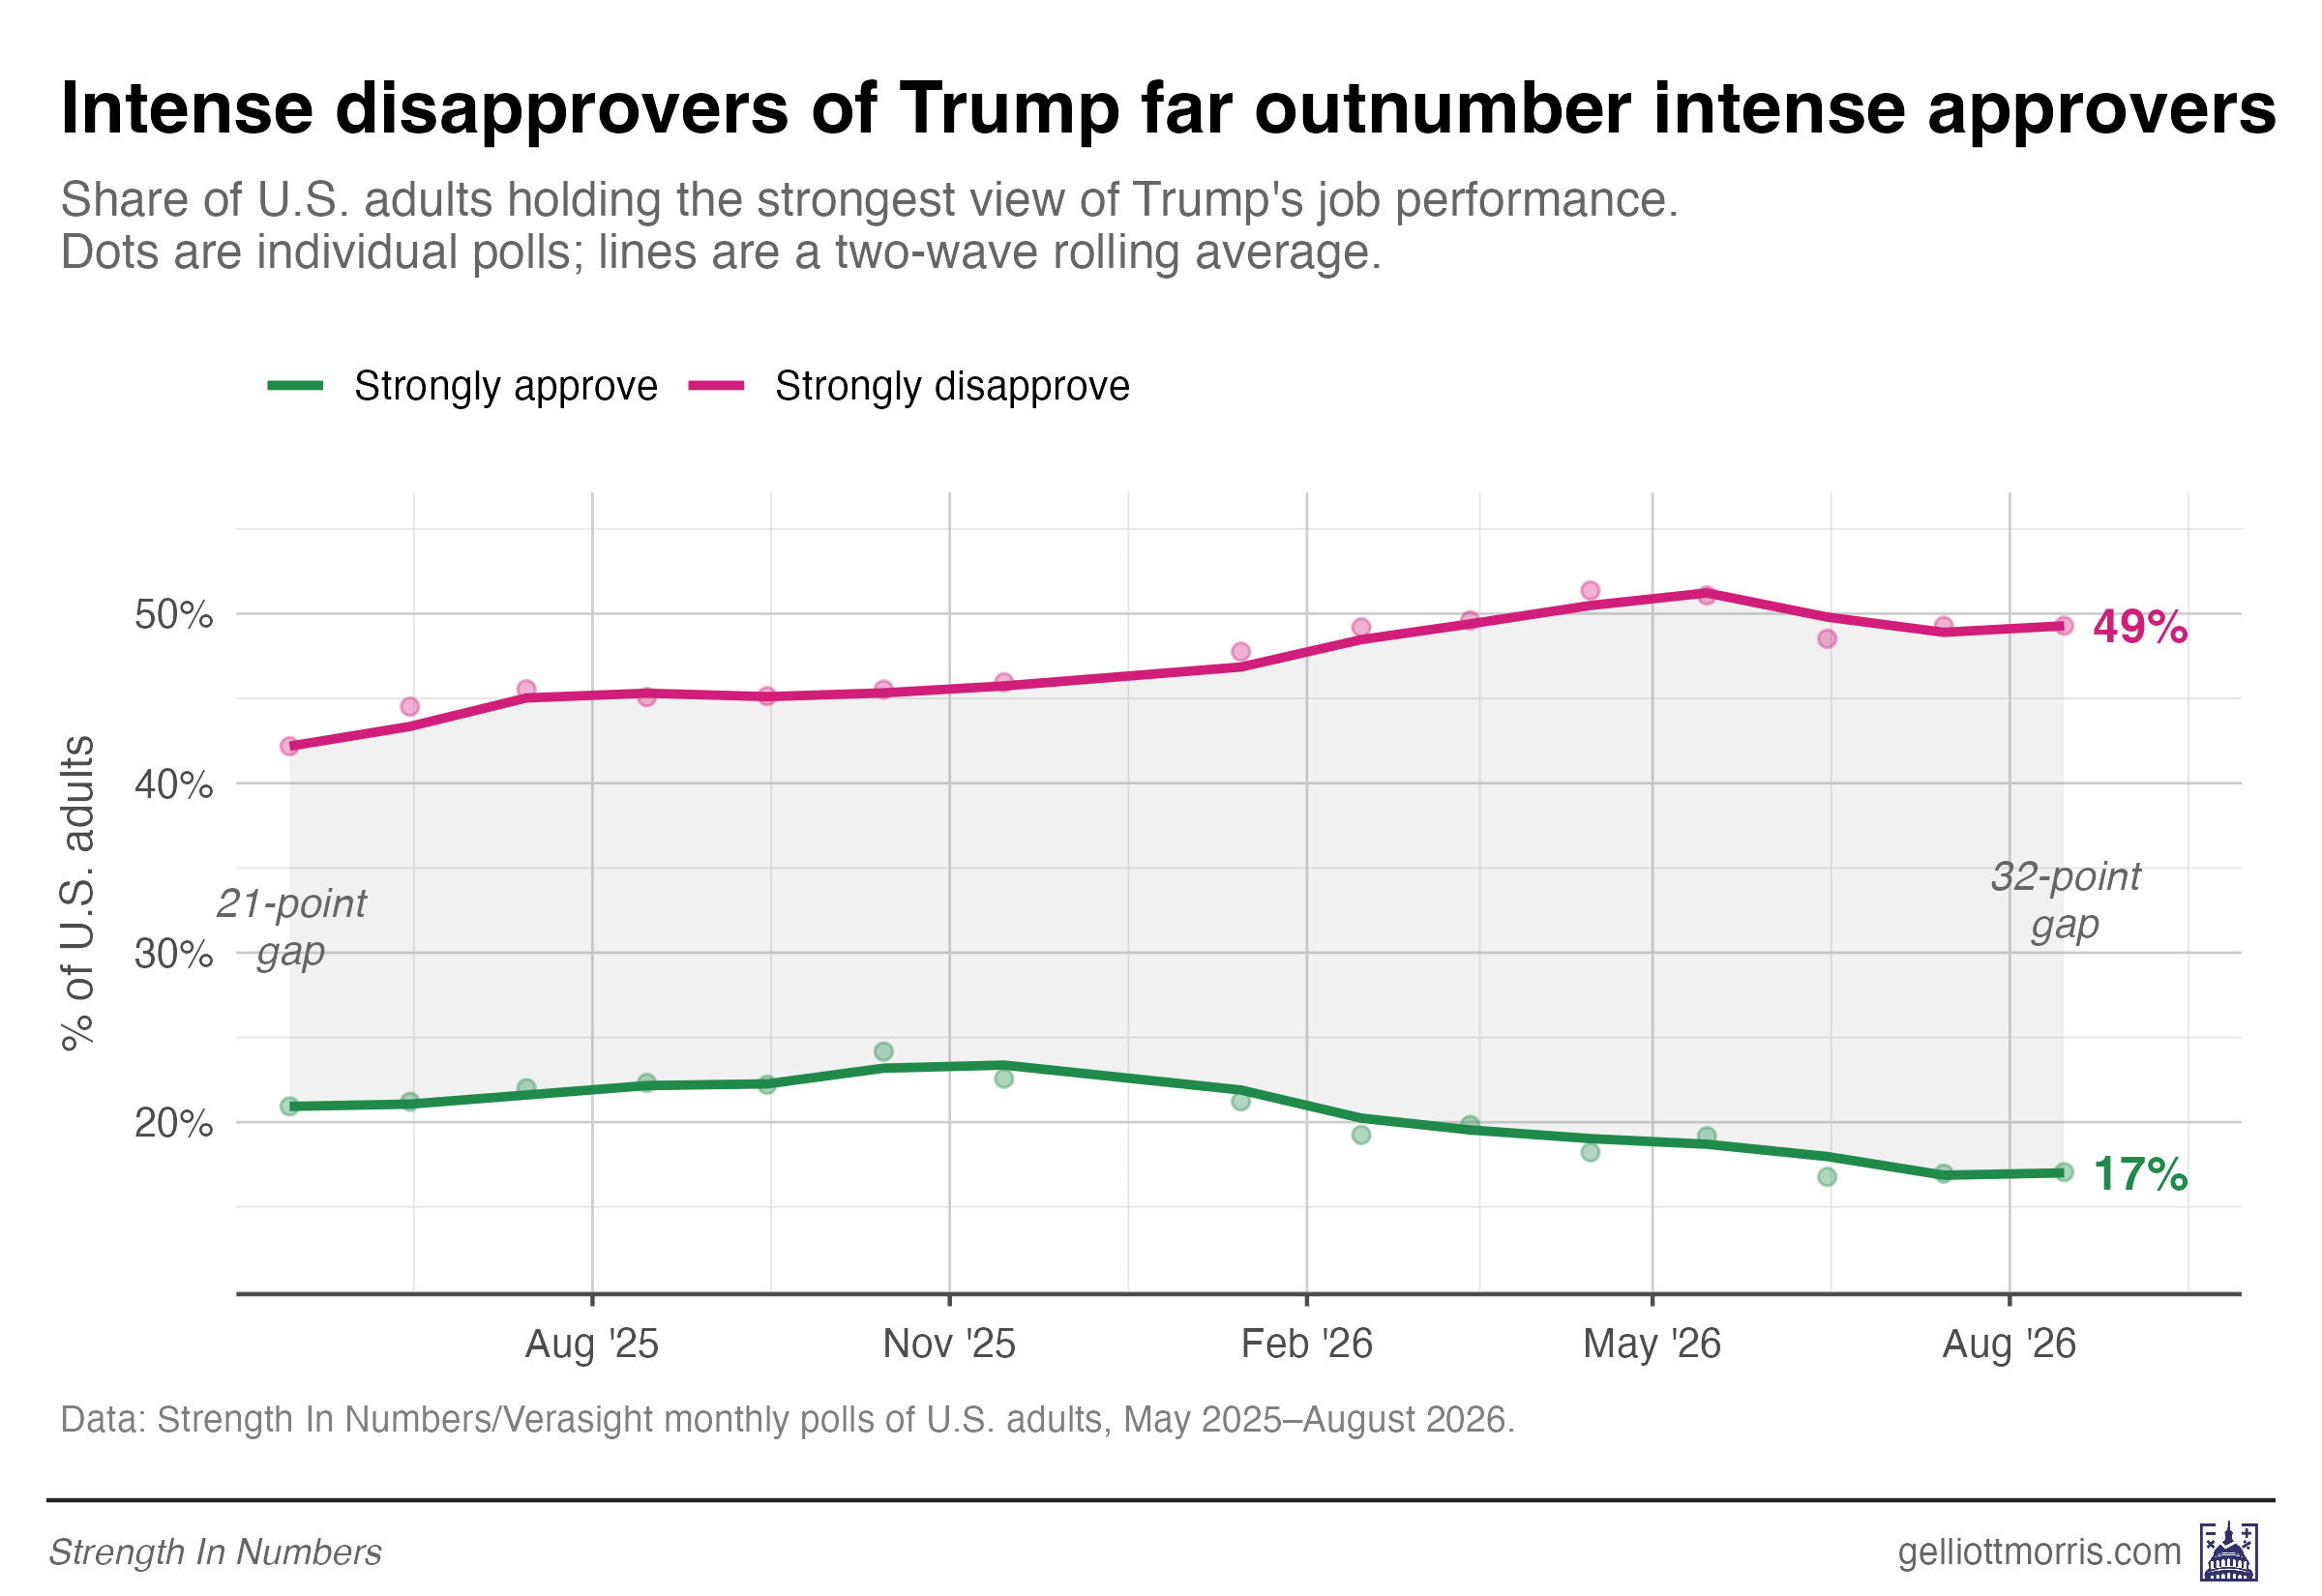
That ratio widened sharply through late 2025 and early 2026, and has held near its wider level since. Through 2025, strong disapproval averaged 44.8% against 22.2% strong approval — a gap of roughly 23 points, or 2-to-1. Across 2026, it has run 49.5% against 18.6%, a gap of nearly 31 points.
What has changed most in the last few months is on Trump’s own side: the share of his approvers who feel strongly about his performance fell from 54% in 2025 to under 47% now. As I wrote earlier this month, Trump and Republicans are getting squeezed from both ends; his own voters are cooling on him even as independents move toward Democrats. So his coalition did not just shrink; the remaining supporters have softened.
Prices are still the country’s top problem
37% of adults in our August data name prices and inflation the single most important problem facing the country, essentially unchanged from 36% in June and July. Elections and democracy are a distant second at 14%, jobs and the economy at 13%, and health care at 8%. When given the choice between three picks, 59% include prices among their top three problems, ahead of jobs (40%), health care (37%) and elections (24%).
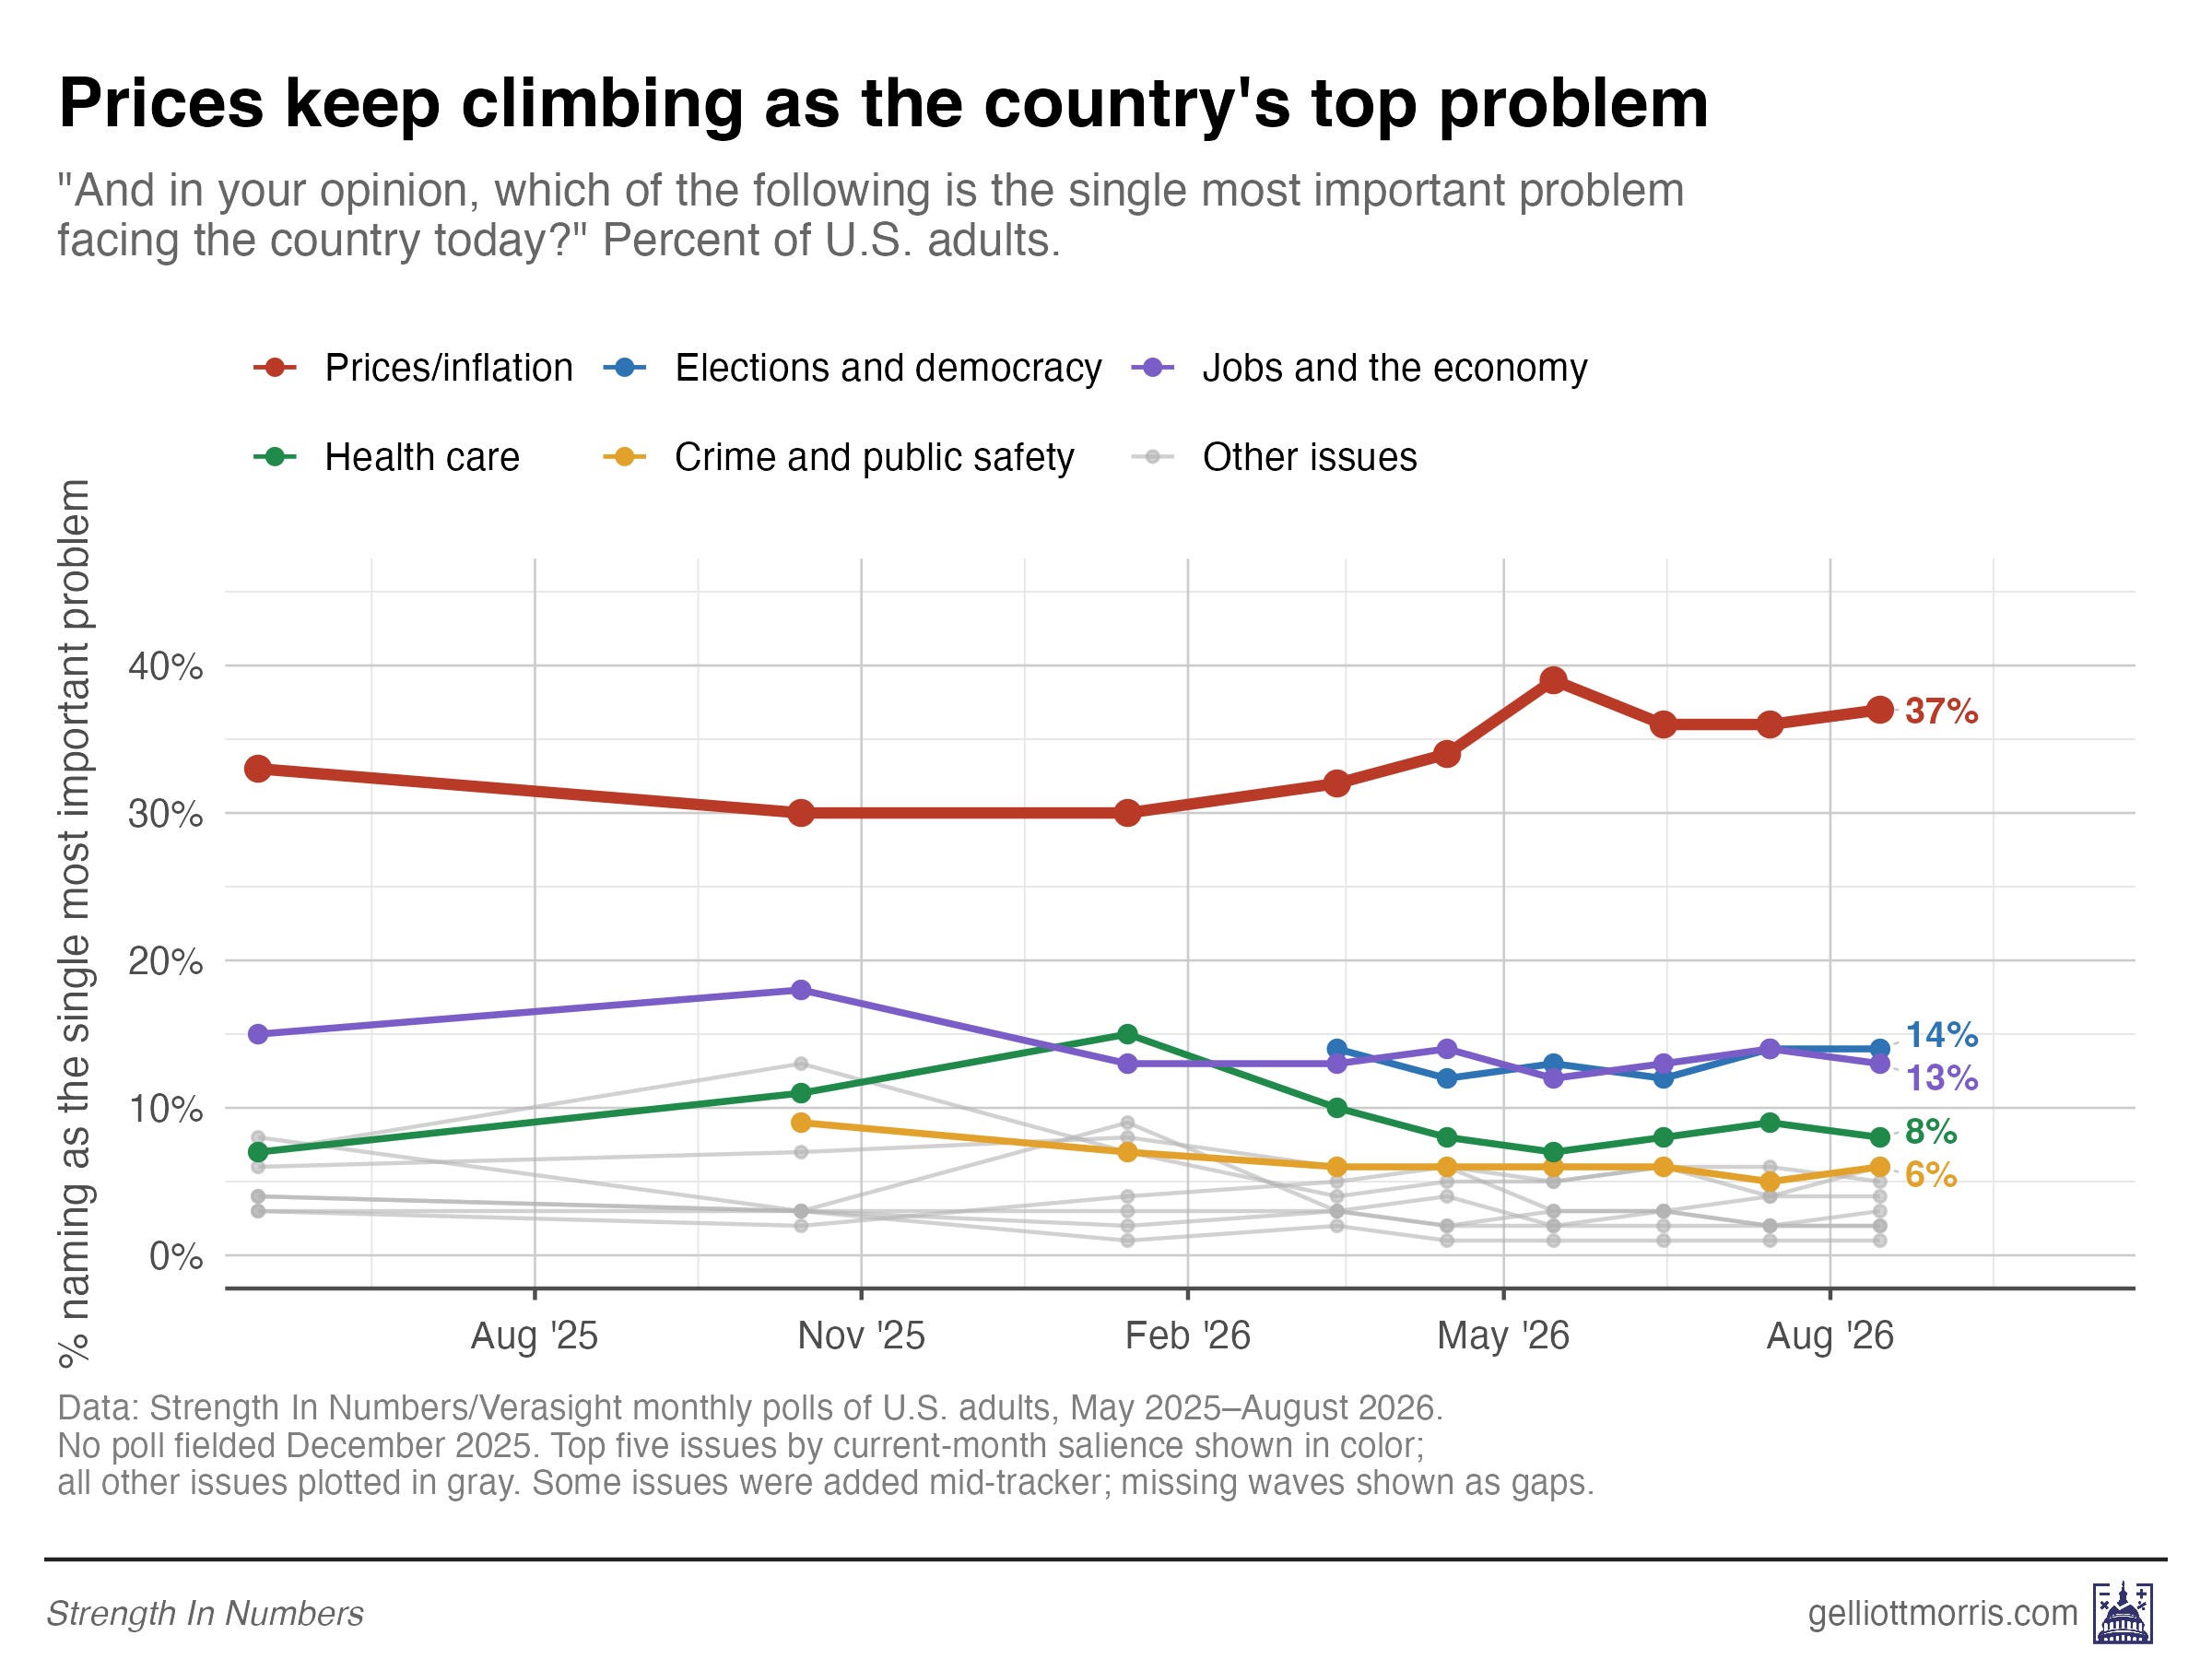
The cross-party agreement is the striking finding here. Prices are the top problem for Republicans (36%), Democrats (37%) and independents (38%) at nearly identical rates. On the country’s single biggest problem,m there is remarkable agreement across party lines. The disagreement is about who’s to blame and what to do about it.
Democrats still lead on the issues voters care about most
Democrats lead on partisan trust to handle 8 of the 12 issues we test, including every top-tier priority: health care by 22 points, government funding and social programs by 17, education by 15, elections and democracy by 10, prices by 9, jobs by 7, trade by 7, and foreign policy by 6.
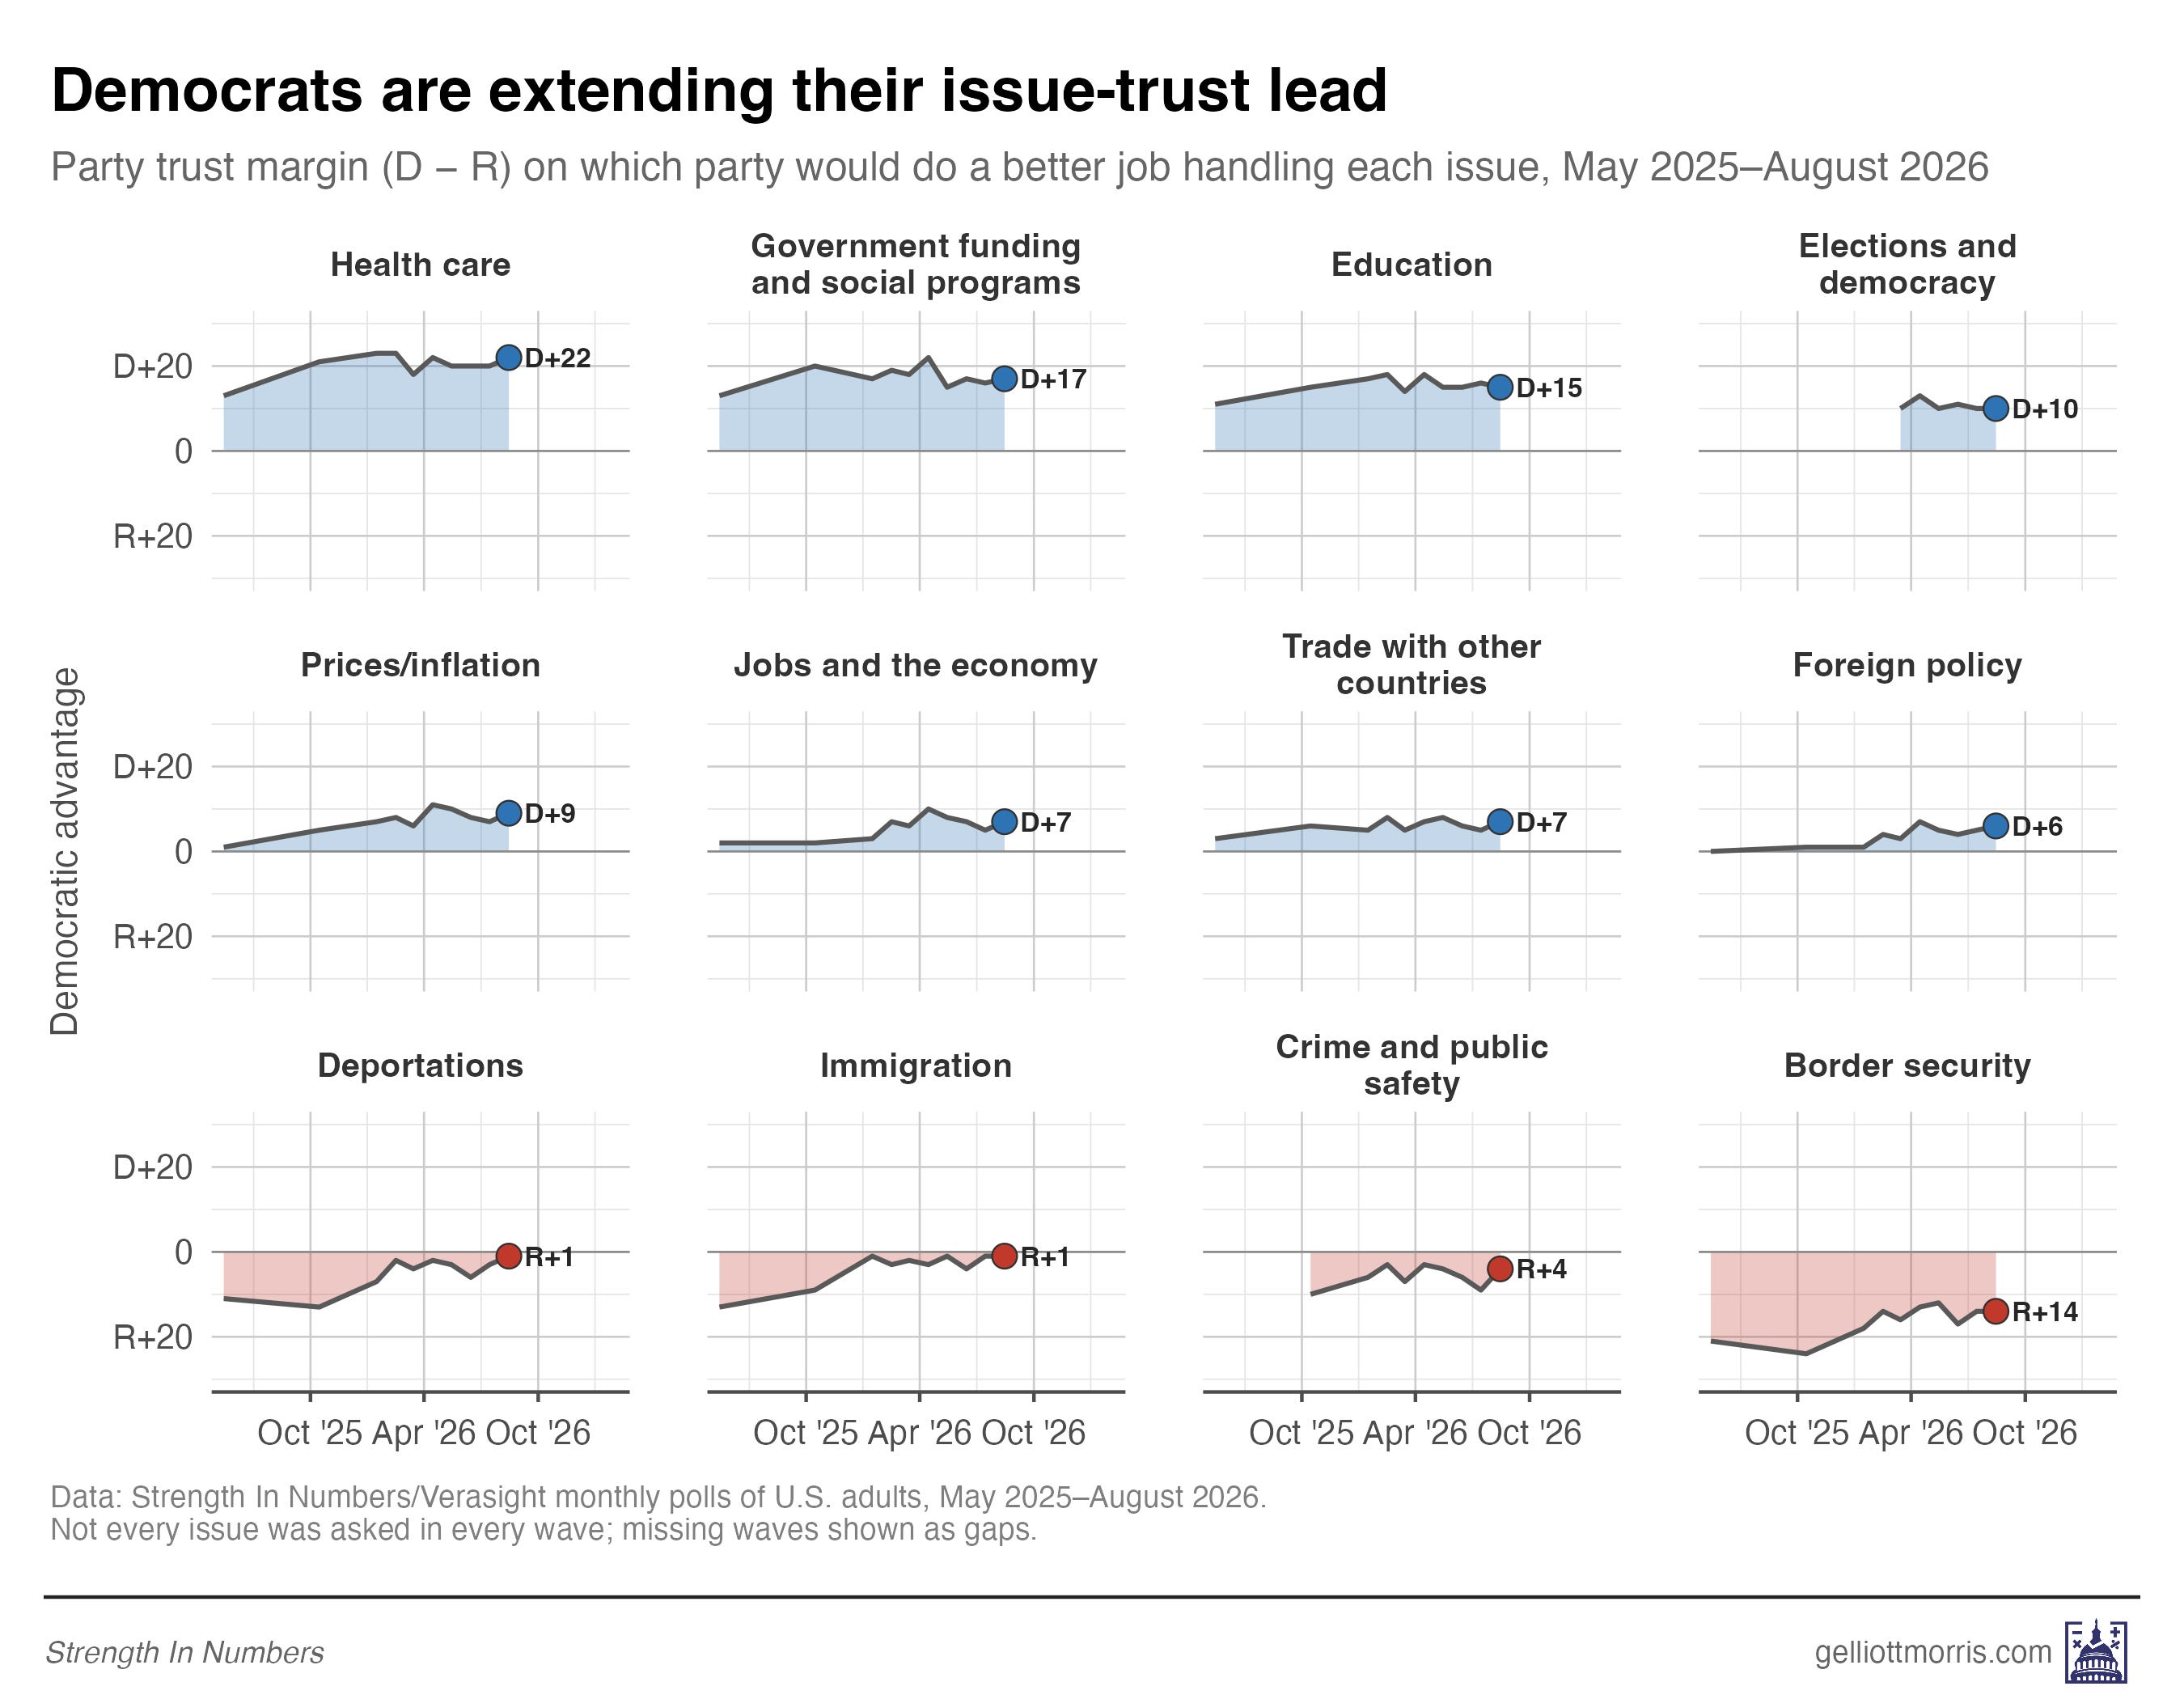
Republicans lead only on lower-salience issues, none of which crack voters’ top four picks for most important problem: border security (R+14), crime (R+4), immigration (R+1) and deportations (R+1). The last 2 are notable for how far they have drifted in the Democratic direction this year.
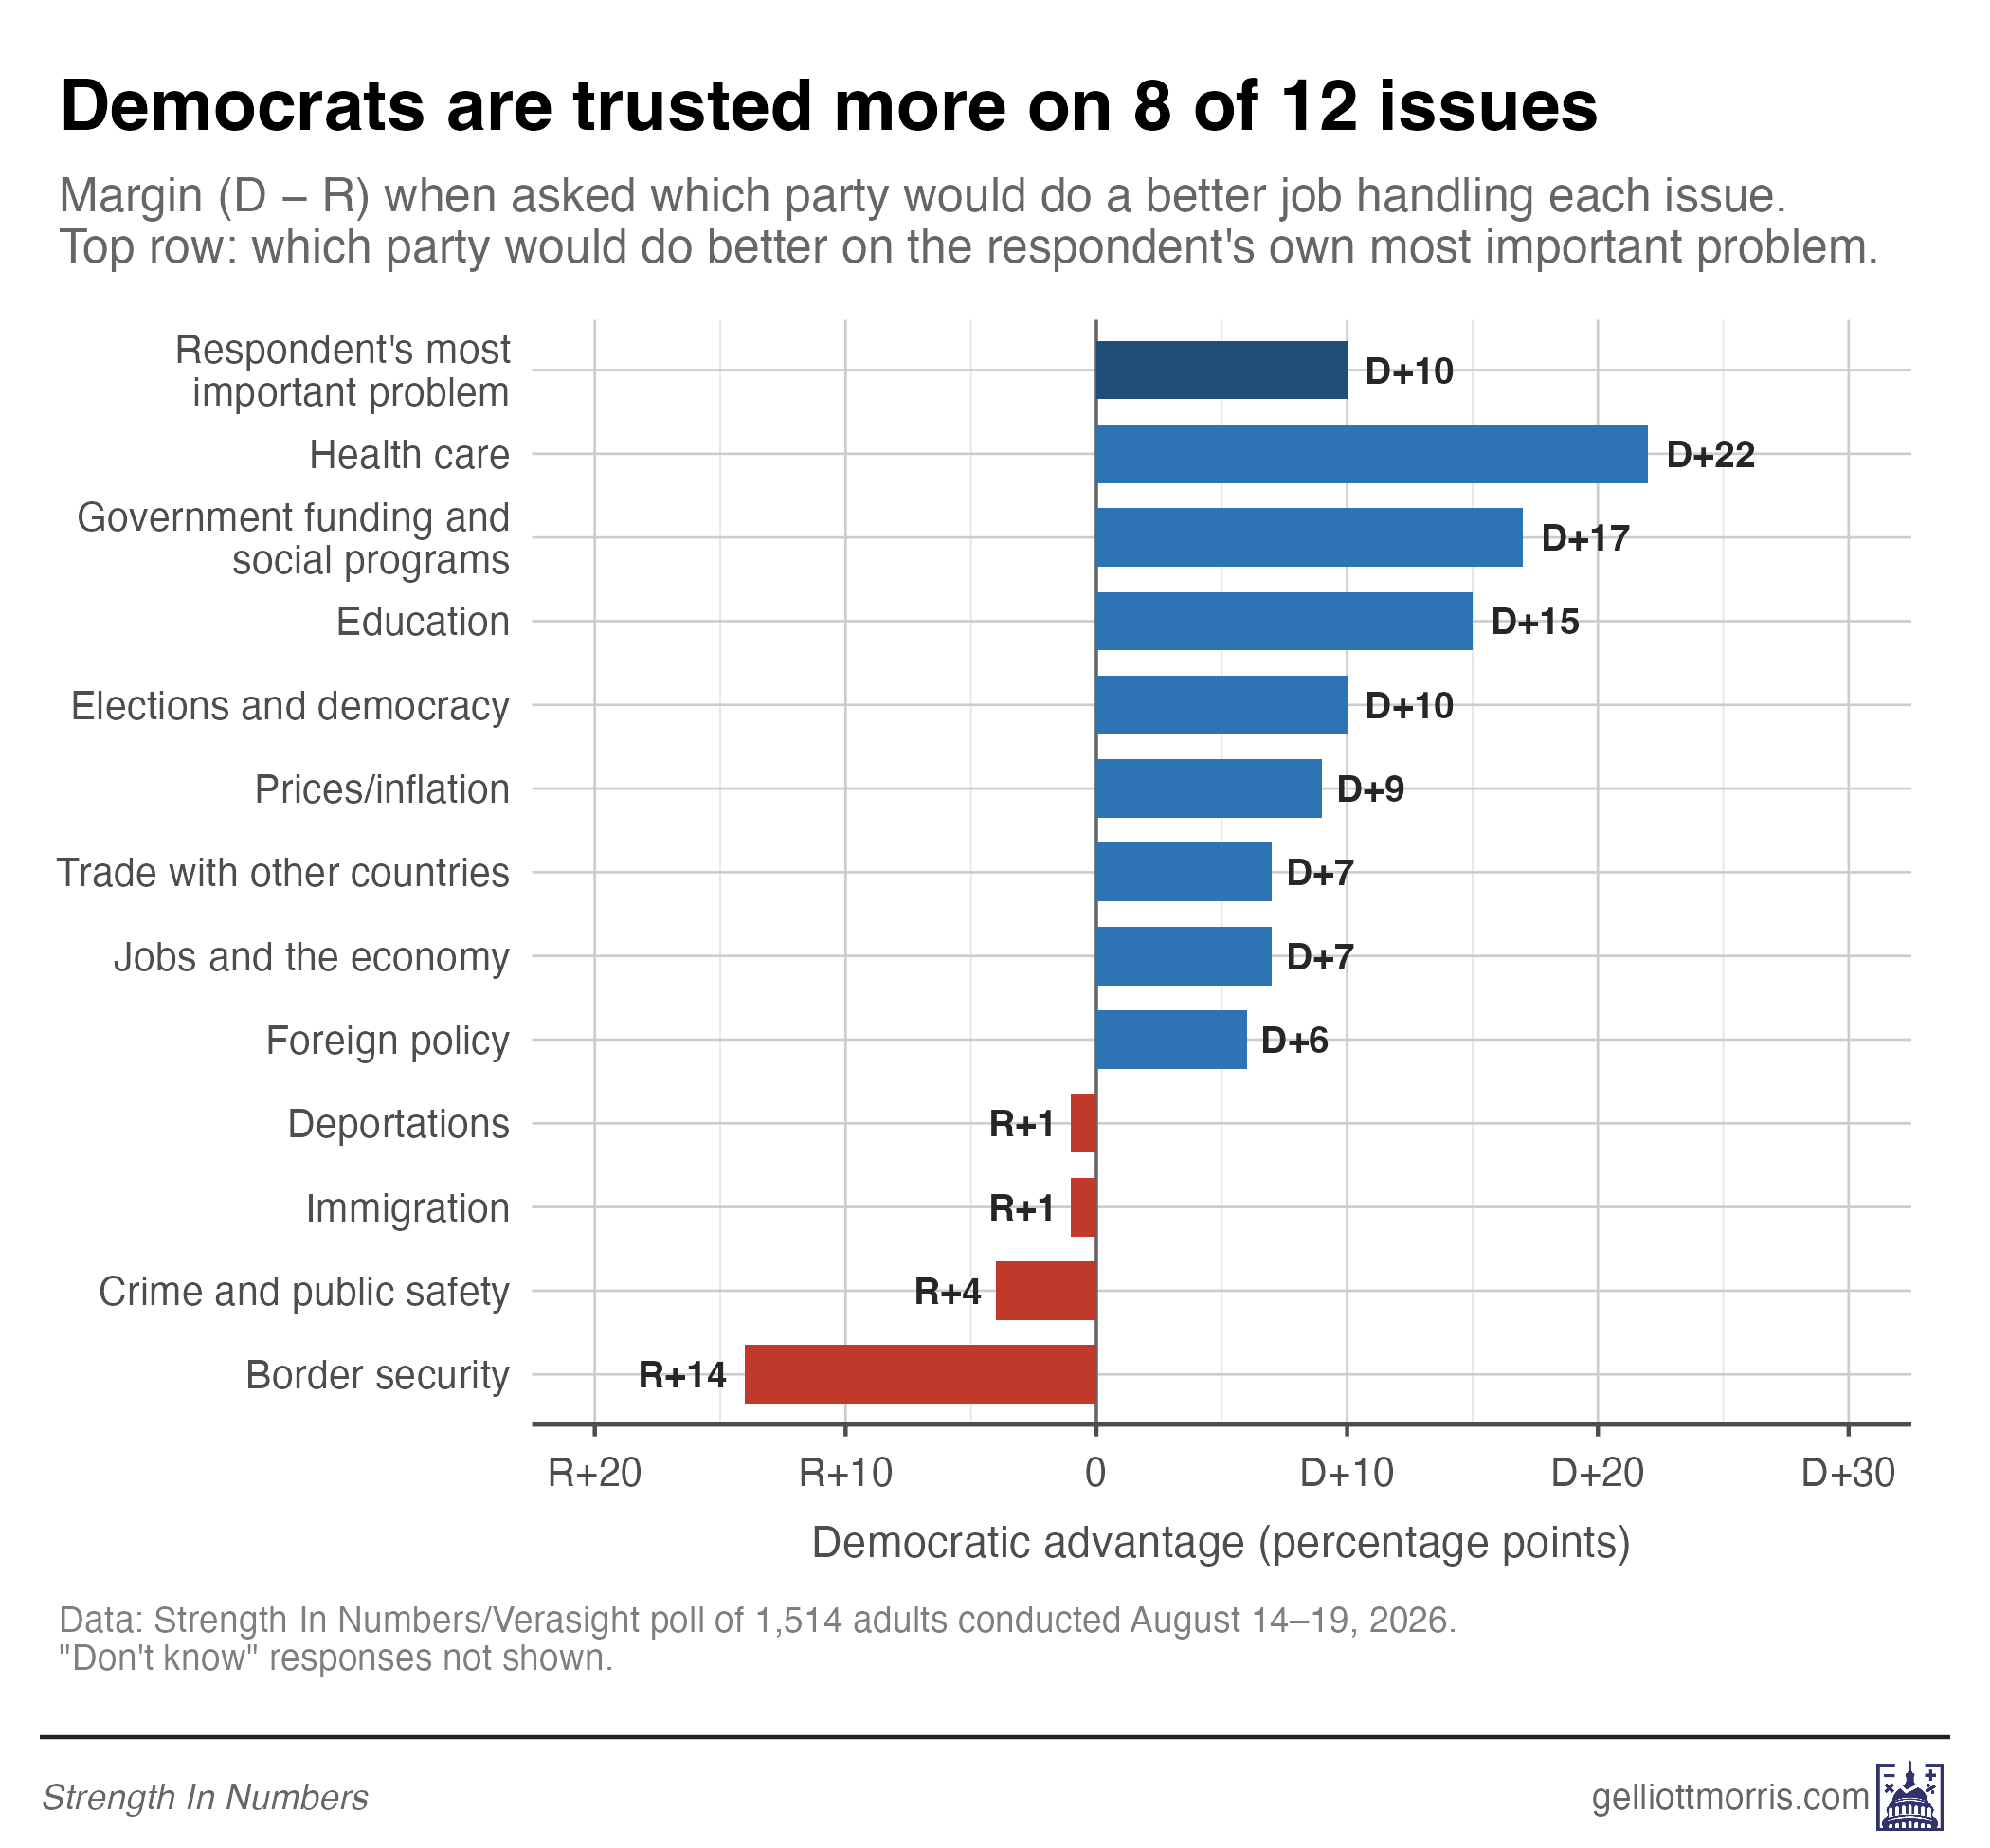
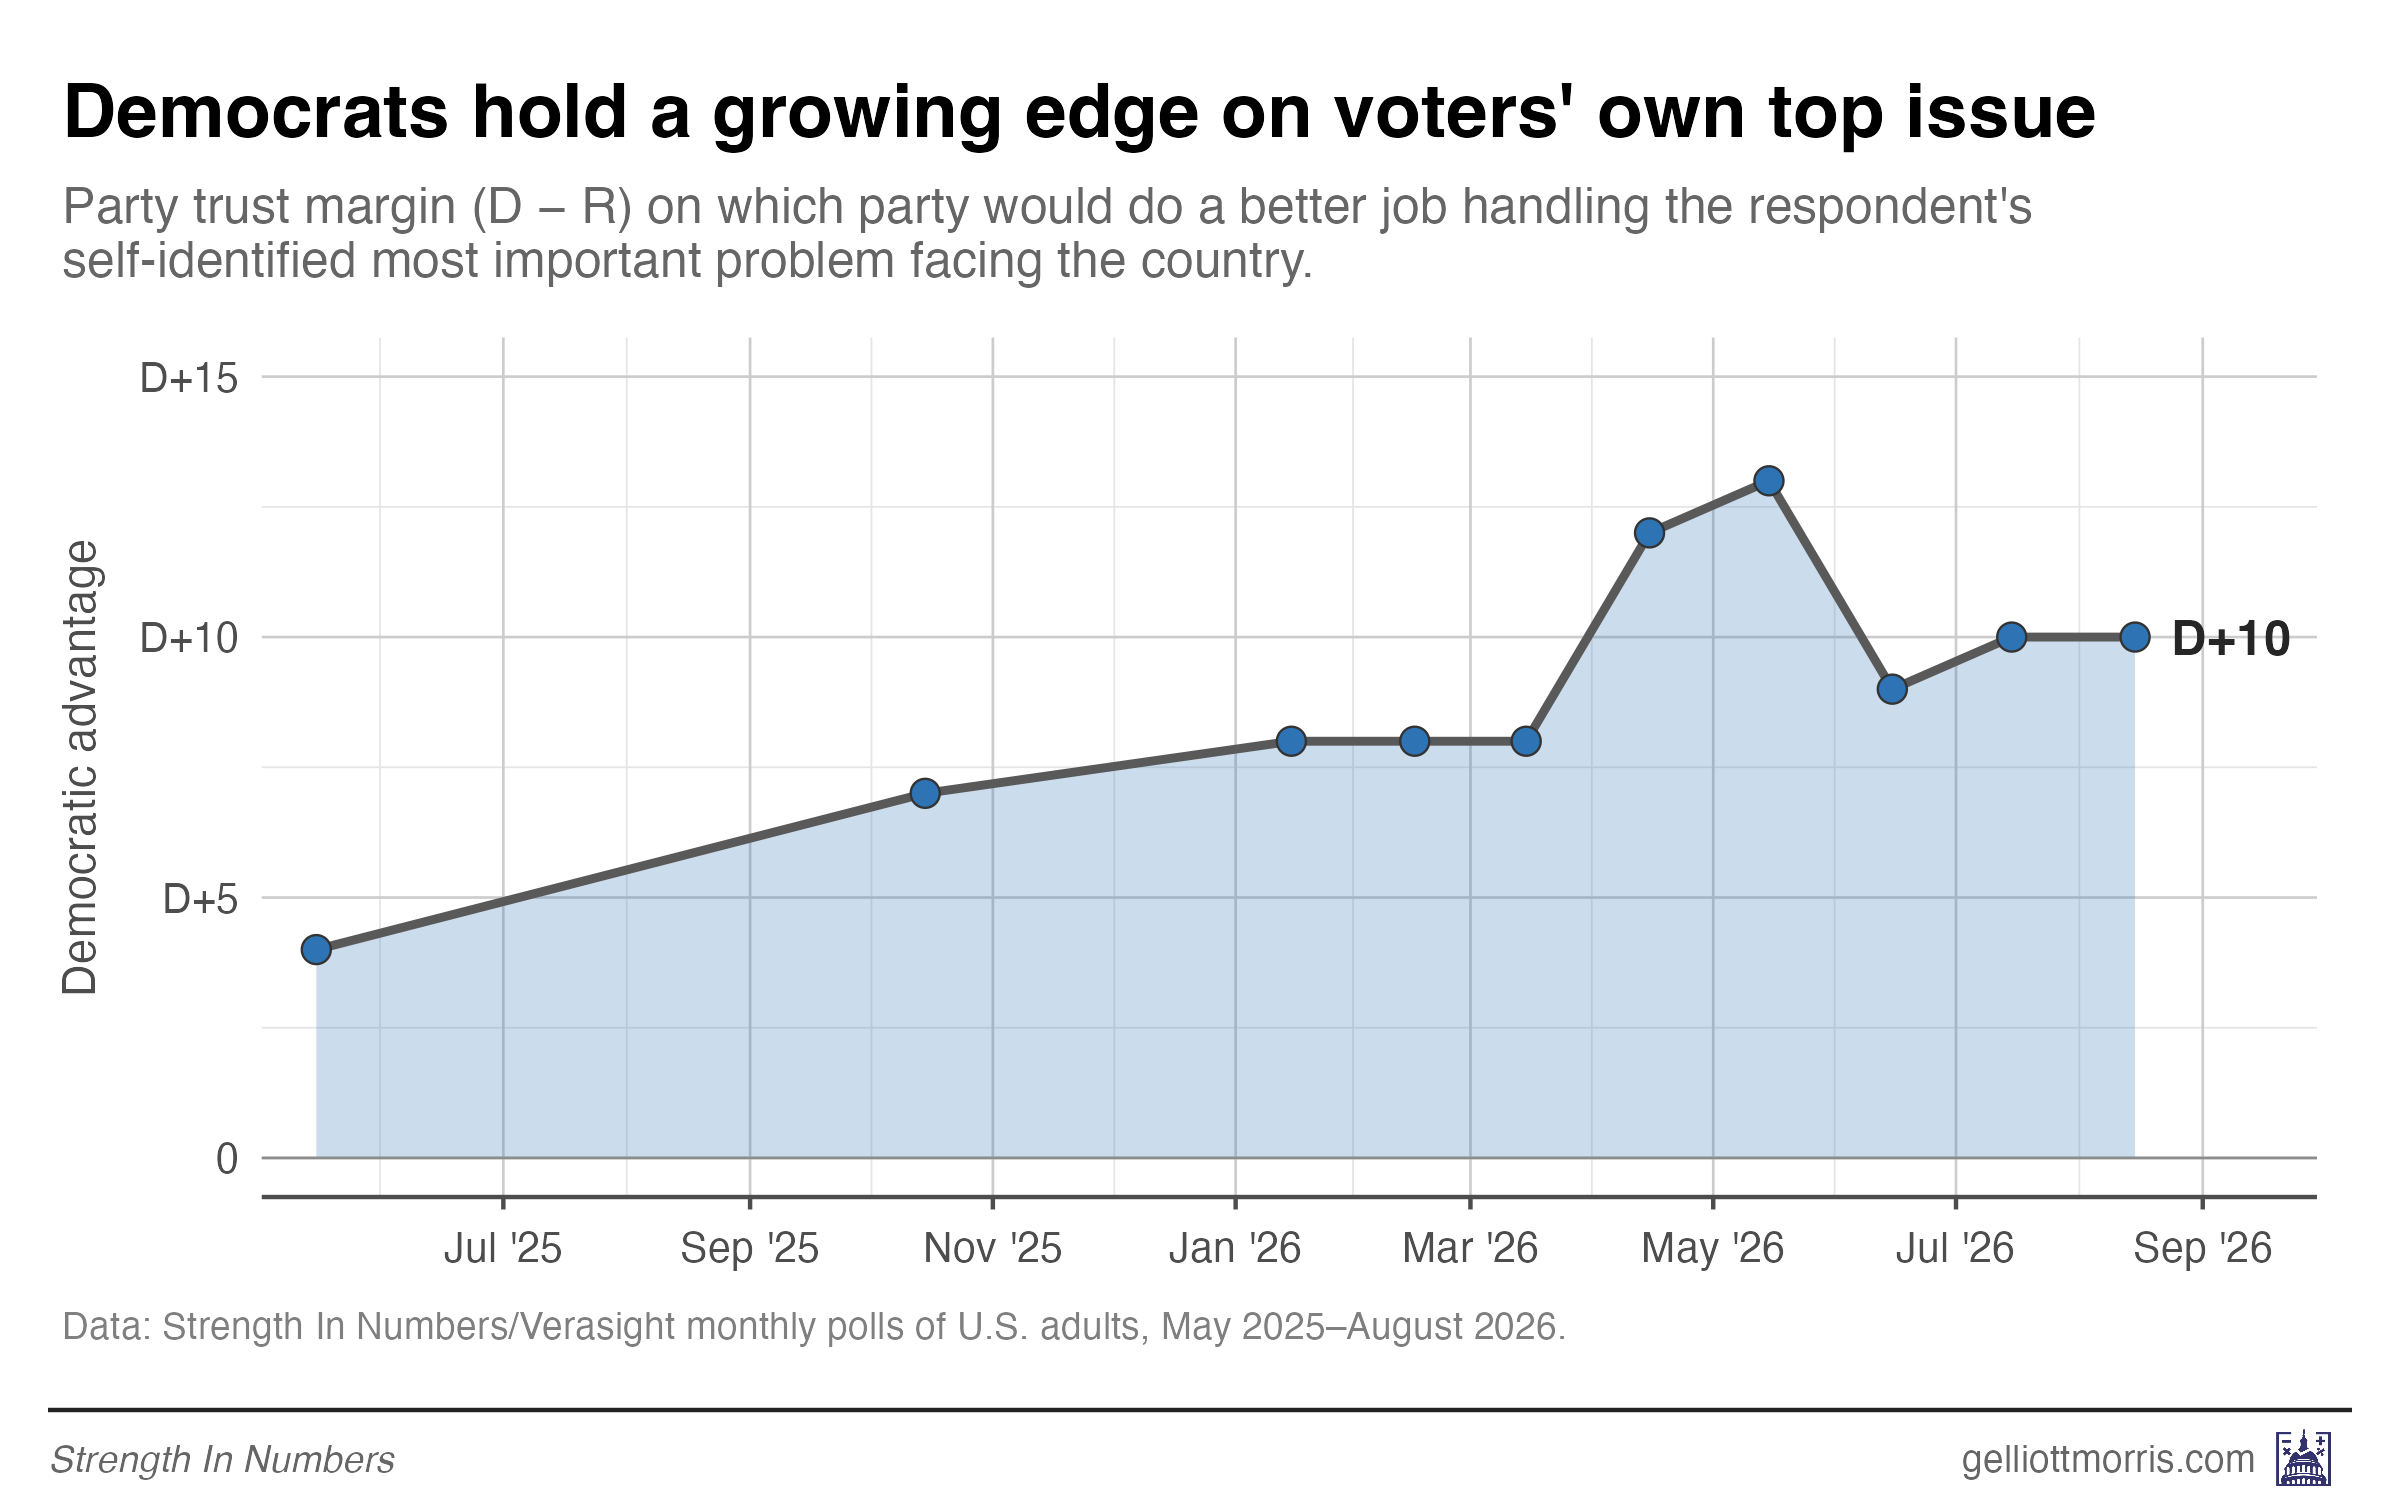
On whichever issue each respondent named as the country’s most important problem, Democrats lead on handling it (at the respondent level) by 46% to 36%, a 10-point edge that has held steady for months.
Movement from July was small but mostly toward Democrats: health care, crime, prices, jobs, trade and deportations each shifted at least two points their way, while education slipped a point toward Republicans. These are within the margin of error.
Democrats lead the generic ballot for a 15th straight poll
Democrats lead the generic congressional ballot 49–43 among registered voters, and 48–41 among all adults, in our August Strength In Numbers/Verasight poll. That’s a touch narrower than July’s 50–43, but well within normal variation in our poll. This margin matches June’s result.
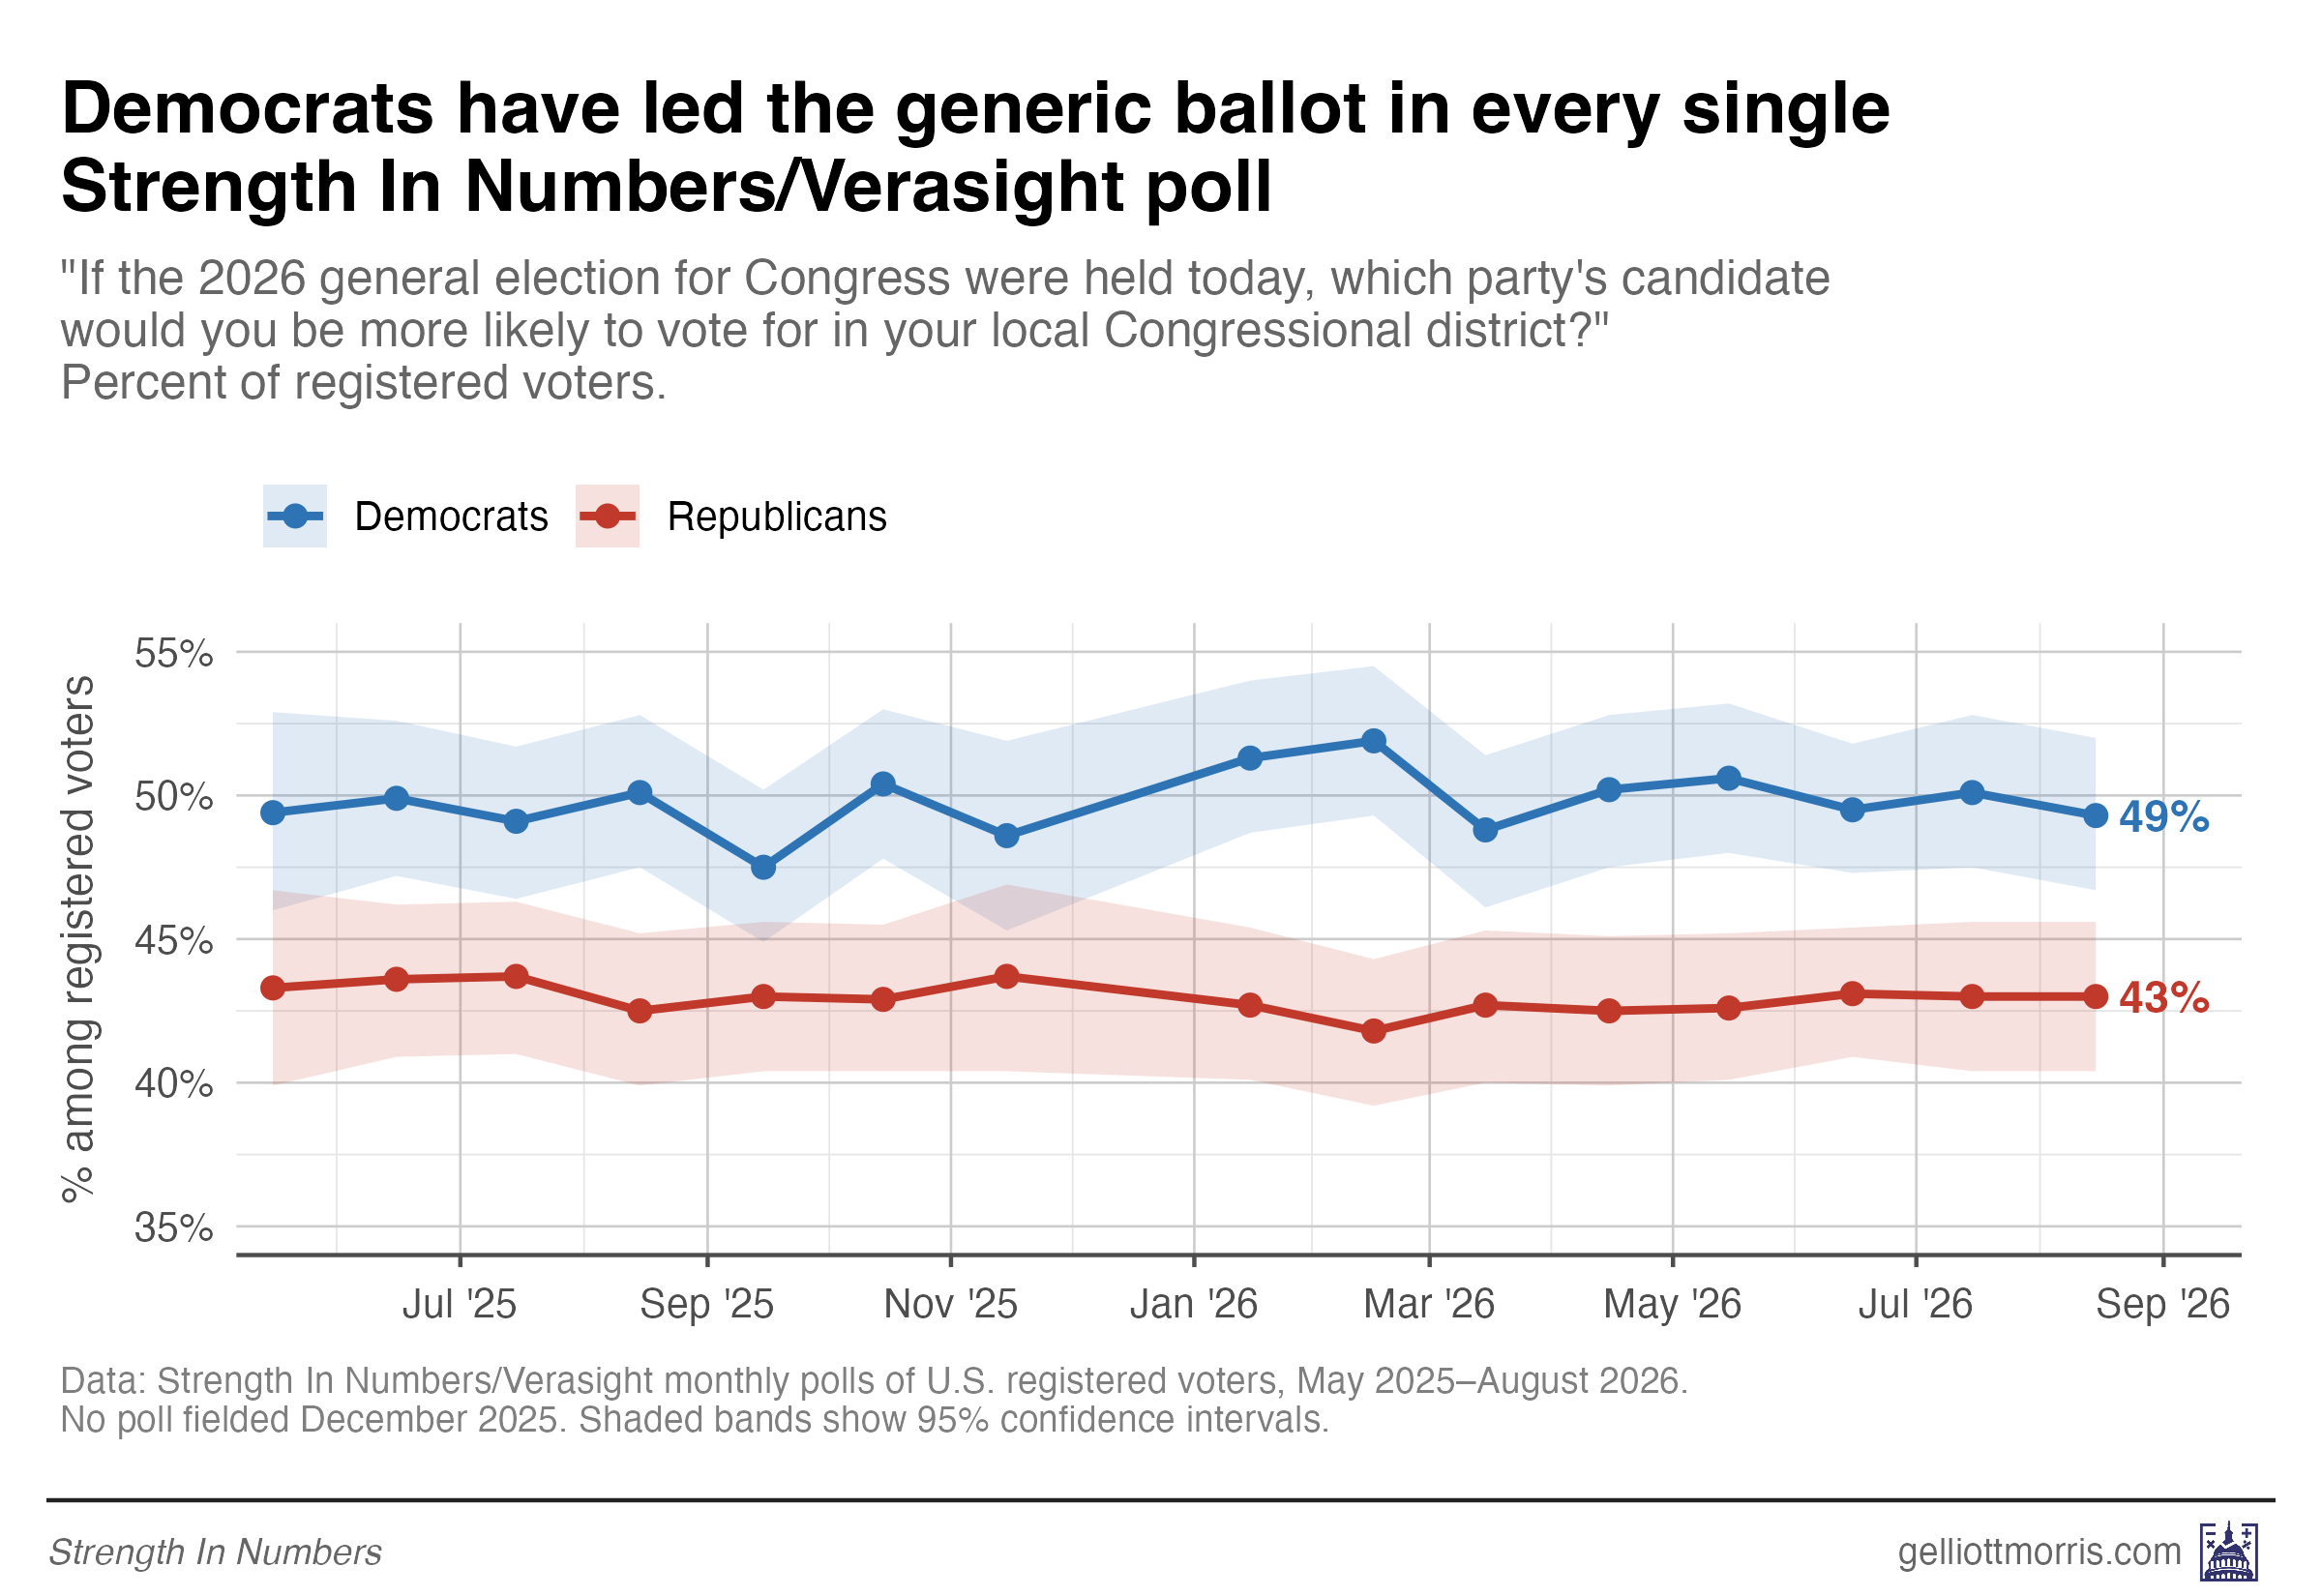
Over the last 16 months, Democrats have held an incredibly stable lead in the generic ballot. Across 15 polls since May 2025, Democrats have never trailed, with margins between D+4.5 and D+10.1.
When voters are weighted according to their stated likelihood to vote, the party’s margin expands to D+7.5, with 51.1% of registered likely voters saying they’ll vote for Democrats in their local congressional seats and 43.6% saying they’ll vote for Republicans.
Among only those voters who say they are definitely going to vote in November, Democrats hold a 9-point lead.
A majority says the country is off on the wrong track
It will be no surprise, given support for the opposition party and anxiety about prices, that Americans are overall in a sour mood about the direction of the party. Among adults, 52% say things are going poorly, and major, disruptive changes are needed to get the country back on track, up from 49% in July (though still below April’s 55% high). Comparatively, 38% say things could be going better, and just 7% say things are going well.
By party, 82% of Democrats, 53% of independents and 21% of Republicans say things are going poorly. A related column I wrote on this a couple of weeks back: Anti-system sentiment, not ideology, is what’s driving Democratic gains right now.
Reader-suggested questions: financial fragility and federal spending cuts
Each month, subscribers suggest questions, and I pick a few to field. Here are two from this wave:
How long could Americans withstand a loss of income? More than a quarter of Americans, 27%, say they could maintain their current standard of living for less than a month if they lost their income; 44% say three months or less. Just 20% say they could go more than a year.
What government program would you cut first? Given a list of federal spending to cut, 46% pick foreign aid and 22% pick immigration enforcement and deportations. Social Security and Medicare (2%), Medicaid (2%), and medical and scientific research (2%) all rank toward the bottom.
On the broader question of party image: 37% of adults say Democrats care more about people like them, vs. 27% say Republicans do — but 25% say neither party does. The parties overall are viewed negatively; on a 0–100 feeling thermometer, Americans rate the Democratic Party at 45.2 and the Republican Party at 41.5.
I’m holding a few findings from this wave for release later in the week. On Friday’s Chart of the Week, I’ll take a look at issue salience or generational splits within each party’s base — whatever the chartage is more compelling on. And next week, I’ve got results from a battery we ran among each party’s voters that asks about the direction they want their respective party organizations to take. Make sure you’re signed up to get those in your inbox!
If this type of work is useful to you, or you believe in supporting it for the public good, consider becoming a paid member of this Substack. Paying subscribers to Strength In Numbers make it possible for me to spend time on this original, independent, data-driven political journalism that’s not beholden to any corporation or billionaire donor. Support my work and get access to articles like this one for $10/month or $90/year.
Methods statement:
Verasight collected the data for this survey from Aug. 14–19, 2026. The sample consists of 1,514 United States adults ages 18 and above. The data are weighted to match the June 2026 Current Population Survey on age, race/ethnicity, sex, income, education, region, and metropolitan status, as well as to a running three-year average of partisanship distributions from the Pew Research Center NPORS benchmarking surveys and population benchmarks of the 2024 vote. The margin of sampling error is ±2.6%.
G. Elliott Morris prepared the topline document and this write-up for Strength In Numbers. Strength In Numbers had input on question wording, but all other methodological decisions were made and carried out by Verasight to ensure independence of the data-generating process behind these results. Verasight also reviewed the questionnaire.
You can download a full topline file, key crosstabs, and full methodology statement at the Strength In Numbers/Verasight polling portal. The paywalled section containing full crosstabs and more interactive graphics will be updated Tuesday morning.
If you have any questions about this poll or the release, please email polling[AT]gelliottmorris.com.
Have a suggestion for next month’s poll? Leave it in the comments below!


So, based on the latest polling, are we looking at a Democratic win in the House and Senate?
And these polls were done before Trump decided to declare a tariff war on Canada.