


Independent polling like this only works if readers fund it. For $10/month (or $90/year), you’ll get the full crosstabs for every survey, ability to submit subscriber-only poll questions, and the knowledge that you’re keeping this work free of corporate and billionaire money. Plus, you get access to premium articles like my Tuesday Deep Dive and other exclusive posts, and a community Discord server for like-minded readers.
This article reports results from the July 2026 Strength In Numbers/Verasight poll. A methodology description is included at the end of this article. You can find toplines for this as well as our previous poll releases at the Strength In Numbers polling portal. Subscribers to Strength In Numbers have access to additional visuals and a full archive of crosstabs here. Readers can suggest questions for future polls in the comments section below!
The national average price of gasoline is back above $4 a gallon as fighting with Iran has reignited in recent weeks. President Trump’s response has not been to adjust his Middle East policy, but to hunt down price-gougers: On June 24, 2026, the Justice Department launched a probe of oil companies, then on July 3 urged state attorneys general to do the same.
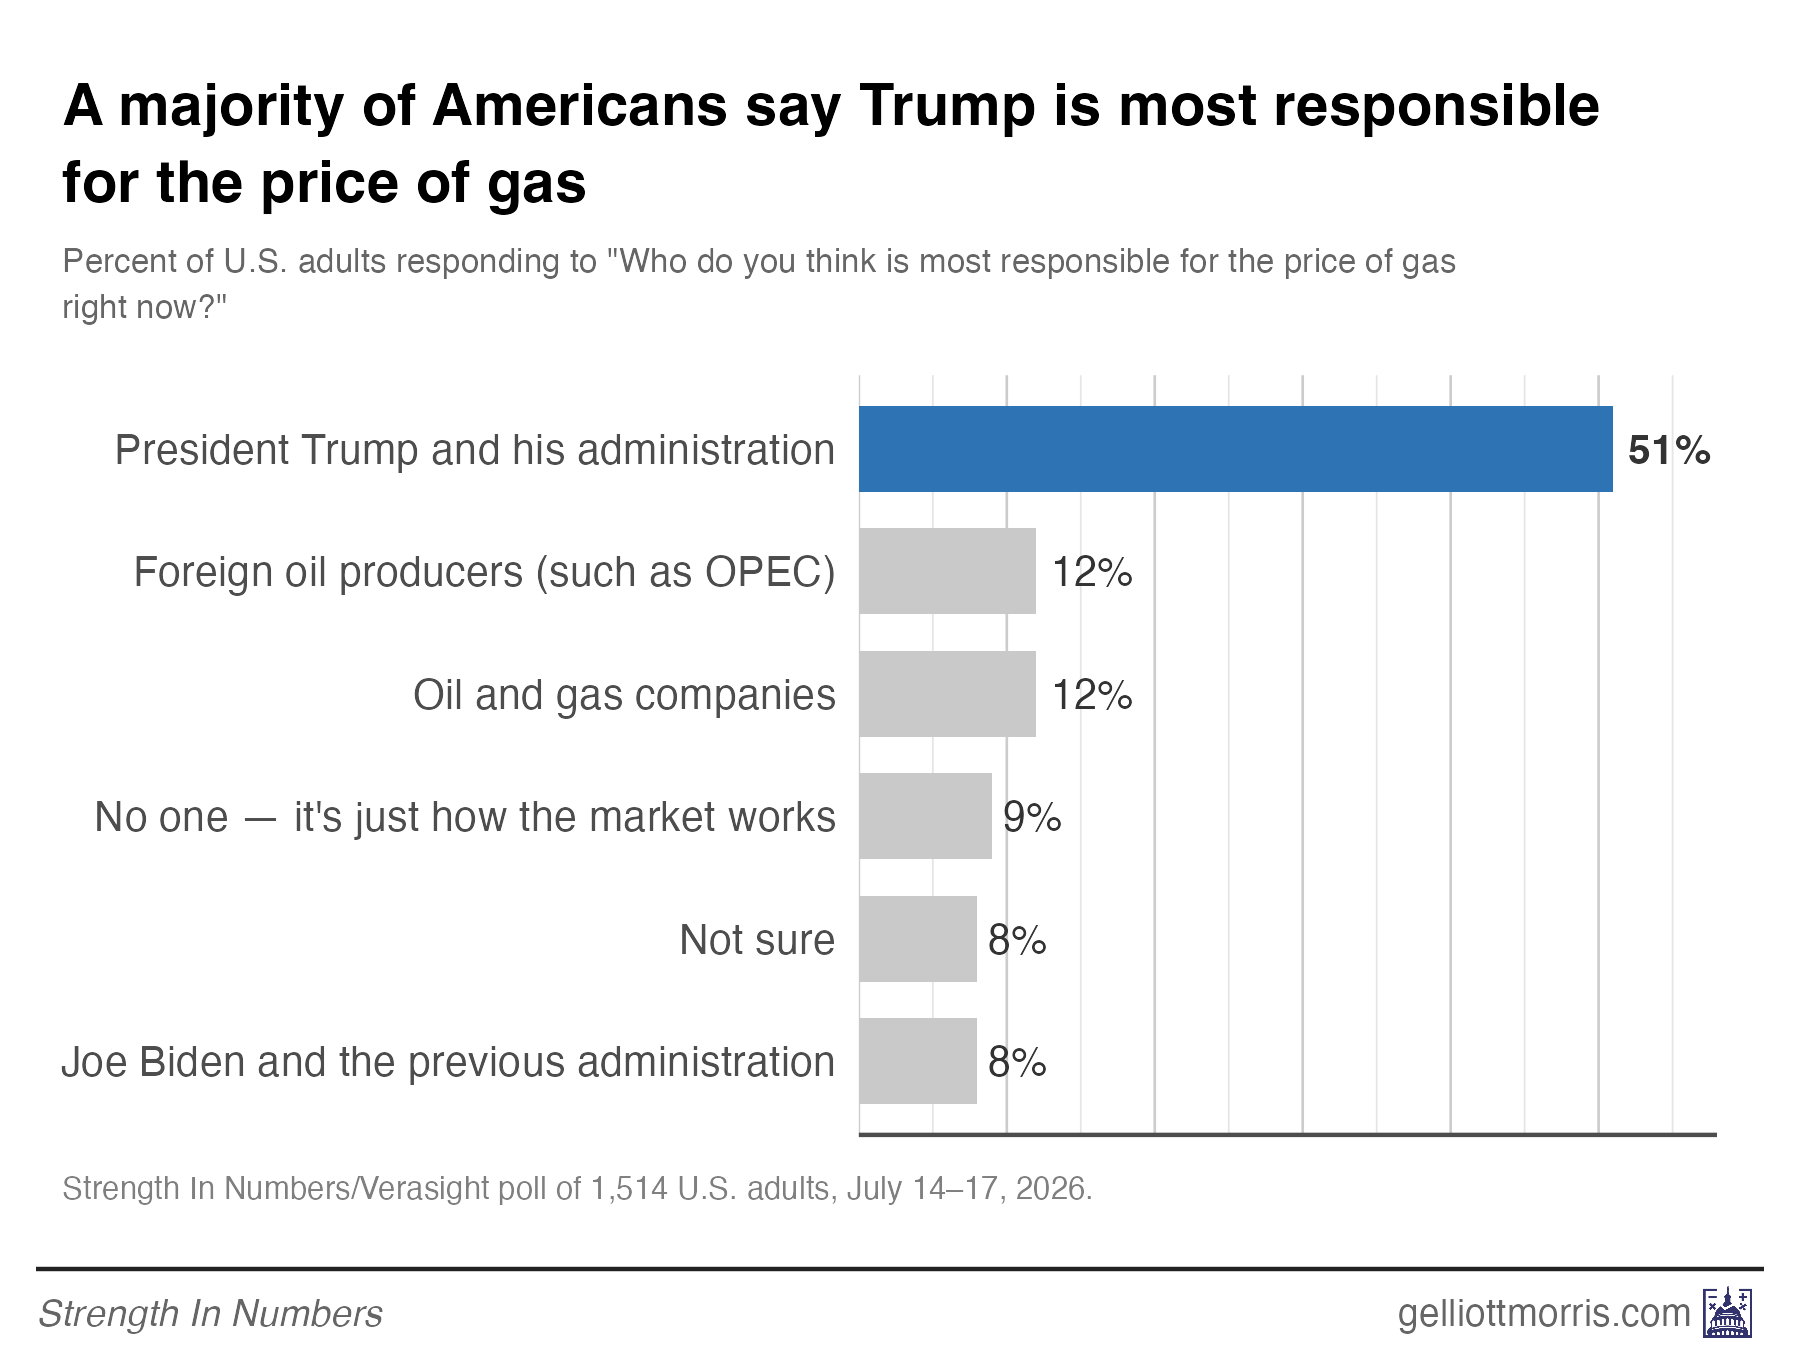
Polls suggest voters aren’t buying the ruse. In our latest Strength In Numbers/Verasight poll, fielded July 14–17, 51% of Americans say Trump and his administration are most responsible for the price of gas right now, whereas 12% put the blame primarily on oil and gas companies.
As the prospect of peace in the Middle East slips away, so too does his administration’s opportunity to repair some trust with the average voter. Despite some easing in the price of gas, inflation and the state of the economy remain Trump’s worst issues — and the country’s top problems. The president’s approval rating is accordingly at net -21 in our new survey, while Democrats score a 7-point margin on the generic ballot, their fourteenth straight poll leading the Republicans.
Below, I report full results from our monthly Strength In Numbers/Verasight political tracking survey. This month we added a battery on gas prices, plus subscriber questions on Trump’s mental sharpness, who should pay for AI data centers, and the least-popular ways to fix the budget deficit. One notable finding: Trump, now 80 years of age as of last month, gets a “poor” rating on his mental sharpness as president from 46% of Americans — within a few points of the 50% who say that of Joe Biden’s presidency.
Headline poll findings
Gas prices: 59% say higher gas prices have forced them to cut back or delay other spending, and 51% say Trump and his administration are most responsible for the price of gas right now. 74% say local gas prices are higher than six months ago, and 47% say gas prices will have at least “some” influence on their 2026 vote.
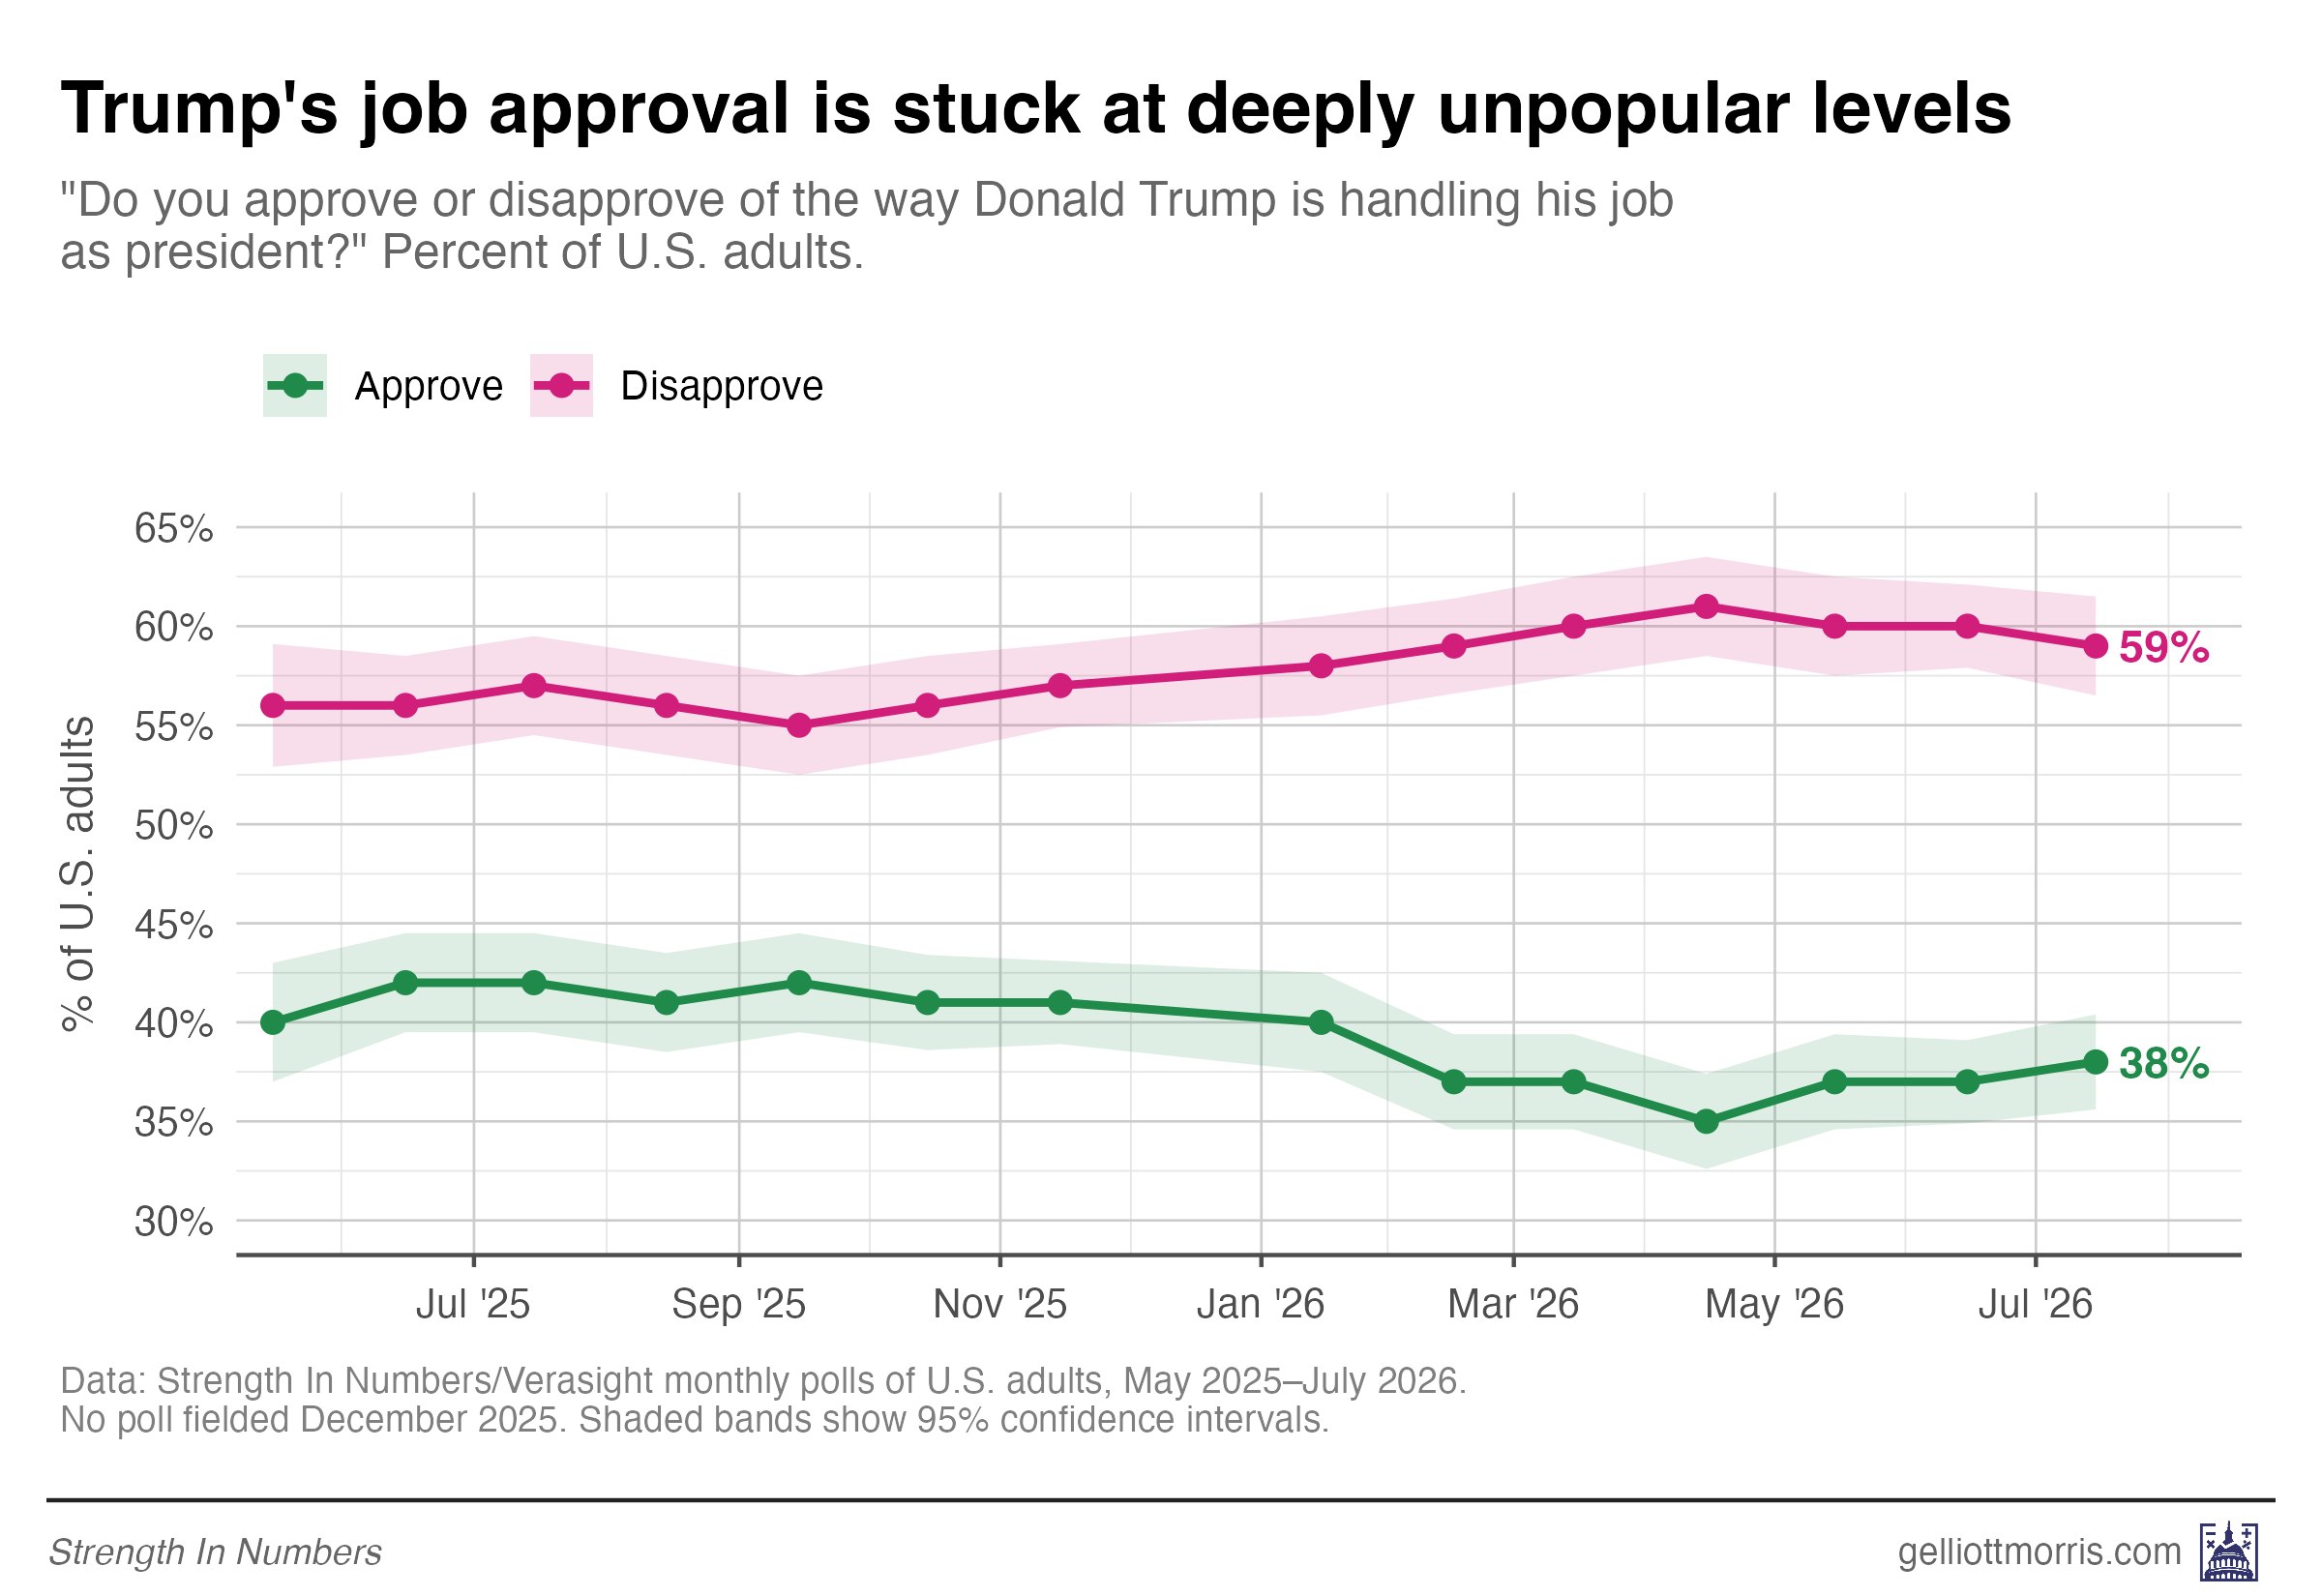
Job approval: 38% approve / 59% disapprove (net -21), roughly flat from June’s -23. 49% strongly disapprove, vs 17% who strongly approve.
Generic ballot: Democrats lead 50–43 among registered voters (D+7) and 48–42 among all adults. The Democrats have led in all 14 of our polls since May 2025.
Prices: Trump’s net approval on prices and inflation is -42 — still his worst issue by far, but the first wave all year the number moved his way by more than a point (from -46 in June). 36% name prices the single most important problem facing the country.
Issue approval: underwater on 11 of the 12 issues we test; he breaks even only on border security (49/48).
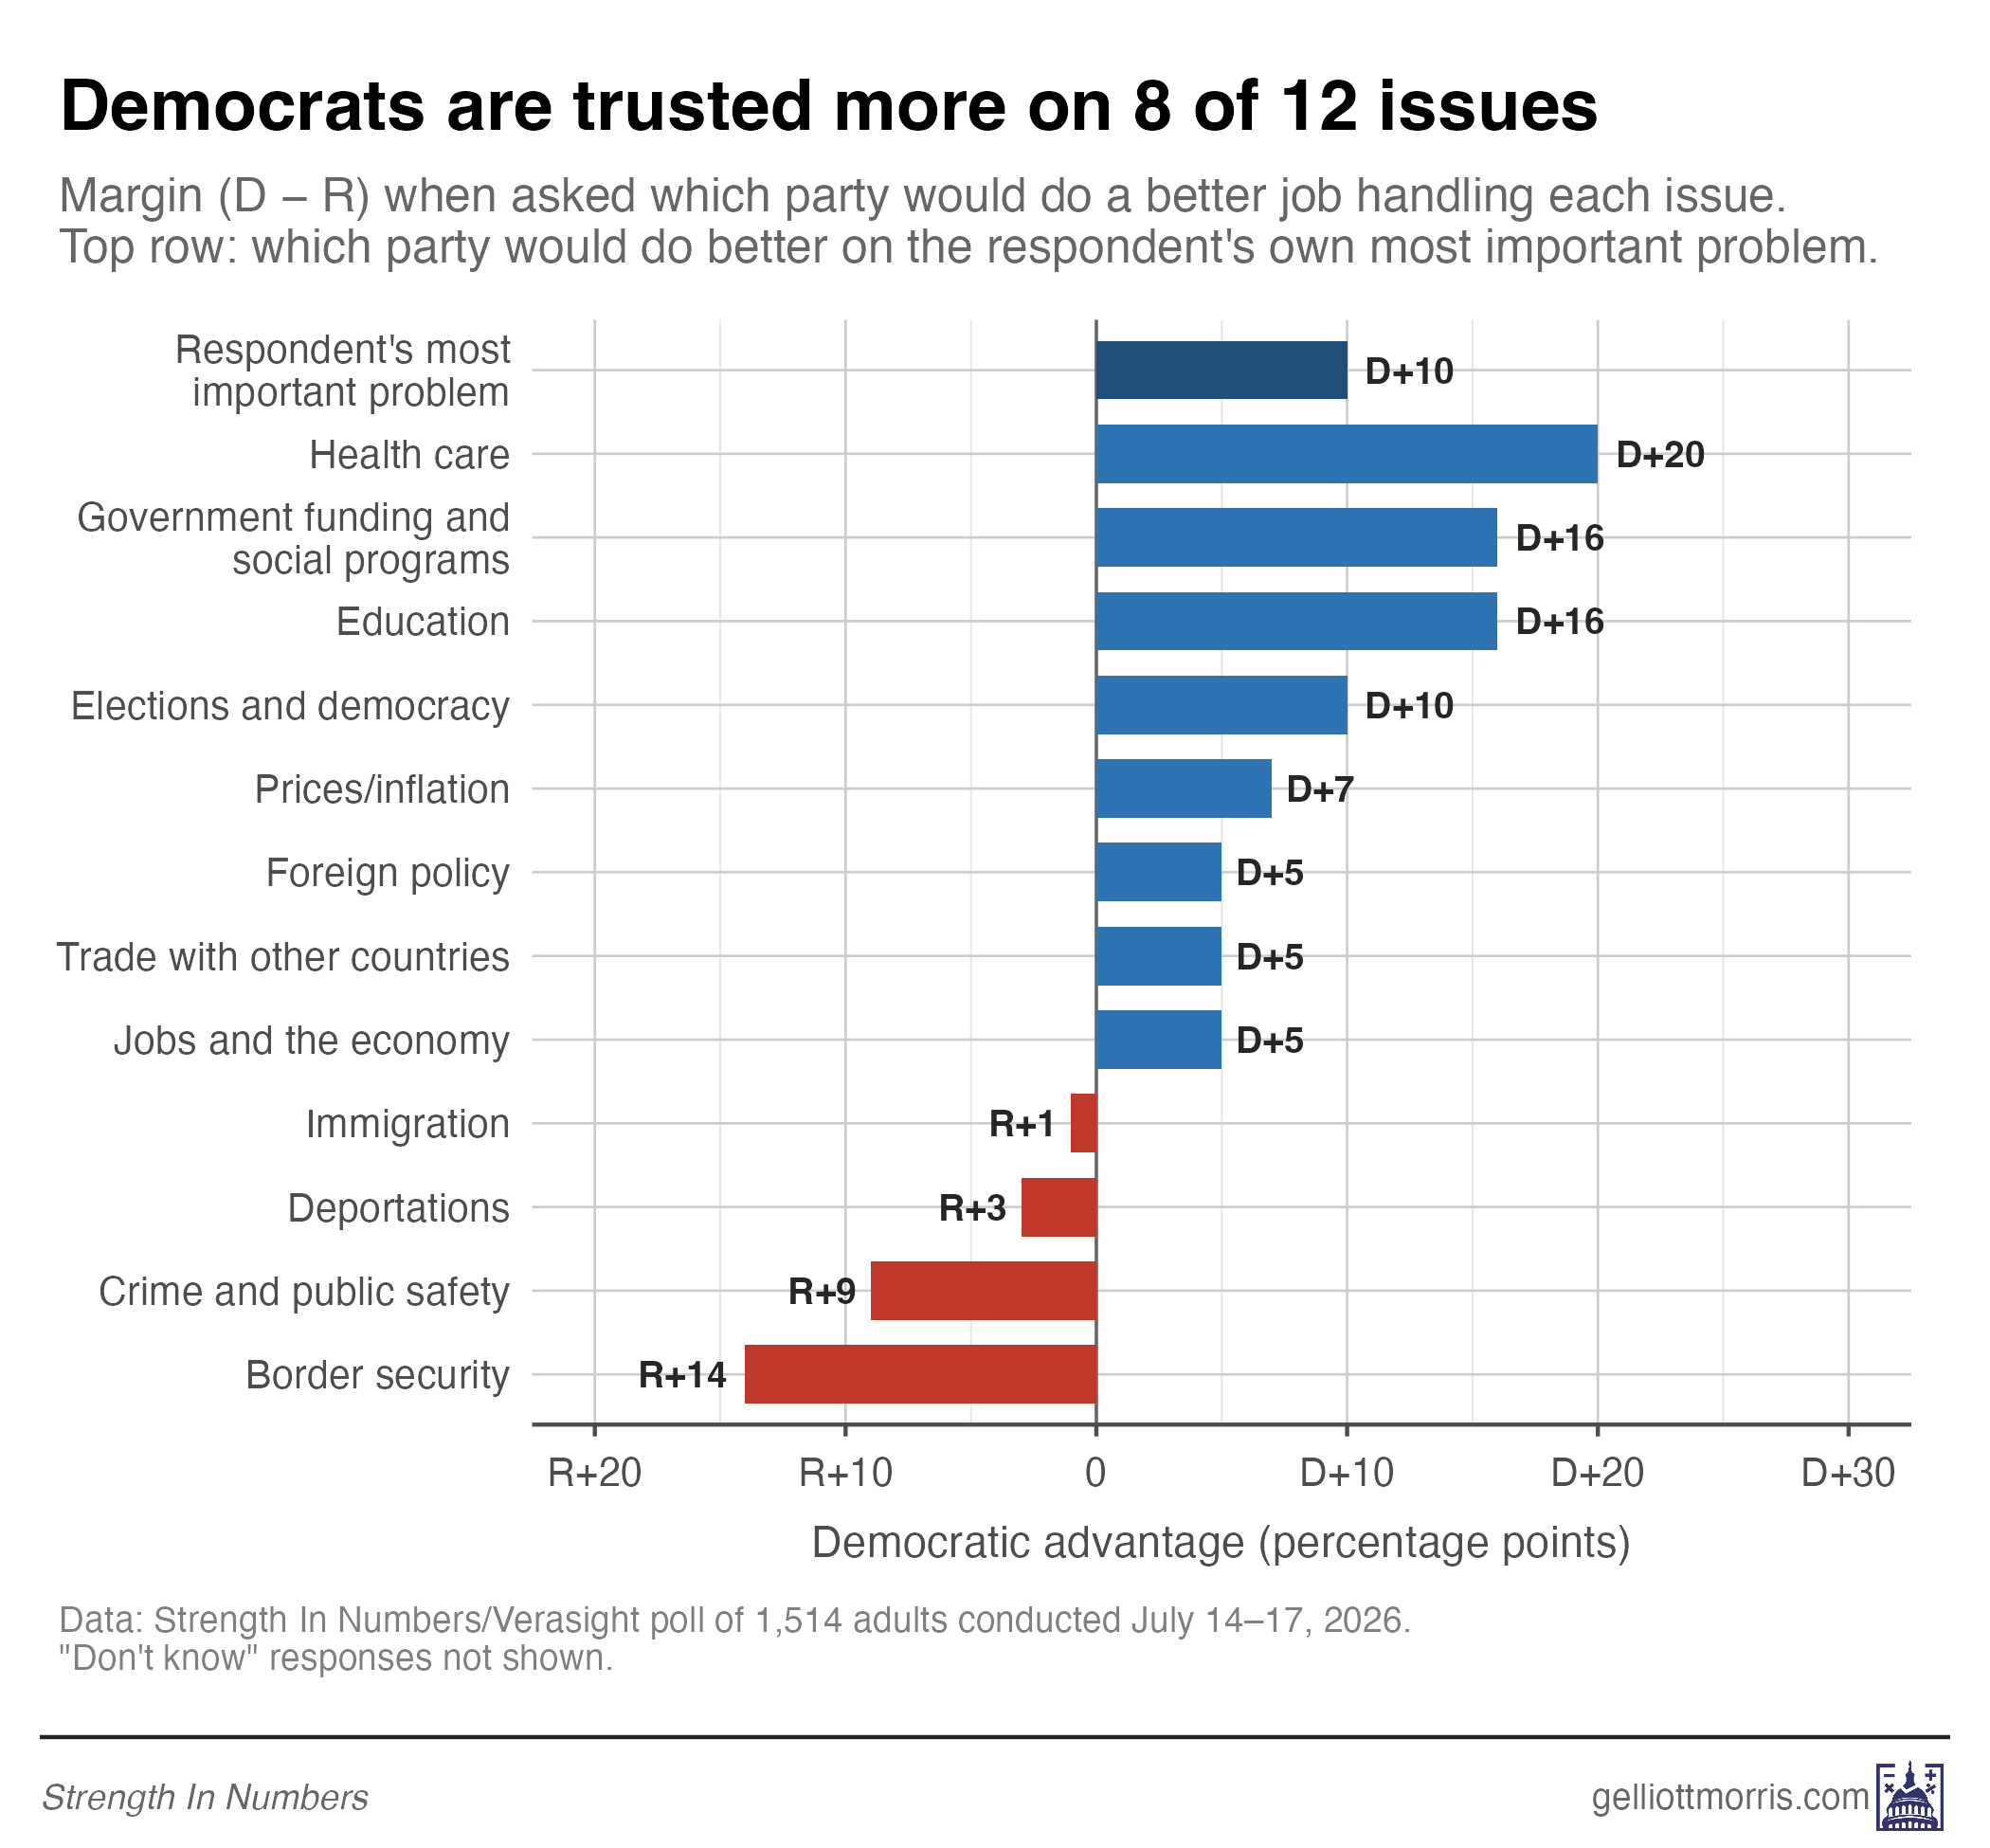
Party trust: Democrats lead on 8 of 12 issues — including prices, jobs, health care, and elections — and lead by 10 points on voters’ own most important problem.
Direction of the country: 49% say things in America are going poorly and major, disruptive changes to the country’s political system are needed; just 8% say things are going well.
Mental sharpness (subscriber question): 46% rate Trump’s mental sharpness as president “poor” — four points shy of the 50% who say that of Biden’s presidency (Strength In Numbers/Verasight, July 14–17). Trump keeps the edge on the top of the scale: 38% say excellent or good, vs 24% for Biden.
AI data centers (subscriber question): 64% of Americans say AI companies should pay for the new power plants and grid upgrades needed to run their data centers.
Select questions held for future release.
This is the first of several articles releasing data from the July Strength In Numbers/Verasight poll. Subscribe to Strength In Numbers to get the rest in your inbox this week.
Voters blame Trump for high gas prices
We asked voters to pick which individual or organization they thought was most responsible for the current high price of gasoline across the U.S. Respondents could pick between Trump, Joe Biden, the oil companies, foreign producers like OPEC, and “no one in particular, it’s just how the market works” as options — and a 51% majority of Americans picked the president and his administration. The next-highest answers, the oil companies and OPEC, draw 12% each.
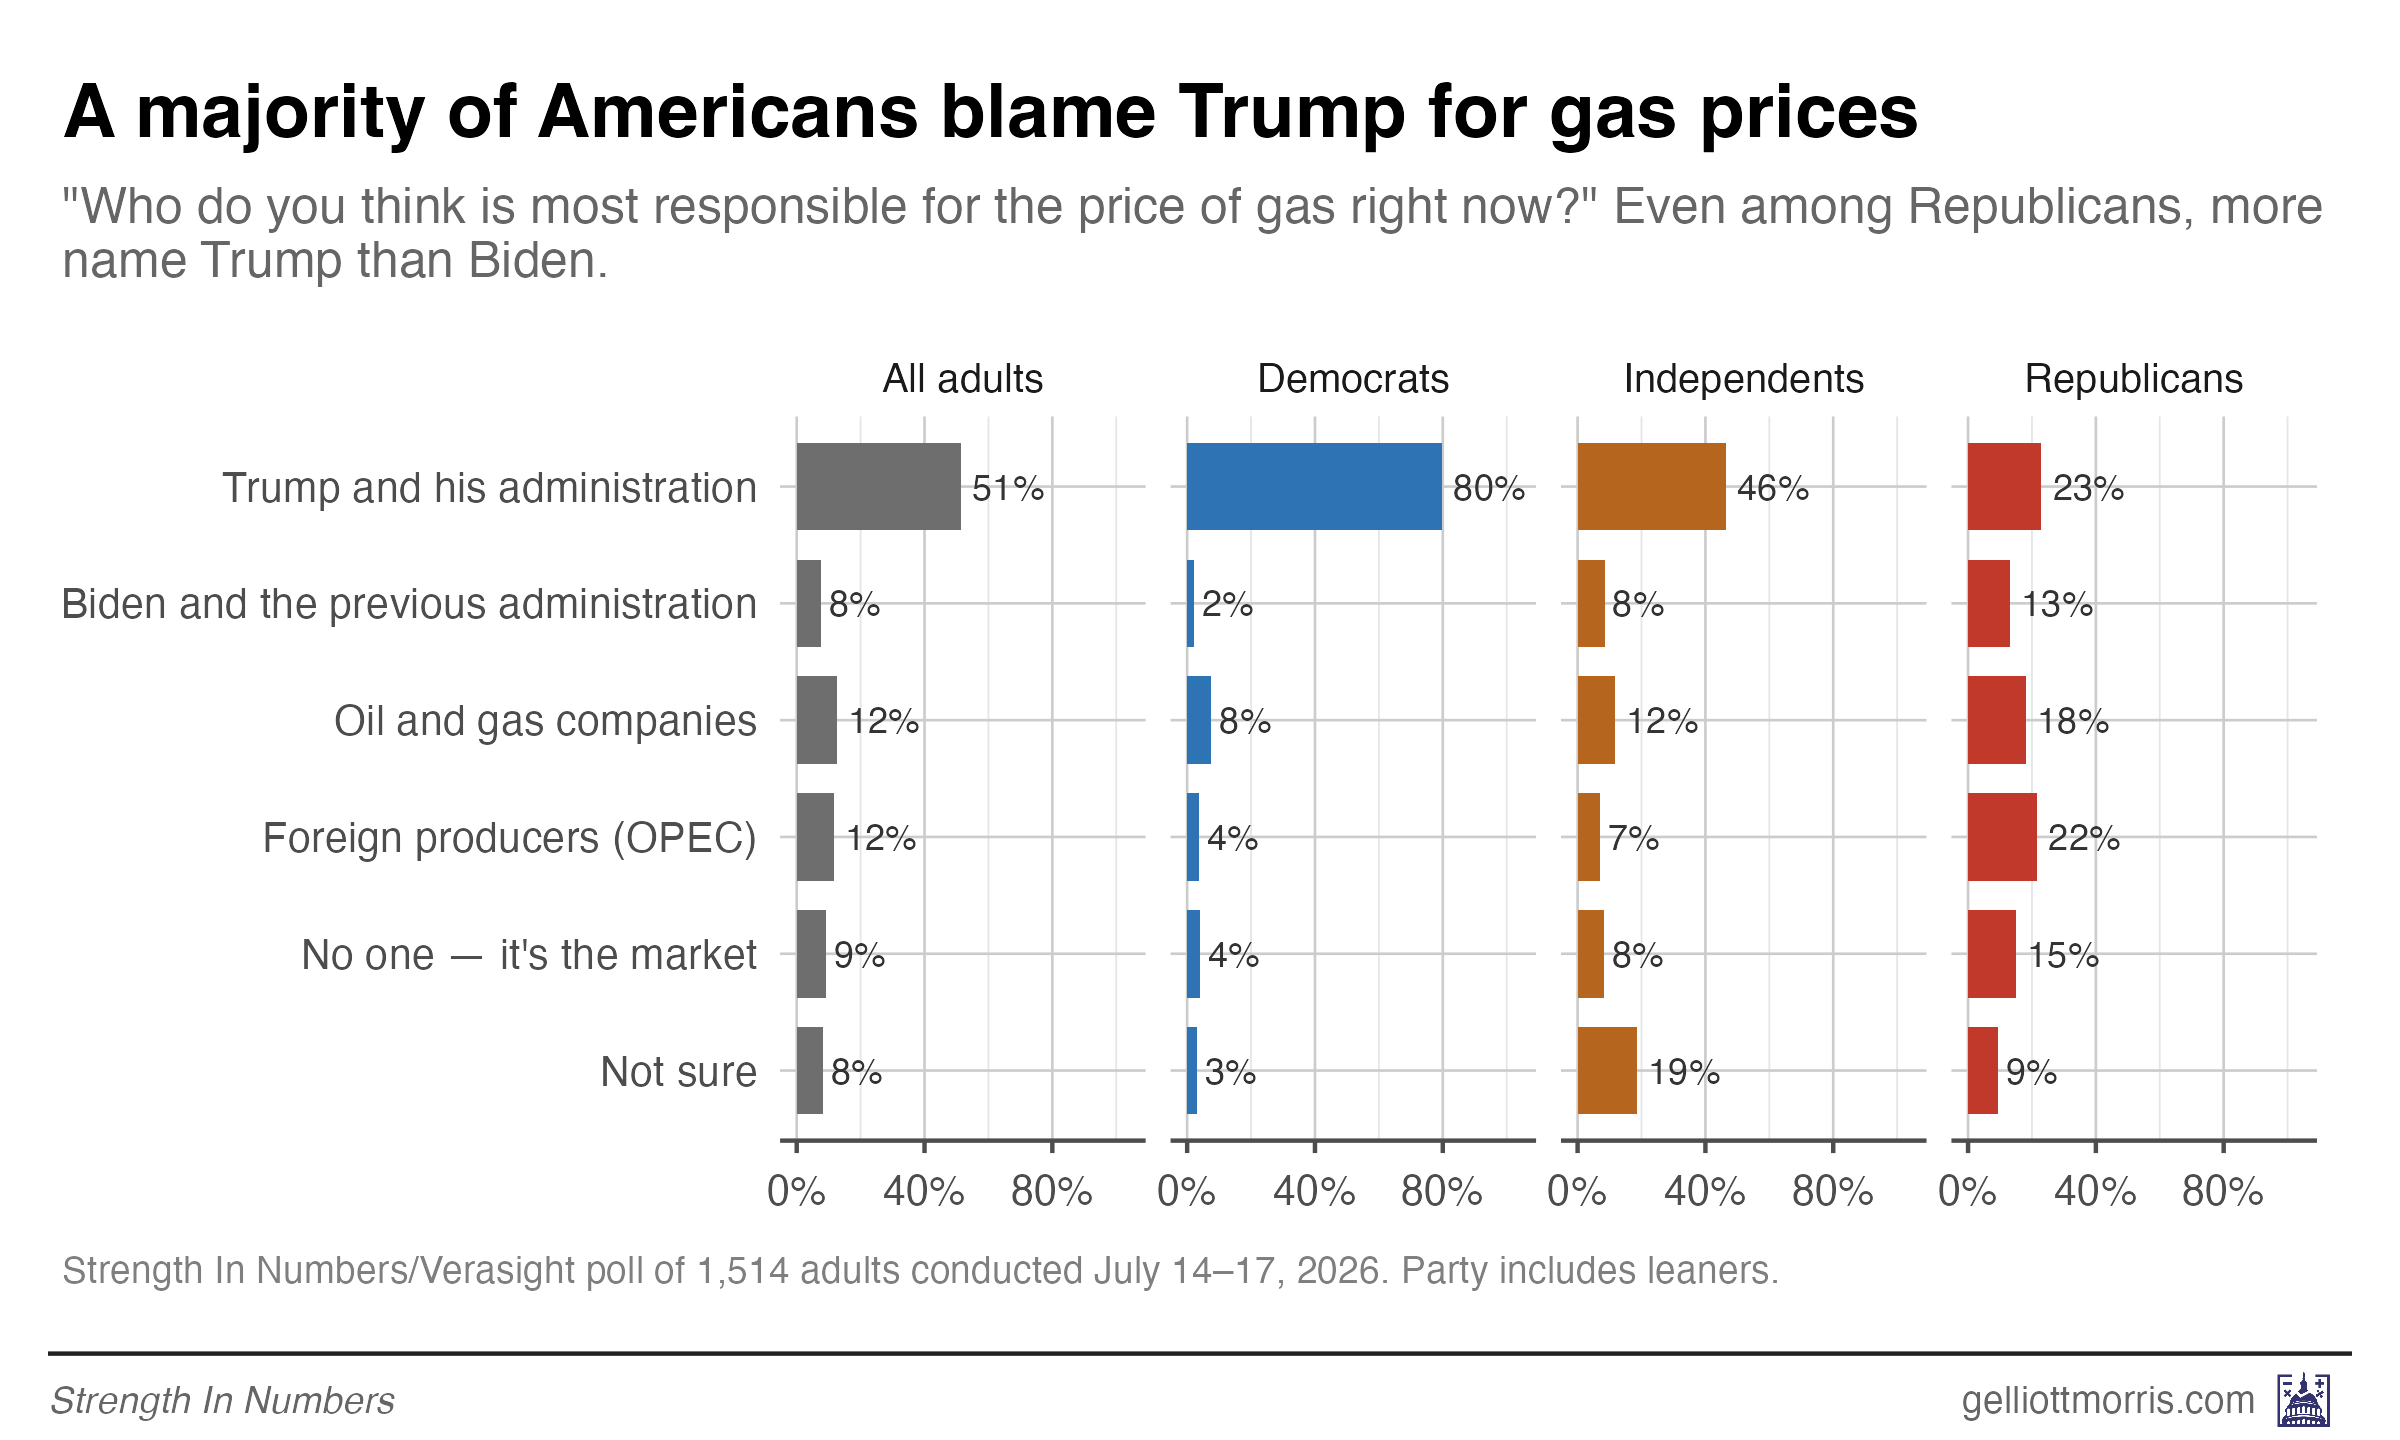
Even a plurality of Republicans said Trump was most responsible for gas-price inflation, a surprising finding given the level of political polarization in America today:
And this is not an abstract concern for families. Overall, 59% of Americans say higher gas prices have forced them to cut back or delay other spending, according to the July Strength In Numbers/Verasight poll.
This will have consequences in the midterms. Nearly half of Americans (47%) say gas prices will have at least “some” influence on their vote for Congress this year — another 21% say “a little” — while 23% say none at all.
Back in May, our poll found Americans blamed Trump over Biden 41–16 for the high cost of living broadly. He has not recovered ground since.
Throughout the 2024 presidential campaign, Trump claimed gas under Biden had hit “$5, $6, $7 and even $8 a gallon”. He spent years arguing voters should punish the president for the rising price of gasoline. Now, they are.
Trump scores best rating on handling prices this year (it’s still at-42)
Trump’s overall job rating barely moved in this month’s survey: Among all adults, 38% say they approve and 59% disapprove of the job he’s doing as president, a net of -21 against June’s -23. That change is inside the margin of error, but matches other polls showing a similar slight reversion in public sentiment to the president over the last few months. Other July surveys include: Washington Post/Ipsos at 37/61 and CNBC at 40/59, with an all-time low of 38/60 on his handling of the economy.
Trump’s net approval on prices and inflation rose to -42 from June’s -46 — the first move his way all year as oil markets rebounded from a lull in the U.S. war against Iran (fighting has since resumed since our interviews were conducted). Trump’s position on prices is still his worst issue by 13 points; at -42, the next-worst, health care, polls at -29 for the president.
The rest of the issue-rating graph looks like it has all year: government funding -24, jobs and the economy -23, education -20, elections and democracy -20, foreign policy -20, trade -20, deportations -13, crime -12, immigration -12. He breaks even on border security, 49/48, as he has since January. (A tie is not really a win.)
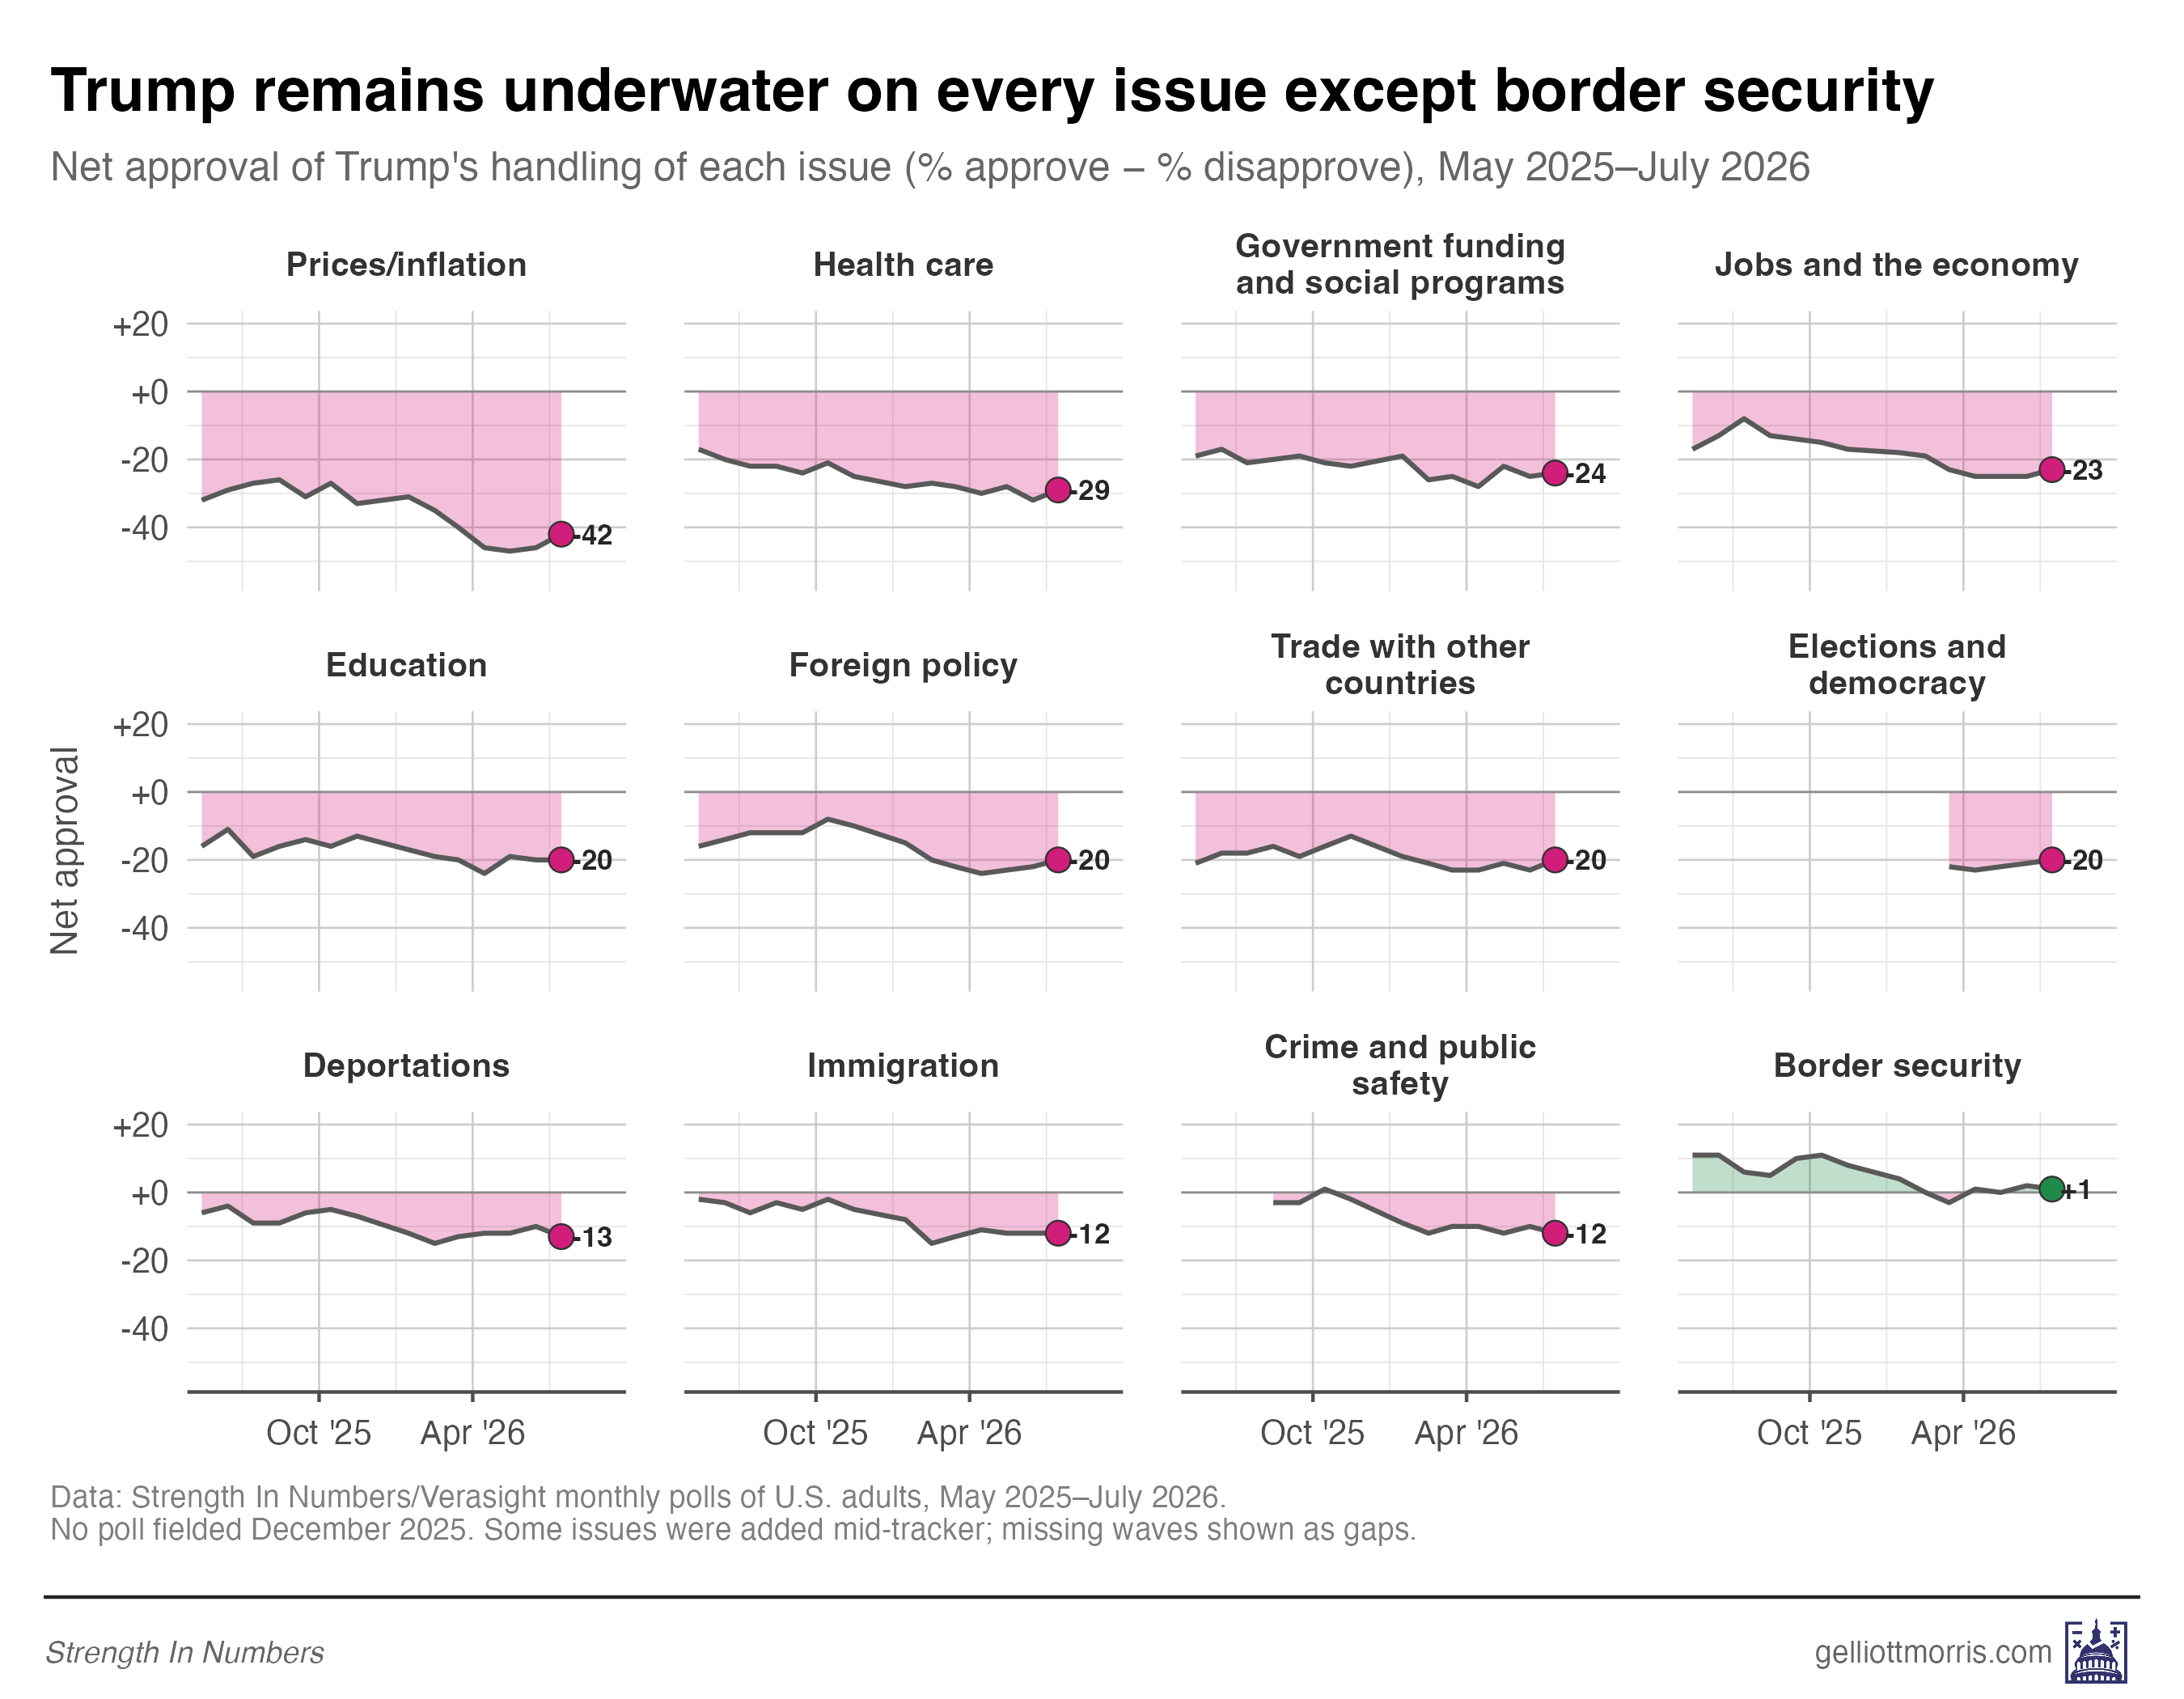
And on the issue voters care about most, he’s still 42 points underwater.
Prices are still the country’s top problem
36% of Americans name prices and inflation the single most important problem facing the country, unchanged from June and more than two and a half times the next-closest issues, elections and democracy (14%) and jobs (14%). Allowed to pick up to three problems, 58% include prices — jobs draw 40%, health care 35%, elections 24%.
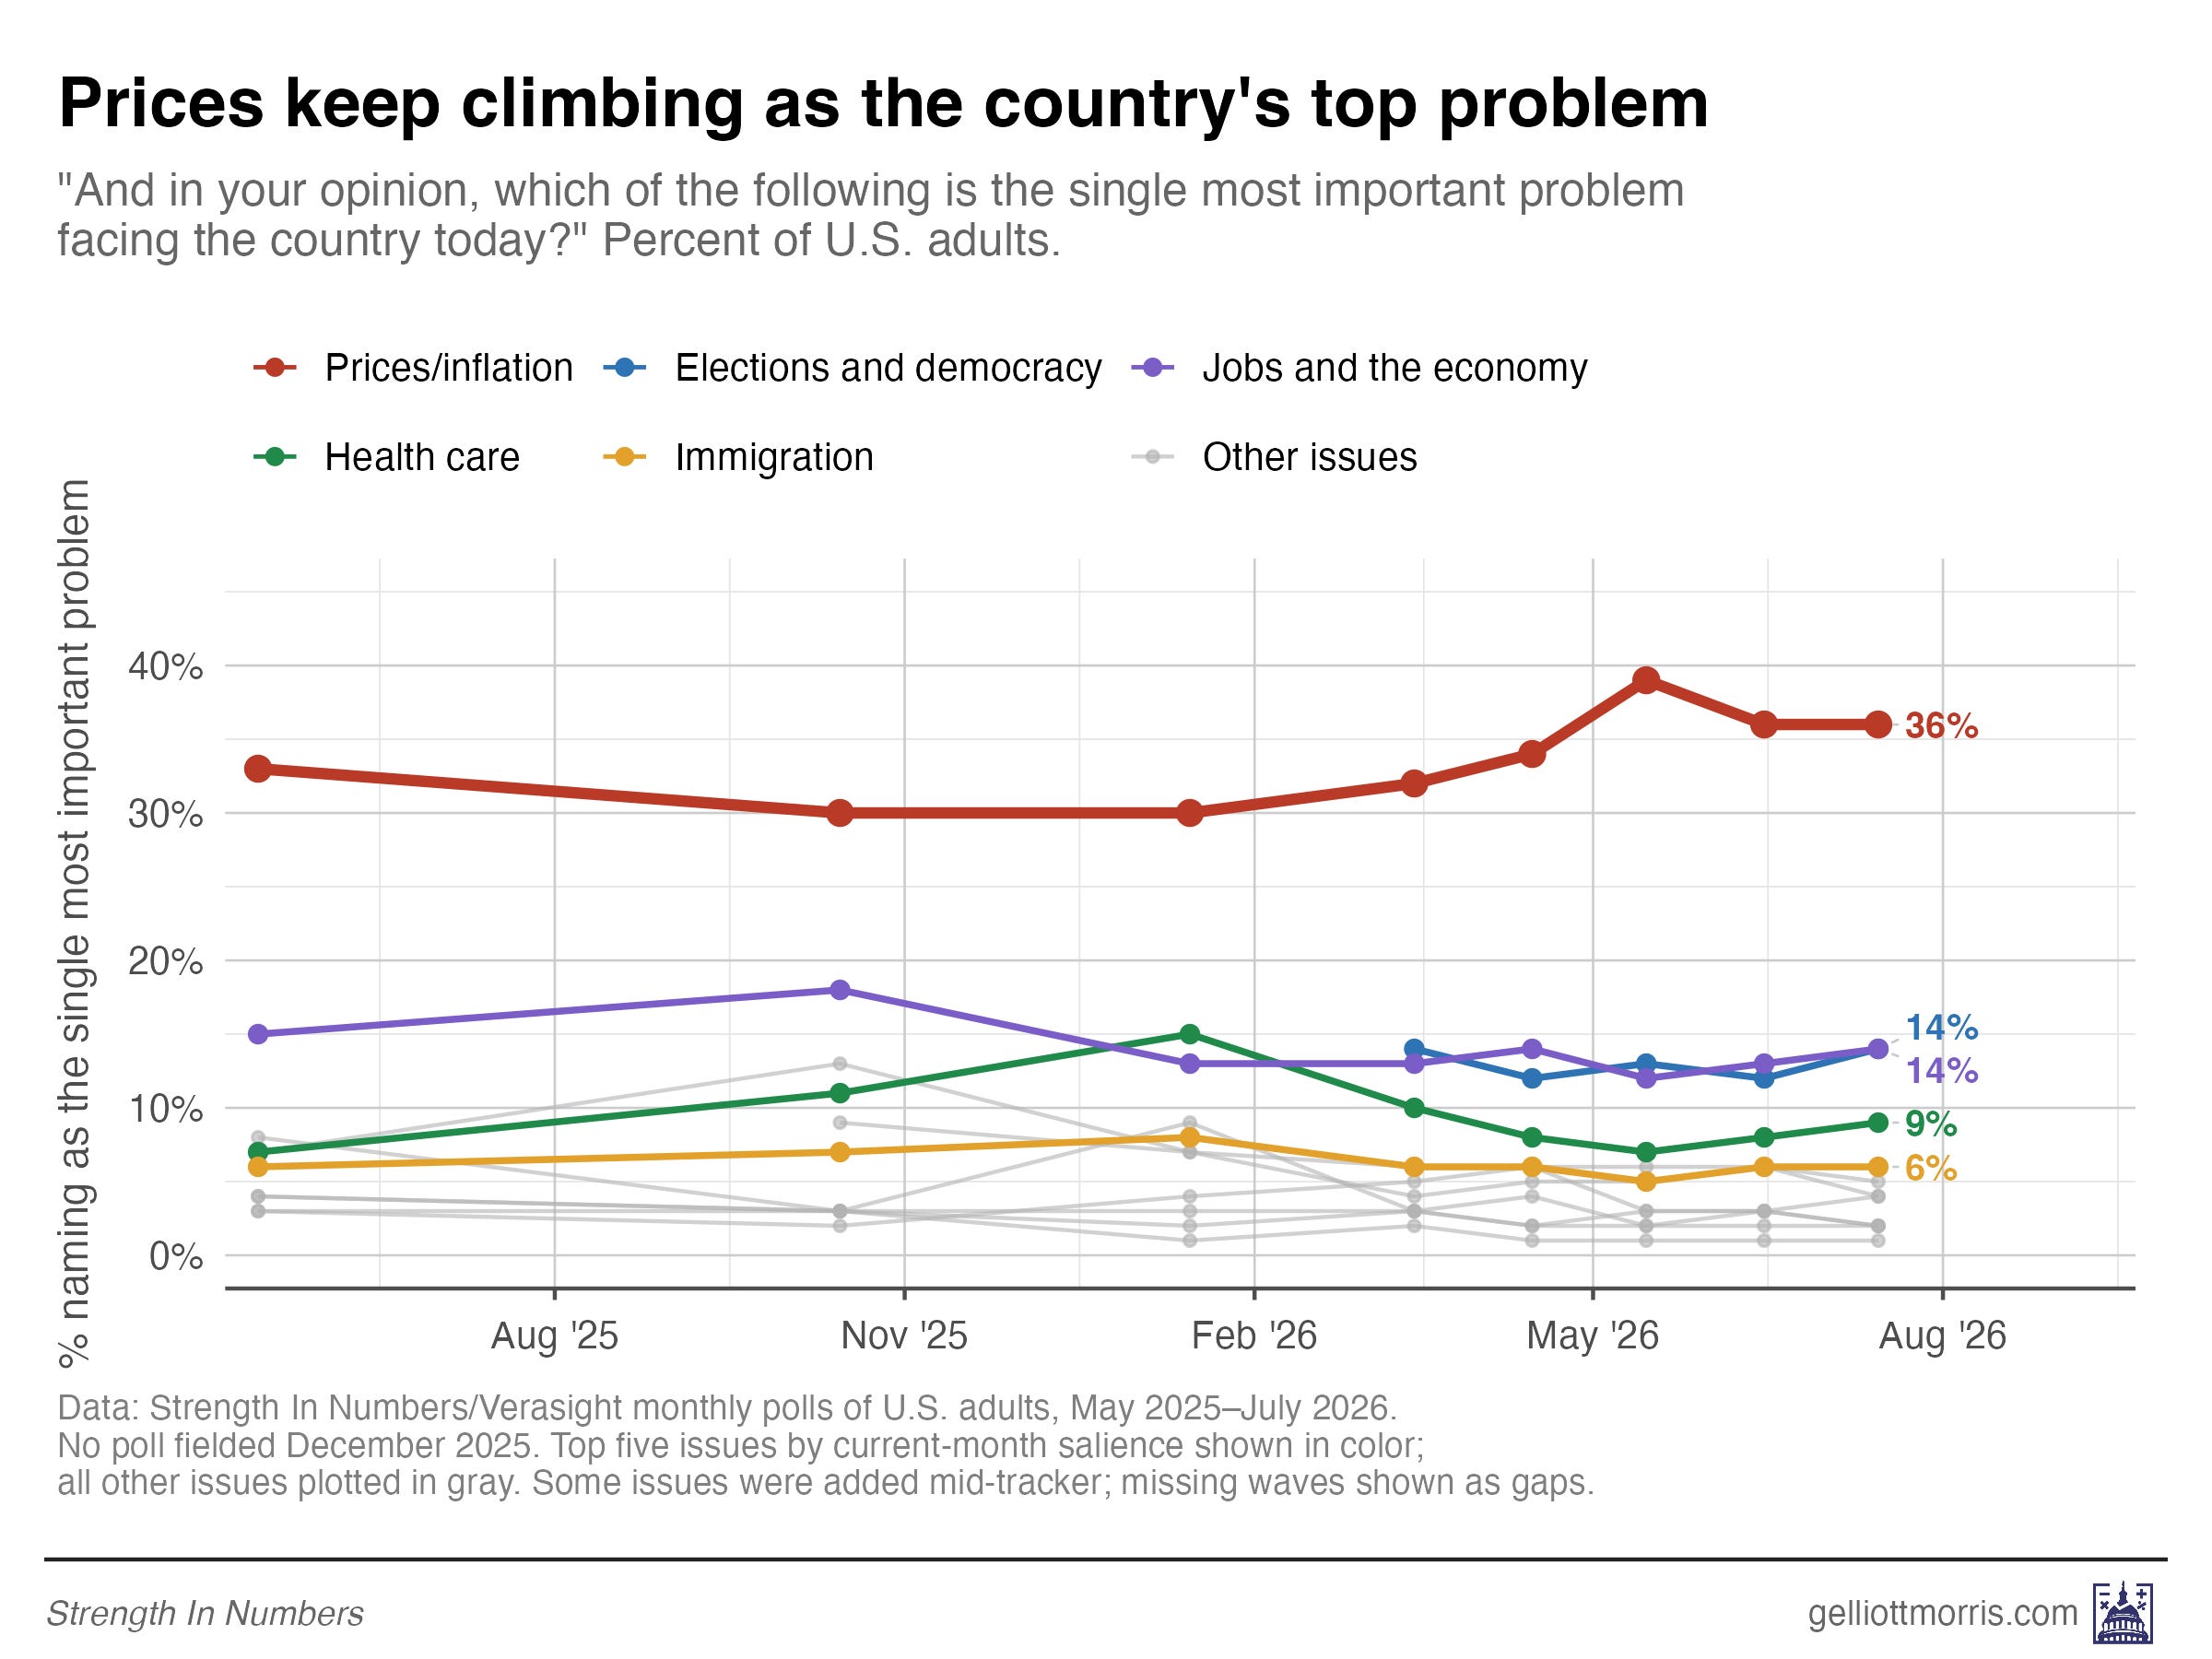
As has been Trump’s position since he was elected, he fails with voters on their top issue. But it’s not just him; the whole GOP is in trouble. Consider this:
Democrats still lead on the issues voters care about most
Democrats lead on trust to handle 8 of the 12 major issues we test: health care by 20 points, education by 16, government funding by 16, elections and democracy by 10, prices by 7 (43–36, with 21% unsure — the highest don’t-know on the board), and jobs, trade, and foreign policy by 5 each. The three largest gaps on the board are all Democratic.
Republicans lead on four issues they have held a long-term, but typically much larger, advantage: Americans trust them more to handle border security (by 14), crime (R+9), deportations (+3), and immigration (+1 — effectively tied). If you are trying to figure out which of these advantages are most important, note that border security appears in 11% of respondents’ listed top-three issues in our poll and crime is at 19% — compared to 58% for prices. Republicans lead on the issues voters care about least.
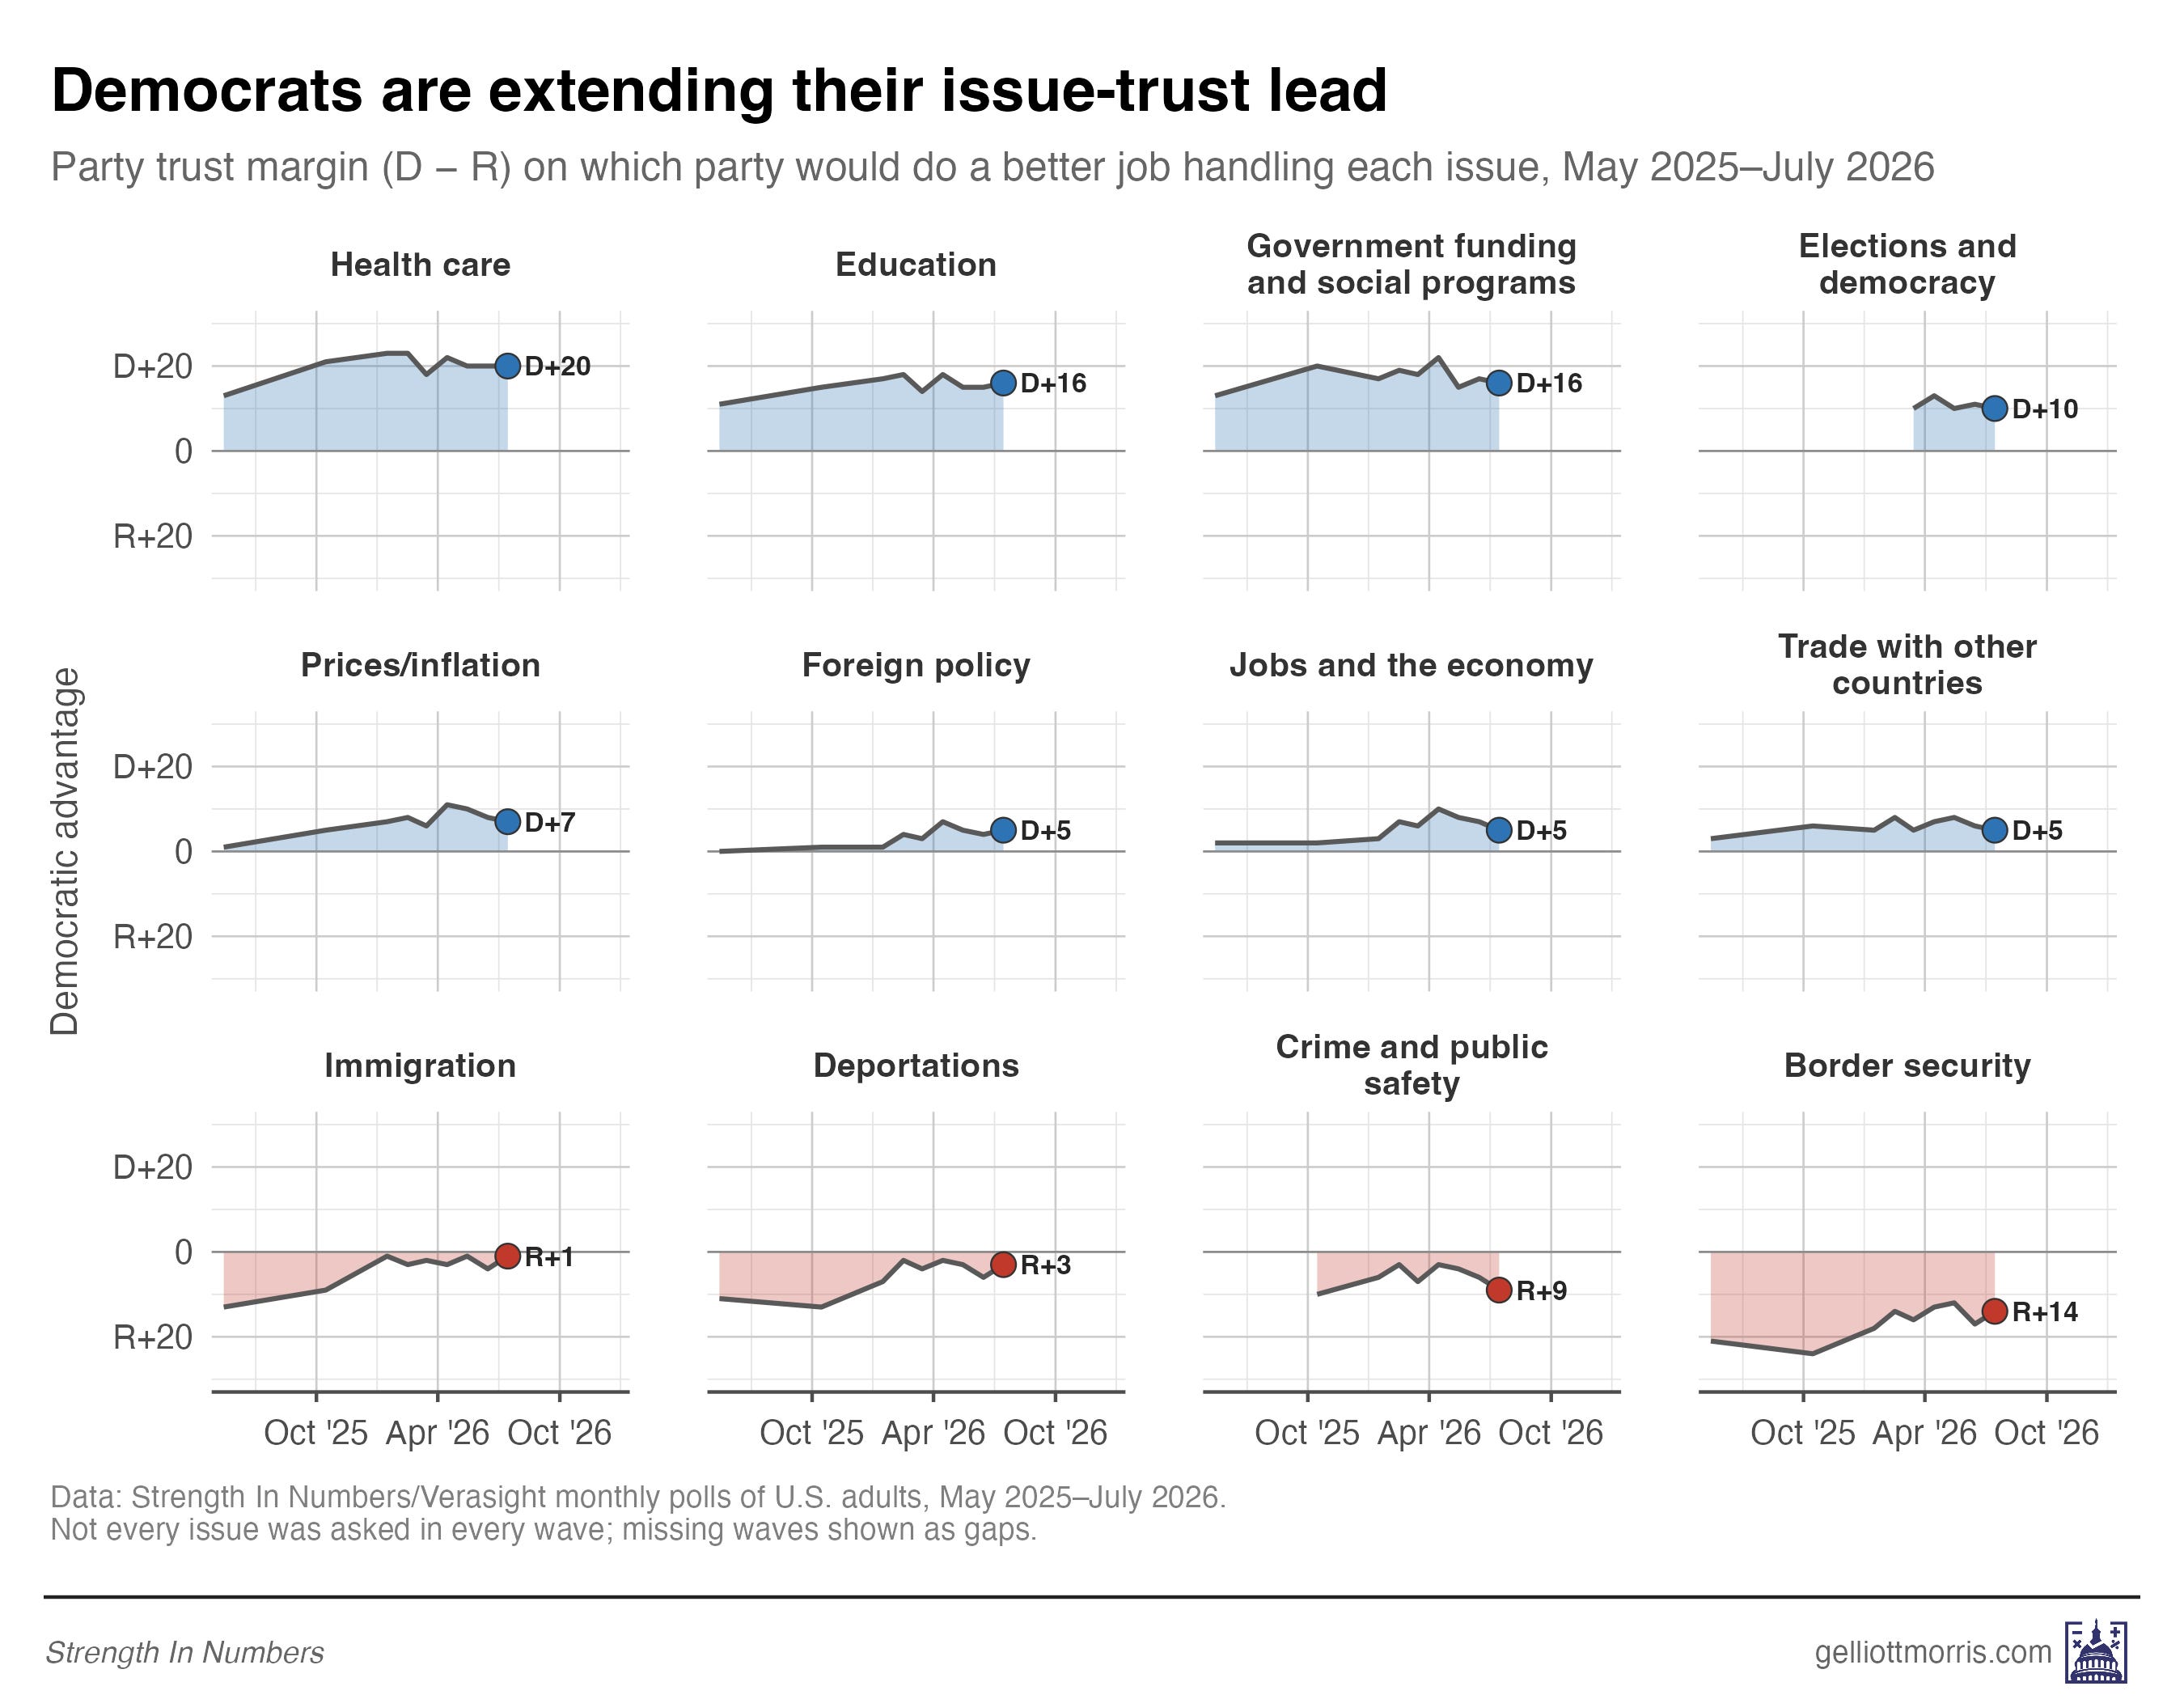
These leads aren’t new, either. Democrats have held most of them for months.
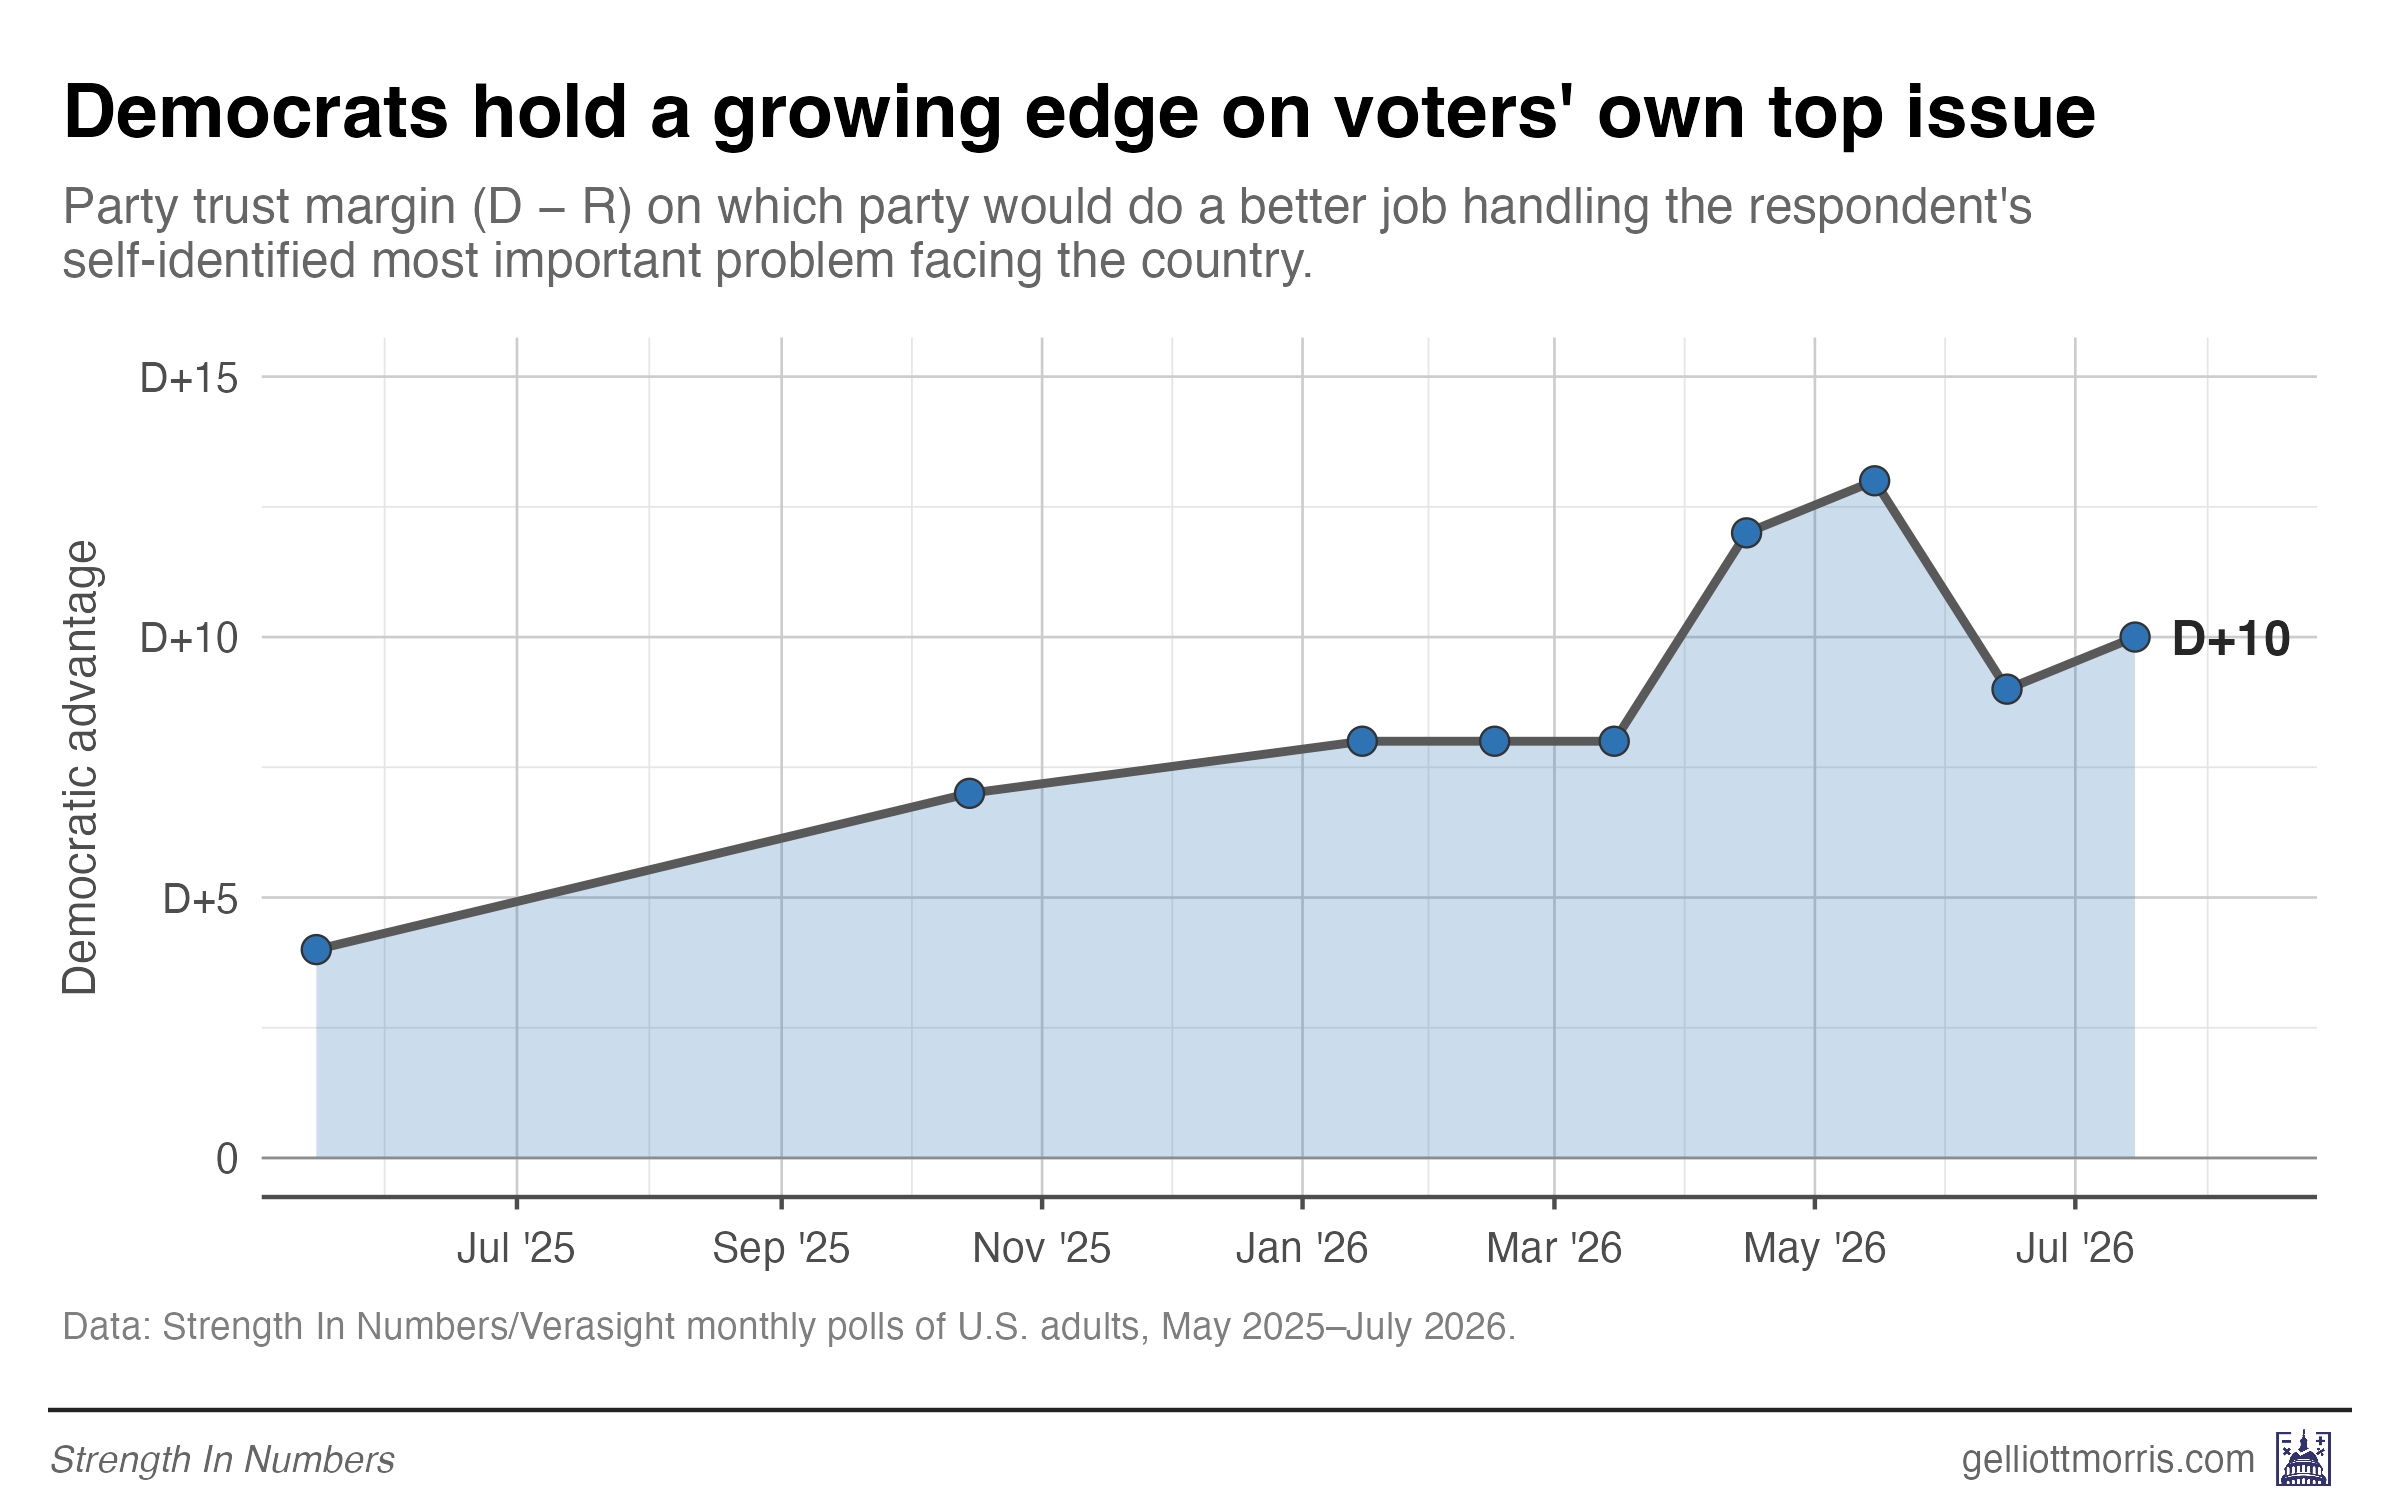
In my opinion, the single most compelling measure we have on issue trust (and one no other pollster asks regularly) is trust on the problem each voter names as the most important to them — and there Democrats lead 47–37. That ten-point edge is in line with June’s nine and just below May’s series-high 13. The Democratic Party has three straight months of a durable, roughly ten-point advantage on the things voters say matter most.
Democrats have taken or are holding even on the two issues Republicans won on in 2024 — prices/jobs and immigration.
Democrats lead the generic ballot for a 14th straight poll
Democrats lead the generic congressional ballot among registered voters 50–43, with 7% undecided, in our July Strength In Numbers/Verasight poll. That +7 is the same margin as in June, and the third straight wave between D+7 and D+8. Among all adults the party leads 48–42. Across fifteen months and fourteen polls (we skipped December 2025), Democrats have led every single time we asked the generic ballot, by margins of between 5 and 10 points among registered voters.
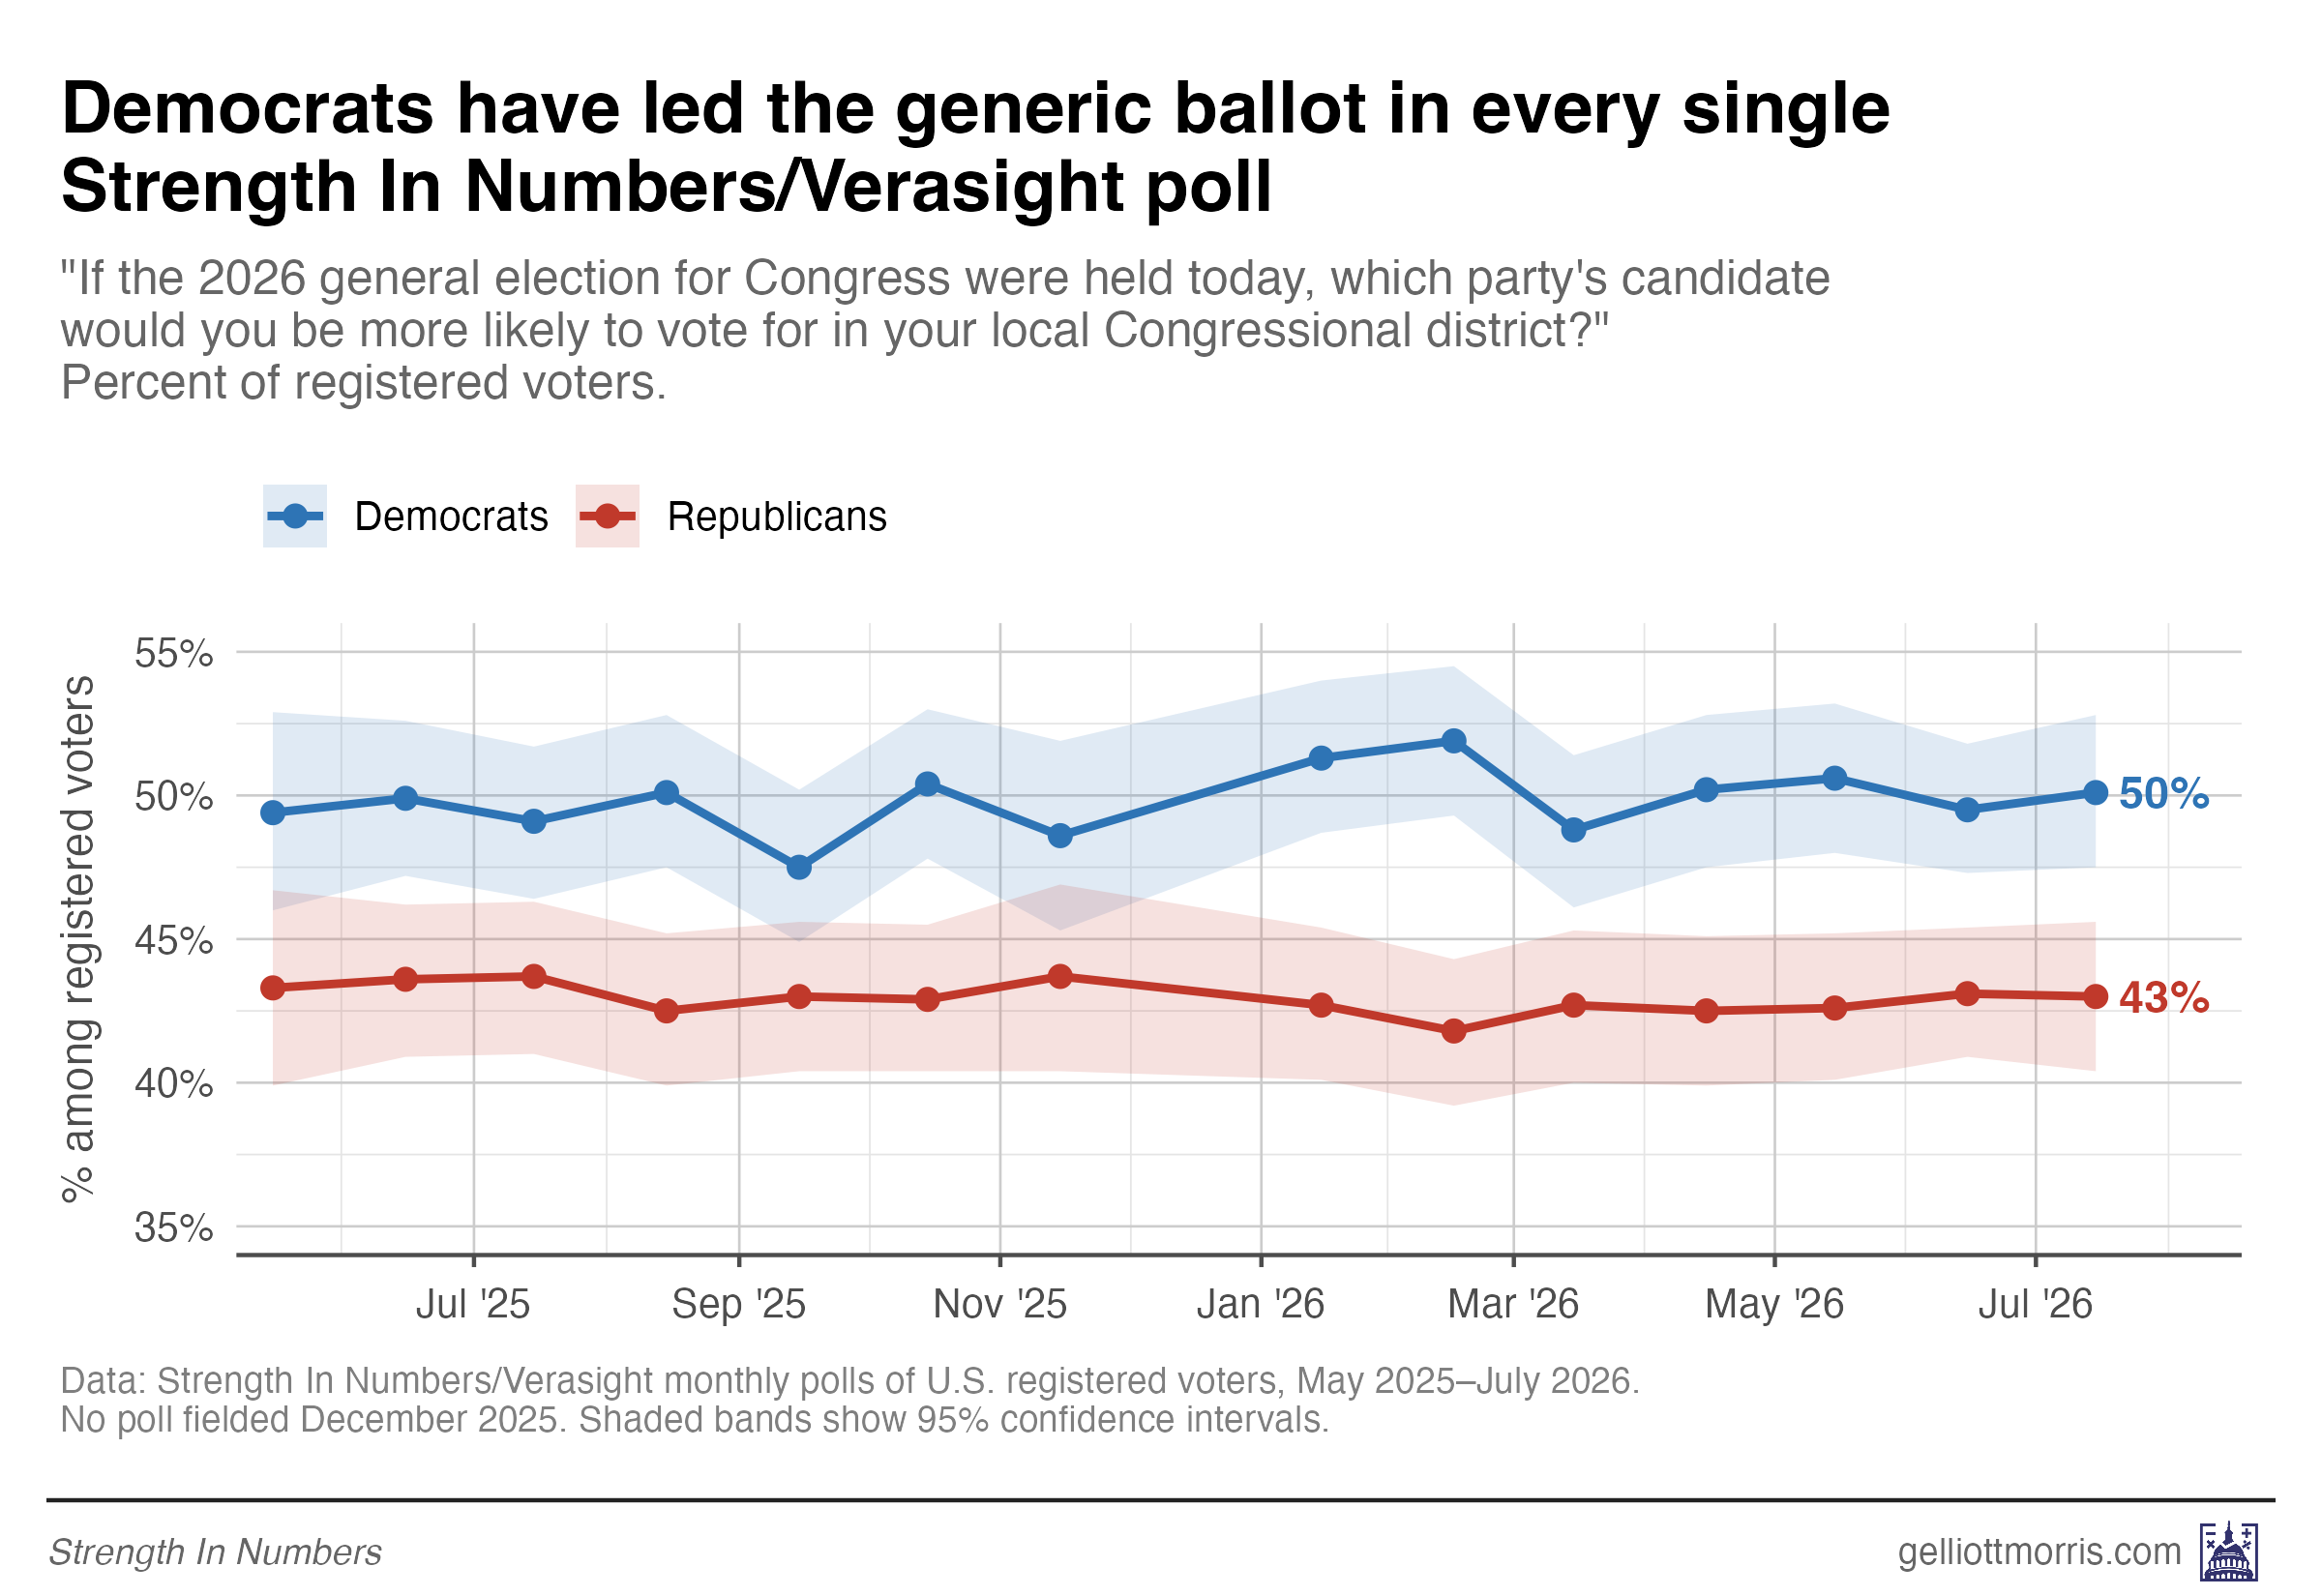
And no, this isn’t a party-composition artifact — Democrats don’t just lead the generic ballot in our poll because our poll has too many Democrats. The partisan makeup of our samples is pinned to Pew’s NPORS benchmarks and barely moves from month to month. The Democratic lead in the generic ballot today is actually larger than their lead in leaned party identity (which assigns independents to the party they say they “lean” toward):
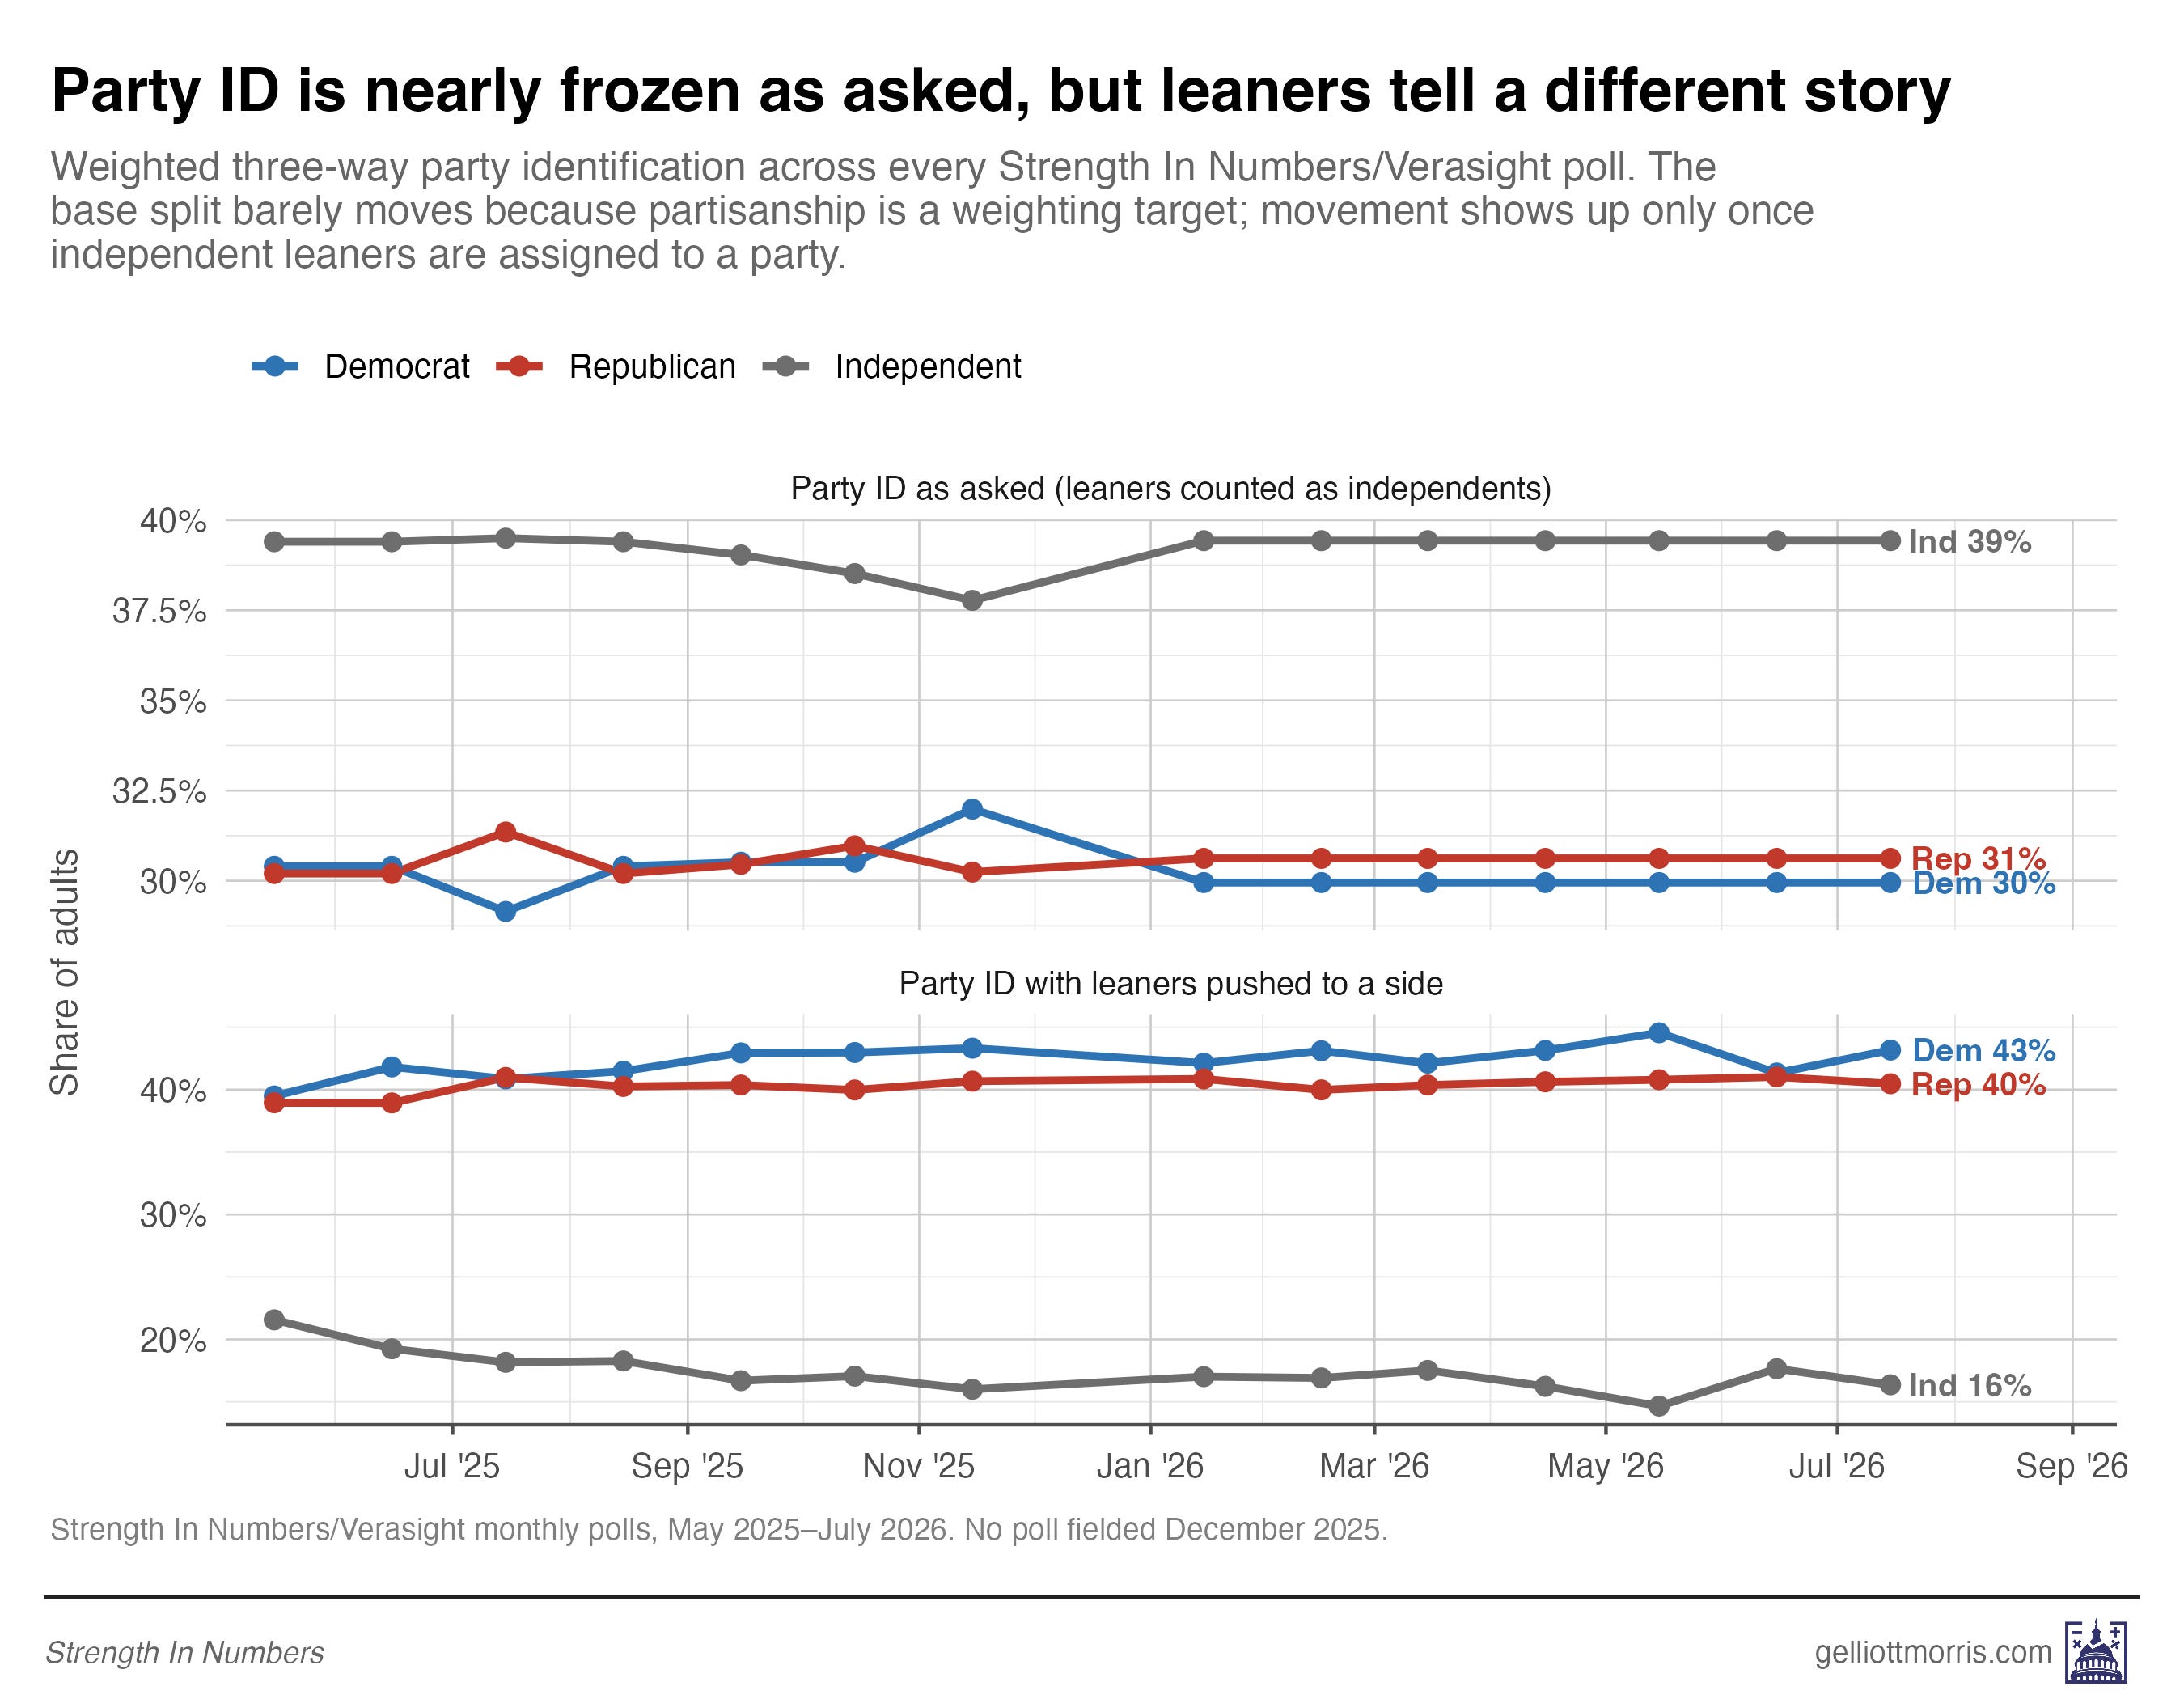
More on party ID weighting in a Data Lab post coming soon.
One question that really matters for November is whether Democrats have a similar or larger lead among voters who are likely to turn out in November. I’ll have those numbers on Wednesday.
Nearly half the country still says things are going poorly
In what is becoming a frustratingly recurring negative finding in our polling, roughly a majority (49%) of Americans say things are going poorly and major, disruptive changes are needed to get the country back on course. That’s essentially unchanged from June’s 50%. Two potential angles here:
Pessimism this broad is historically a dire warning for the party in power.
This growing popularity of this anti-system sentiment may be part of the reason why the DSA is making such inroads in Democratic Party politics this year.
Subscribers’ questions: data centers, balancing the budget, and Trump’s mental sharpness
And now for the fun part. Each month, subscribers suggest questions and I pick a few to field. (Leave your suggestions for next month in the comments below!)
Who should pay for AI’s power bill? As tech companies race to build data centers that consume enormous amounts of electricity, 64% of Americans say those companies should pay for the new power plants and grid upgrades needed to run them, not taxpayers. Just 4% say electric utilities should cover it by raising residential rates, 9% say the federal government should fund construction, and 10% say the costs should be shared.
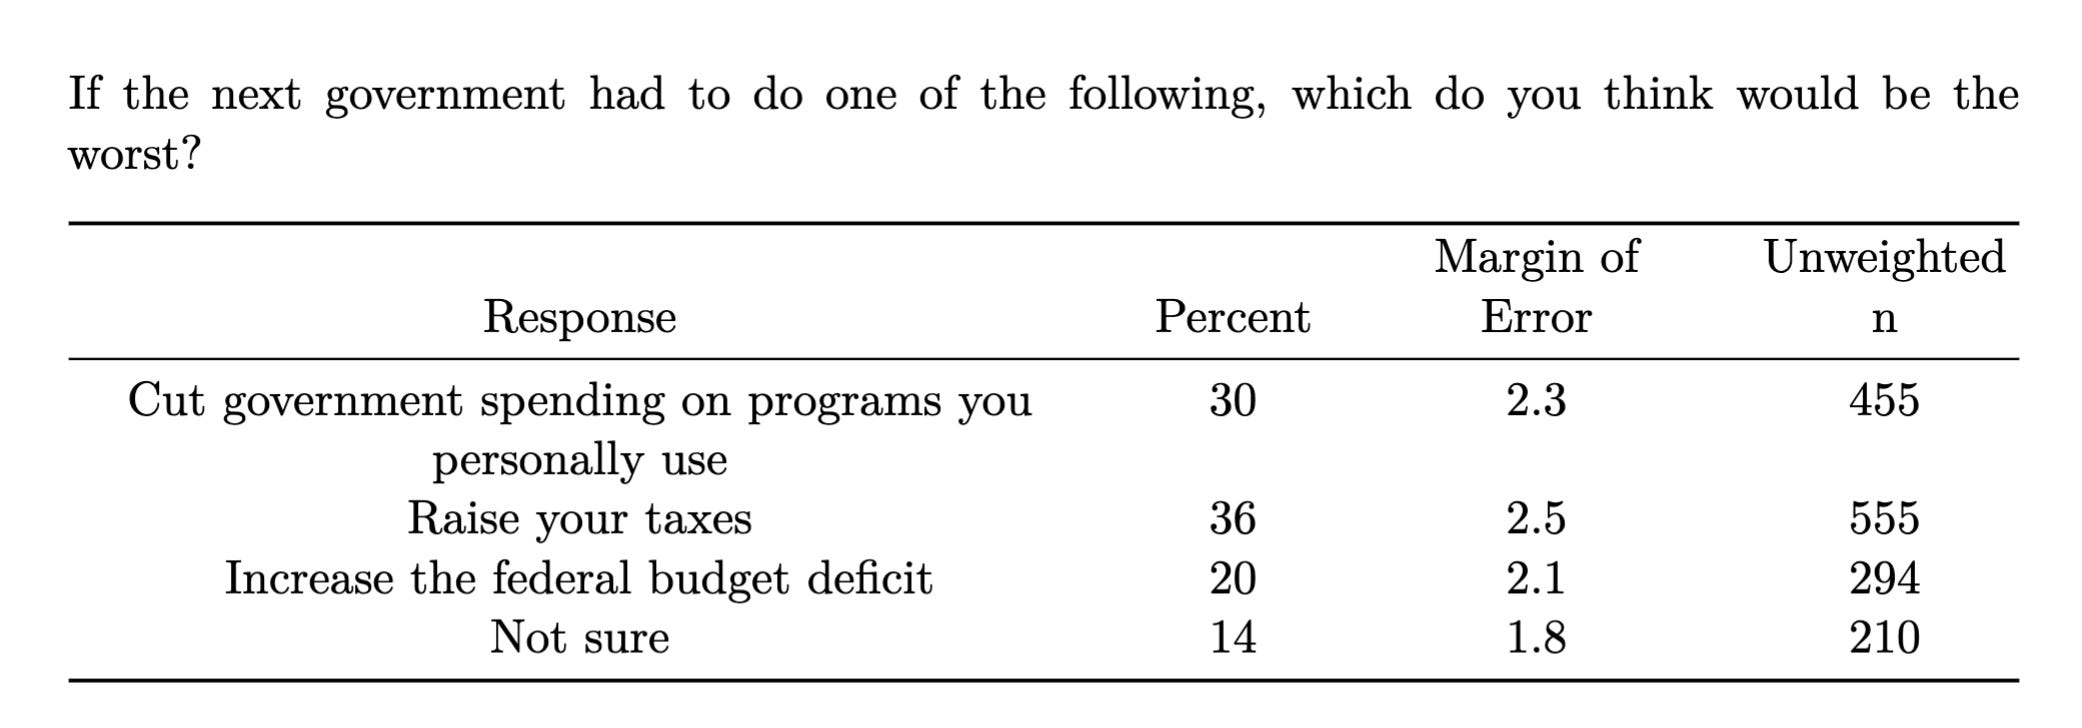
The least-popular deficit fix. It is no secret that America is in an increasingly precarious fiscal position. But its government’s commitments to entitlement spending and other programs (increasingly, the military) put it in a bind. A lot of pollsters ask people how they want the federal government to fix its budget problem, but we asked Americans which of three options they think would be worst: raise taxes, cut spending, or nominally grow the deficit.
Over a third of adults (36%) said raising taxes, narrowly ahead of cutting spending on programs (30%. People were most willing to allow a flat increase the federal budget deficit. Voters would rather borrow than pay more or lose services. To be fair to them, there doesn’t seem to be any consequences to massive borrowing, anyway.
And Trump’s mental sharpness. An ABC News/Washington Post/Ipsos poll in July 2024 found 44% of Americans thought Trump had the mental sharpness to serve effectively as president, against just 14% for Biden — a 30-point gap.
Today, Trump is 80 and has increasing bouts of trouble in public (he sleeps a lot during press conferences and frequently slurs his speech), and voters are taking note. Overall, 46% of Americans rate his sharpness as president as “poor” — within a few points of the 50% who retroactively said that about Joe Biden.
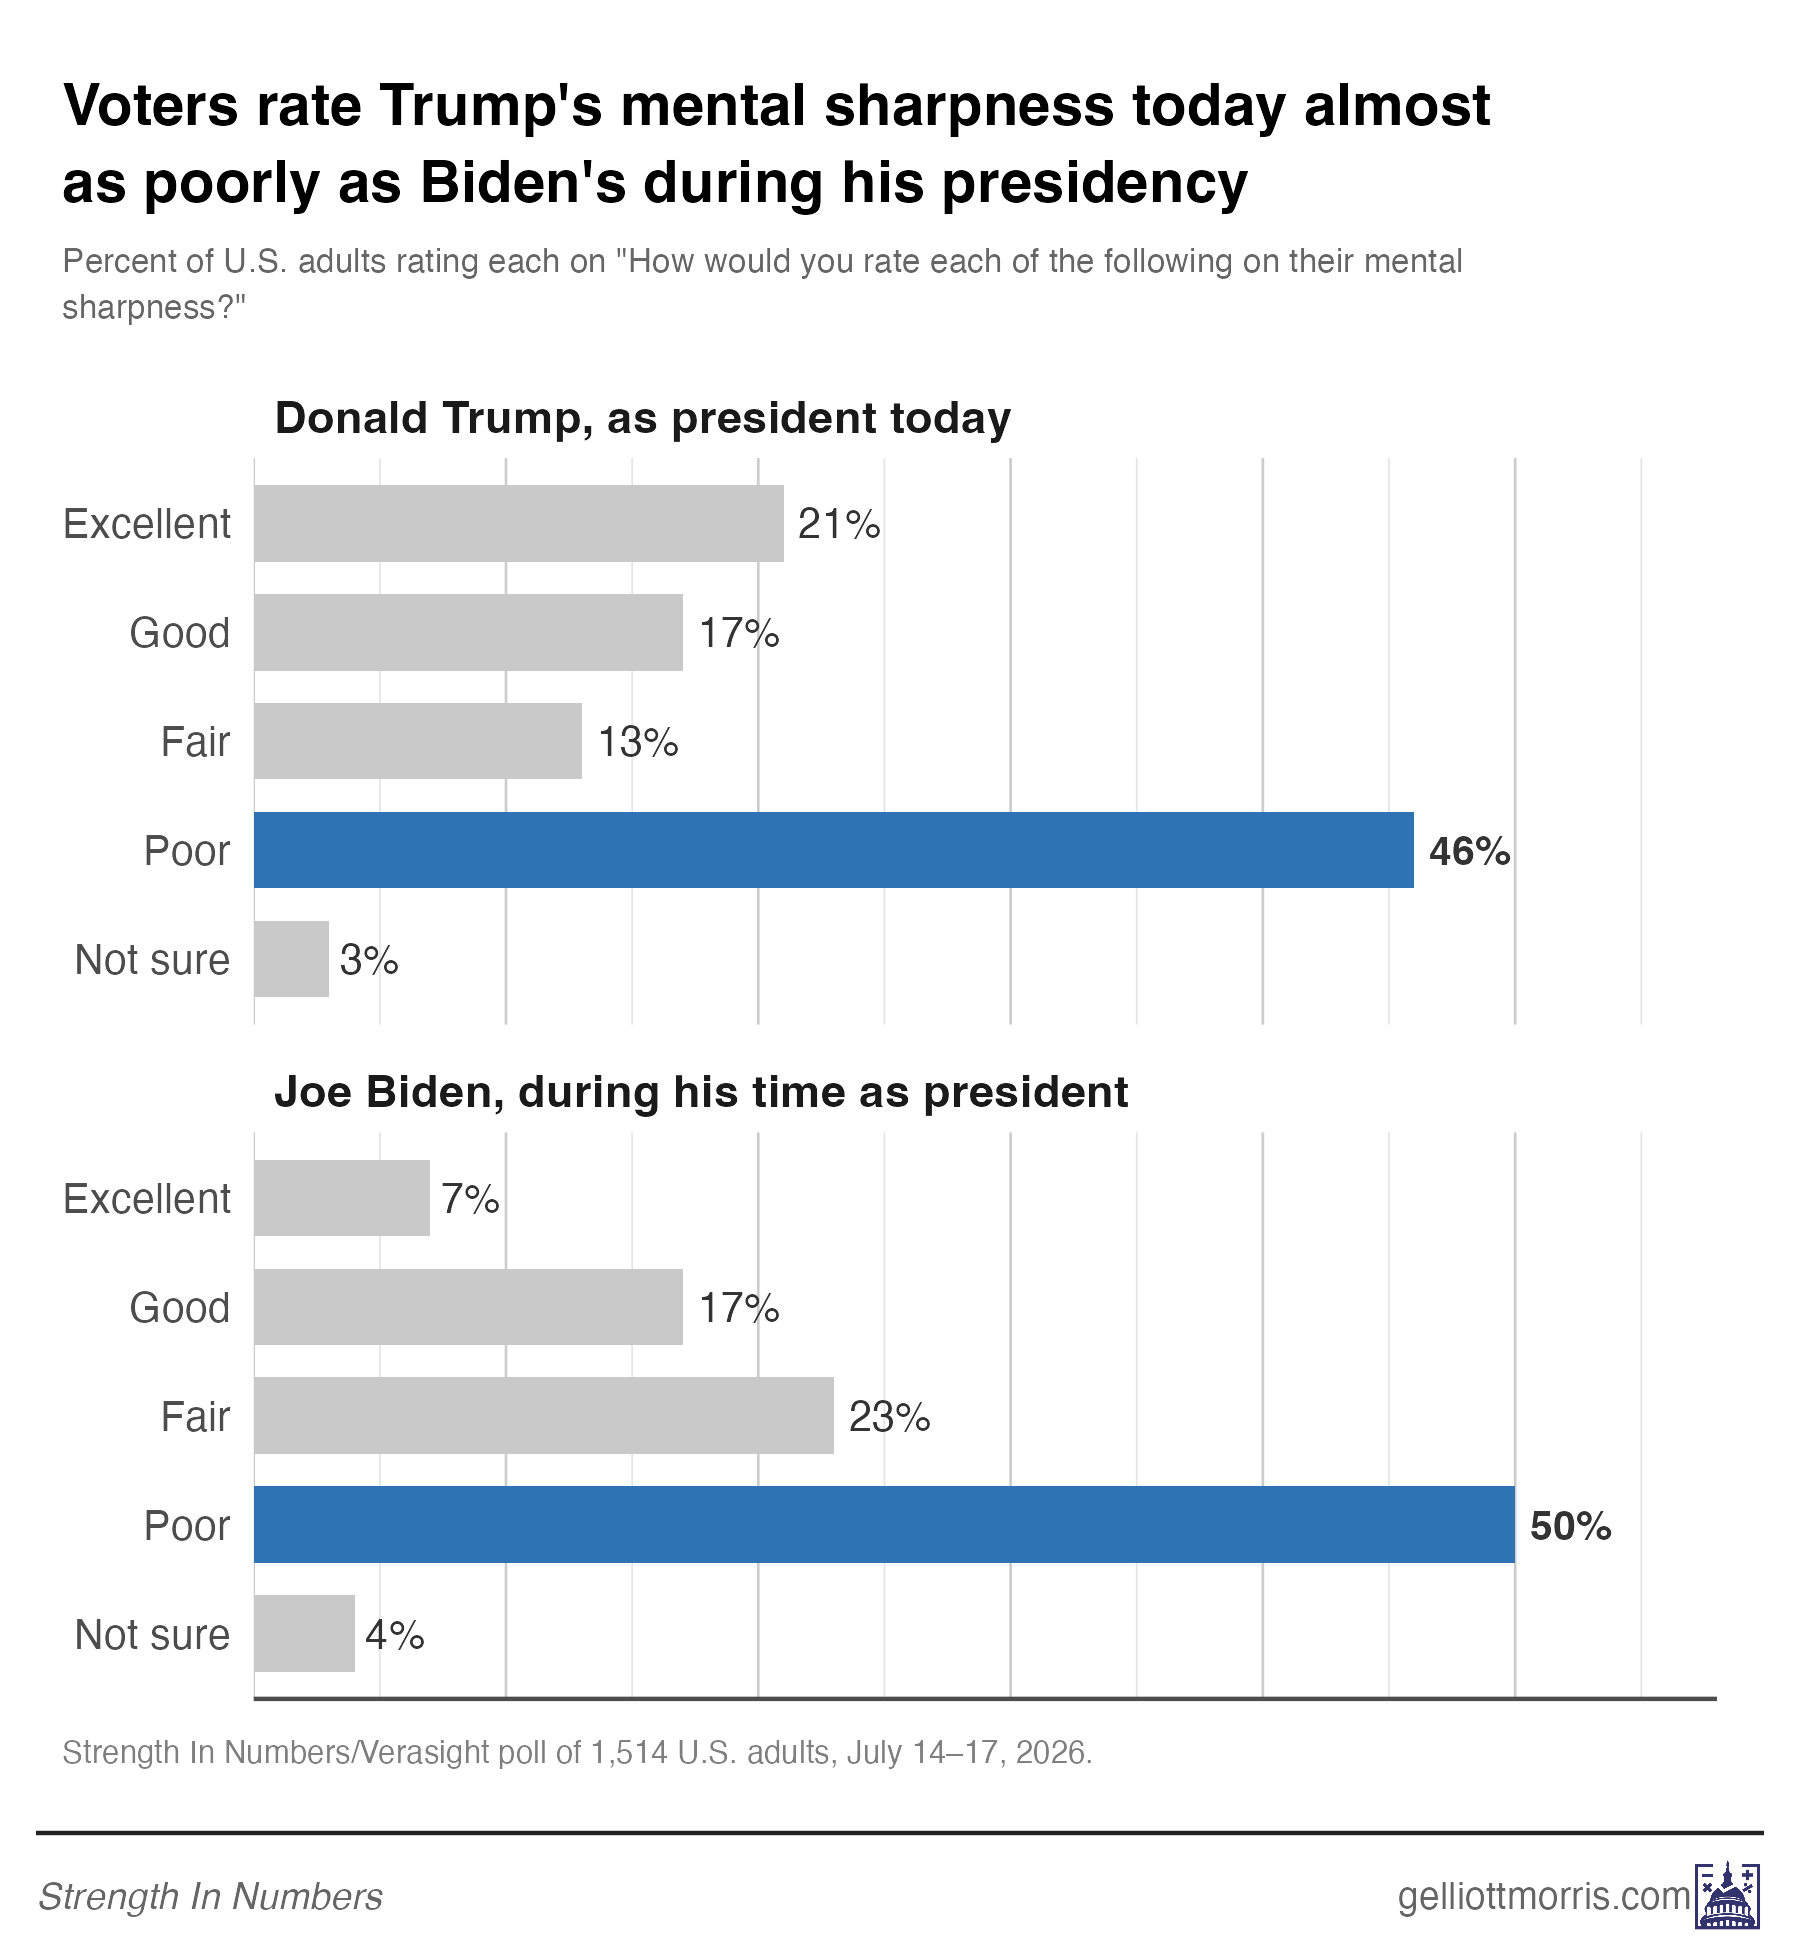
Trump does keep a real edge at the top of the scale — 38% rate his sharpness excellent or good, vs 24% for Biden — but confidence is still the minority position. Among independents who lean toward neither party (n=228, so roughly ±7 points), 48% each say the presidents are/were in poor condition.
I’m holding some questions in this month’s survey for release later in the week. On Wednesday, I’ll cover the midterm enthusiasm gap — who actually says they’ll show up in November, and what a likely-voter screen does to the parties’ generic ballot positions. On Friday, I’ve got a Deep Dive feelings about the SAVE Act. Most Americans back requiring documentary proof of citizenship to register to vote — but who says they couldn’t easily produce the documents, and what do Americans really believe about noncitizen voting?
Make sure you’re signed up to get those in your inbox.
And if this type of work is useful to you or you believe in supporting it for the public good, consider becoming a paid member of this Substack. Paying subscribers to Strength In Numbers make it possible for me to spend time on this original, independent, data-driven political journalism that’s not beholden to any corporation or billionaire donor. Support my work and get access to articles like this one for $10/month or $90/year.
Methods statement: Verasight collected the data for this survey from July 14–17, 2026. The sample consists of 1,514 United States adults ages 18 and above. The data are weighted to match the June 2026 Current Population Survey on age, race/ethnicity, sex, income, education, region, and metropolitan status, as well as to a running three-year average of partisanship distributions from the Pew Research Center NPORS benchmarking surveys and population benchmarks of 2024 vote. The margin of sampling error is ±2.6%.
G. Elliott Morris prepared the topline document and this writeup for Strength In Numbers. Strength In Numbers had input on question wording, but all other methodological decisions were made and carried out by Verasight to ensure independence of the data-generating process behind these results. Verasight also reviewed the questionnaire.
You can download a full topline file, key crosstabs, and full methodology statement at the Strength In Numbers/Verasight polling portal. The paywalled section containing full crosstabs and more interactive graphics is updated.
If you have any questions about this poll or the release, please email polling[AT]gelliottmorris.com.
Have a suggestion for next month’s poll? Leave it in the comments below.


ALMOST!? Trump is sundowning before our eyes and he is dangerous in a way no other president has ever been.
Great work! I’m wondering if there is any data on how people who couldn’t vote in 2024 may be likely to vote in 2026 or even 2028. My youngest is now registered to vote for the first time and I’m curious about his demographic.