


In September, I wrote that the polls might be underestimating Democrats, not Republicans, as people were claiming at the time, because of how pollsters were adjusting their samples to be politically representative. I didn’t expect to be quite this right. Generic-ballot polls in the final three weeks of the campaign had Democrats ahead by about 9 points, and the party is on track to win the national House vote by about 14. The final pre-election Strength In Numbers poll put Democrats up 12.
Pollsters have spent the past week arguing about why they underestimated the Democrats. One natural explanation is non-response bias — the idea that Democrats, or the voters swinging toward them, were less likely to answer surveys even within demographic and partisan groupings, the mirror image of what went wrong in 2016 and 2020. Another theory is that turnout models were wacky: in this theory, pollsters reached the right people, but guessed wrong about which of them would actually vote.
I’ve spent the week digging through our own Strength In Numbers/Verasight data and every public poll in the database at FiftyPlusOne.news. My read is that turnout explains most of the miss. The people included in most high-quality samples look representative of the public politically, but the likely-voter models that decided which of them to include in the final poll were wrong. It looks like the models that leaned hardest on past vote history were the most wrong.
Strength In Numbers is a reader-funded newsletter on public opinion, elections, and American democracy. This work is possible because it is supported by paying newsletter subscribers. If you want to help keep this project independent, consider becoming a paying member today.
The polls missed by slightly more than usual
First, some context on how the polls did in the first place. In the House generic ballot and across individual Senate, House, and governor races that have reported at least 95% of their votes so far, Democrats beat their final-three-week polling averages by 3.5 points on average, compared with a typical miss of about 2.8 points (in one direction or the other) since 1998. That makes 2026 a bad year for the polls, but not a historic one. It’s the fourth-largest miss in our data, behind 2020, 1998, and 2016.
What’s surprising to people is the direction of the miss. This is the first time since 2012 that the polls underestimated Democrats overall, after every presidential cycle from 2014 to 2024 leaned the other way.
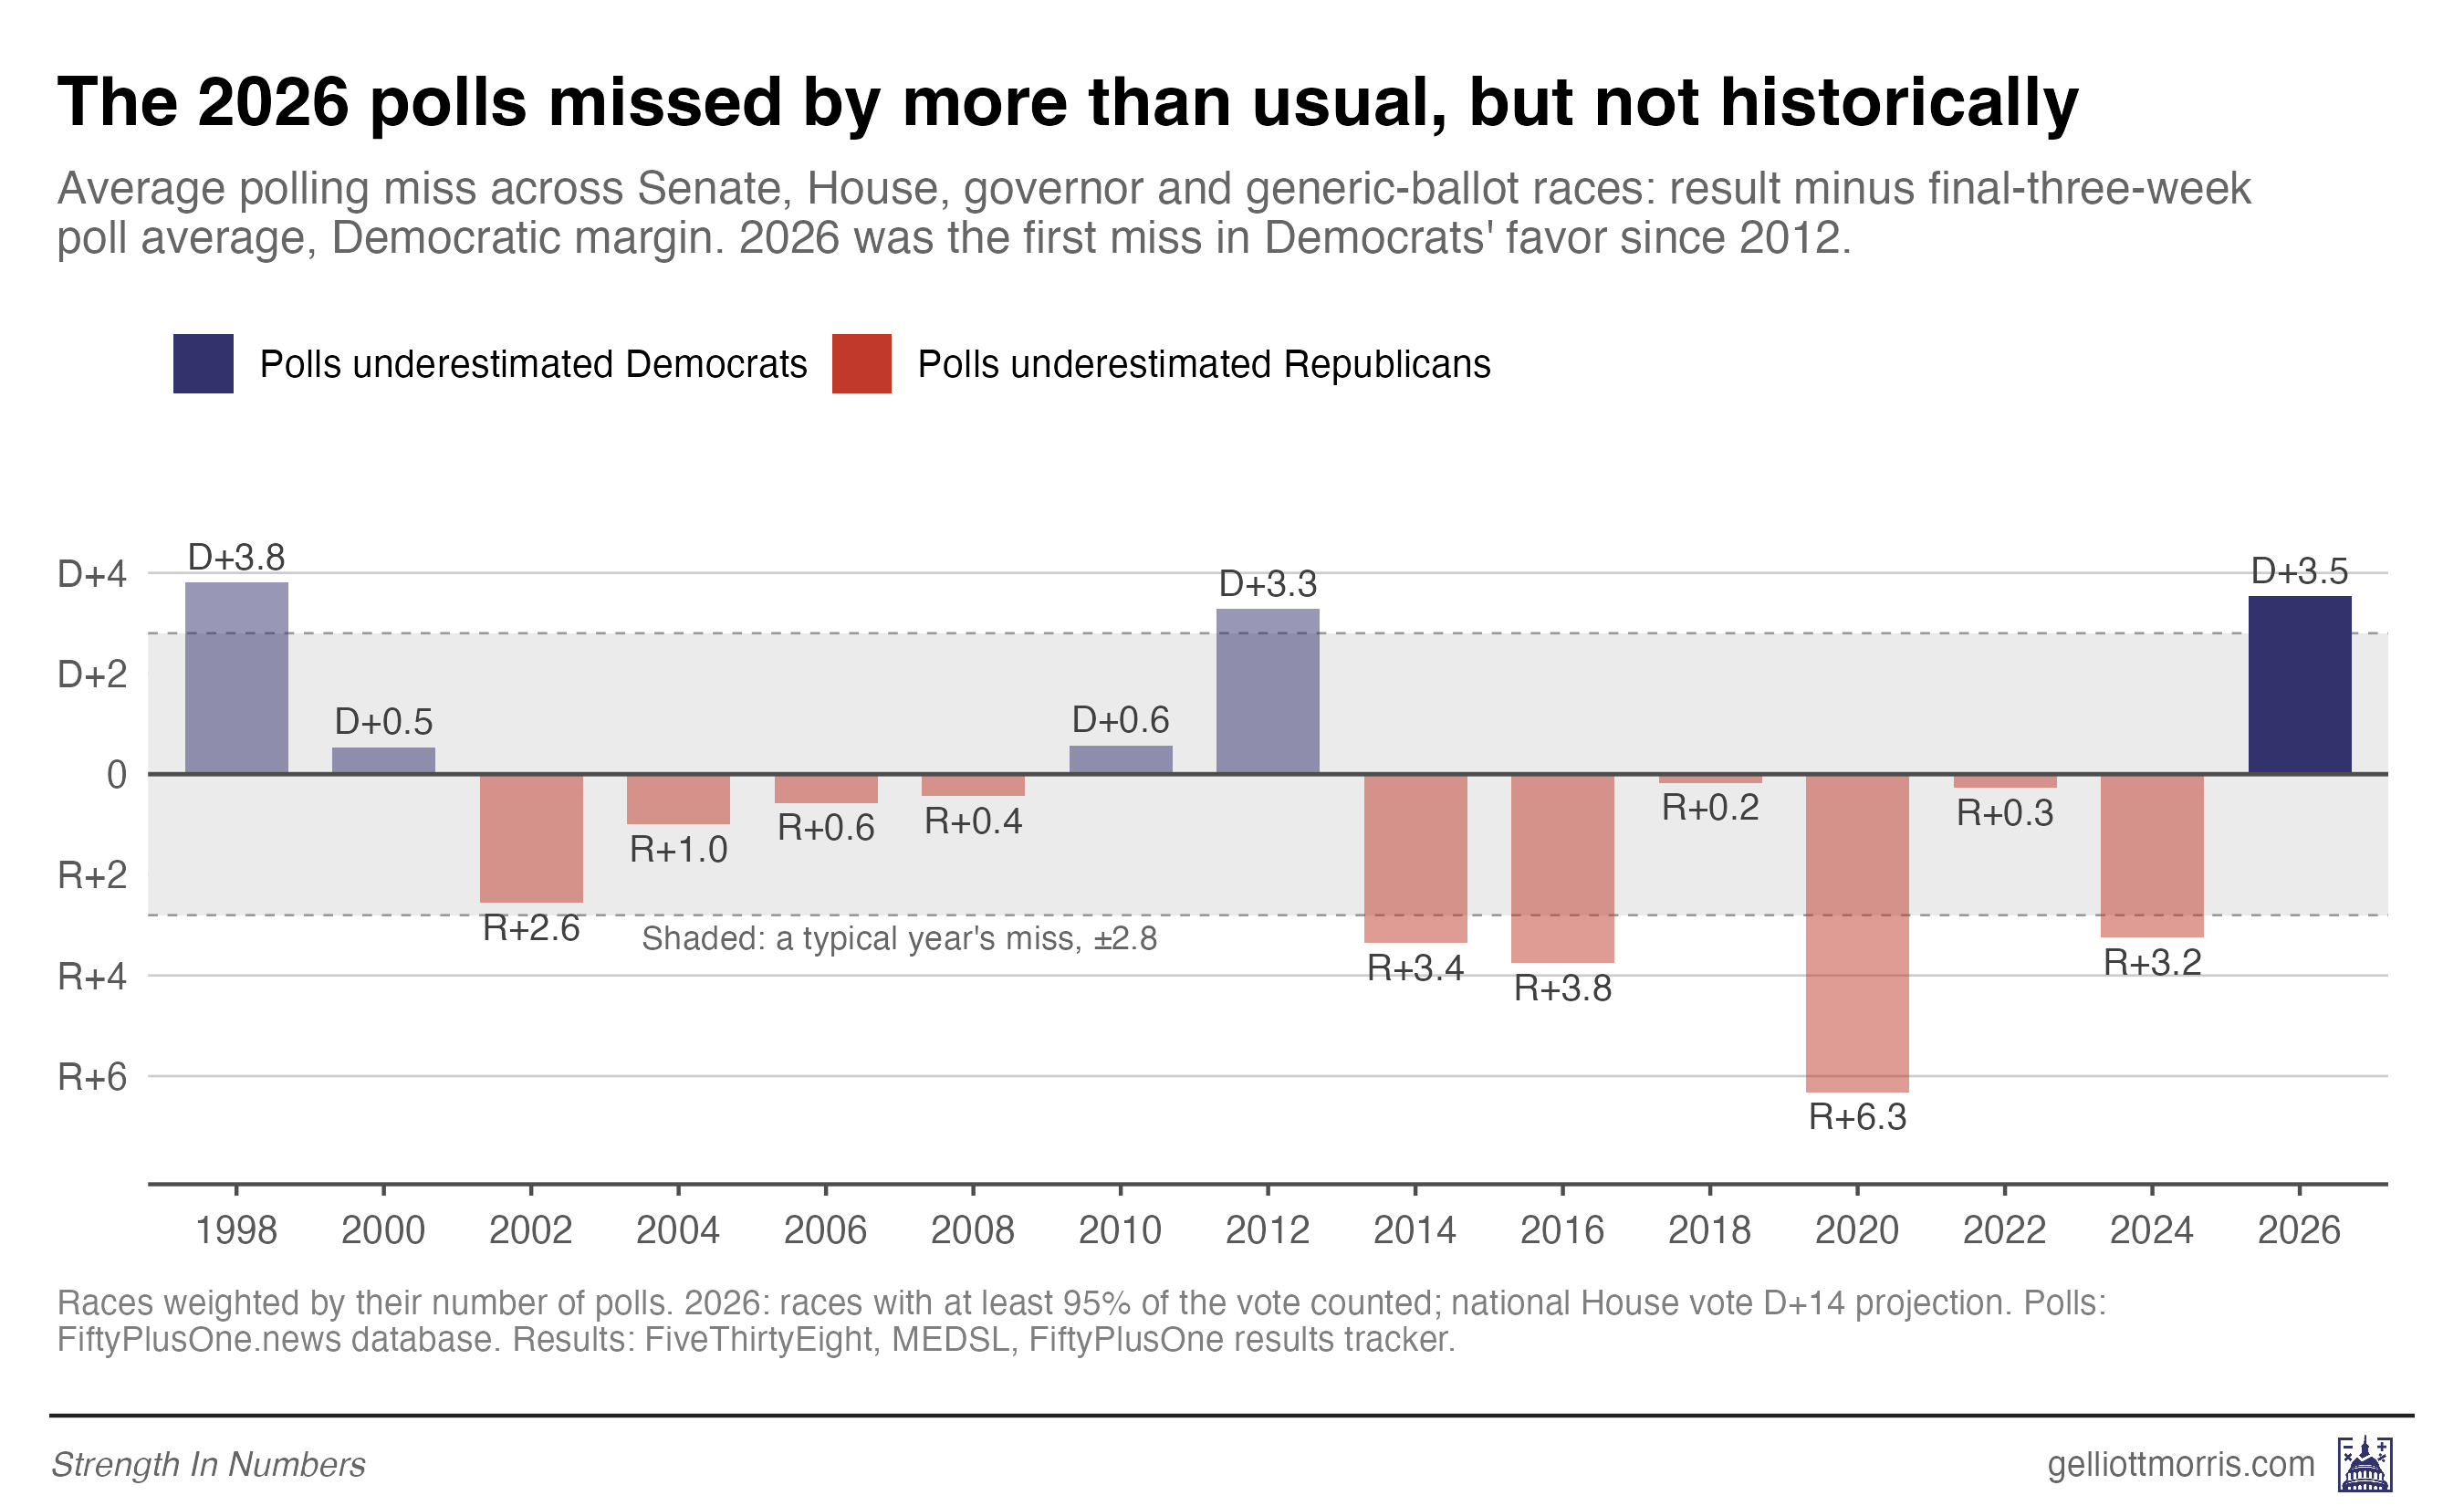
The miss was about the same size for every office: 3.3 points in Senate races, 3.3 in House races, and 3.2 in governor races. The generic ballot understated Democrats by about 5 points. But the average masks some real doozies, especially in the Senate. There, Democrats beat their polls in 18 of 22 races, and the biggest misses came in the contests everyone was watching. Polls underestimated Jon Ossoff in Georgia by almost 10 points, and they missed by about 9 in Texas and North Carolina.
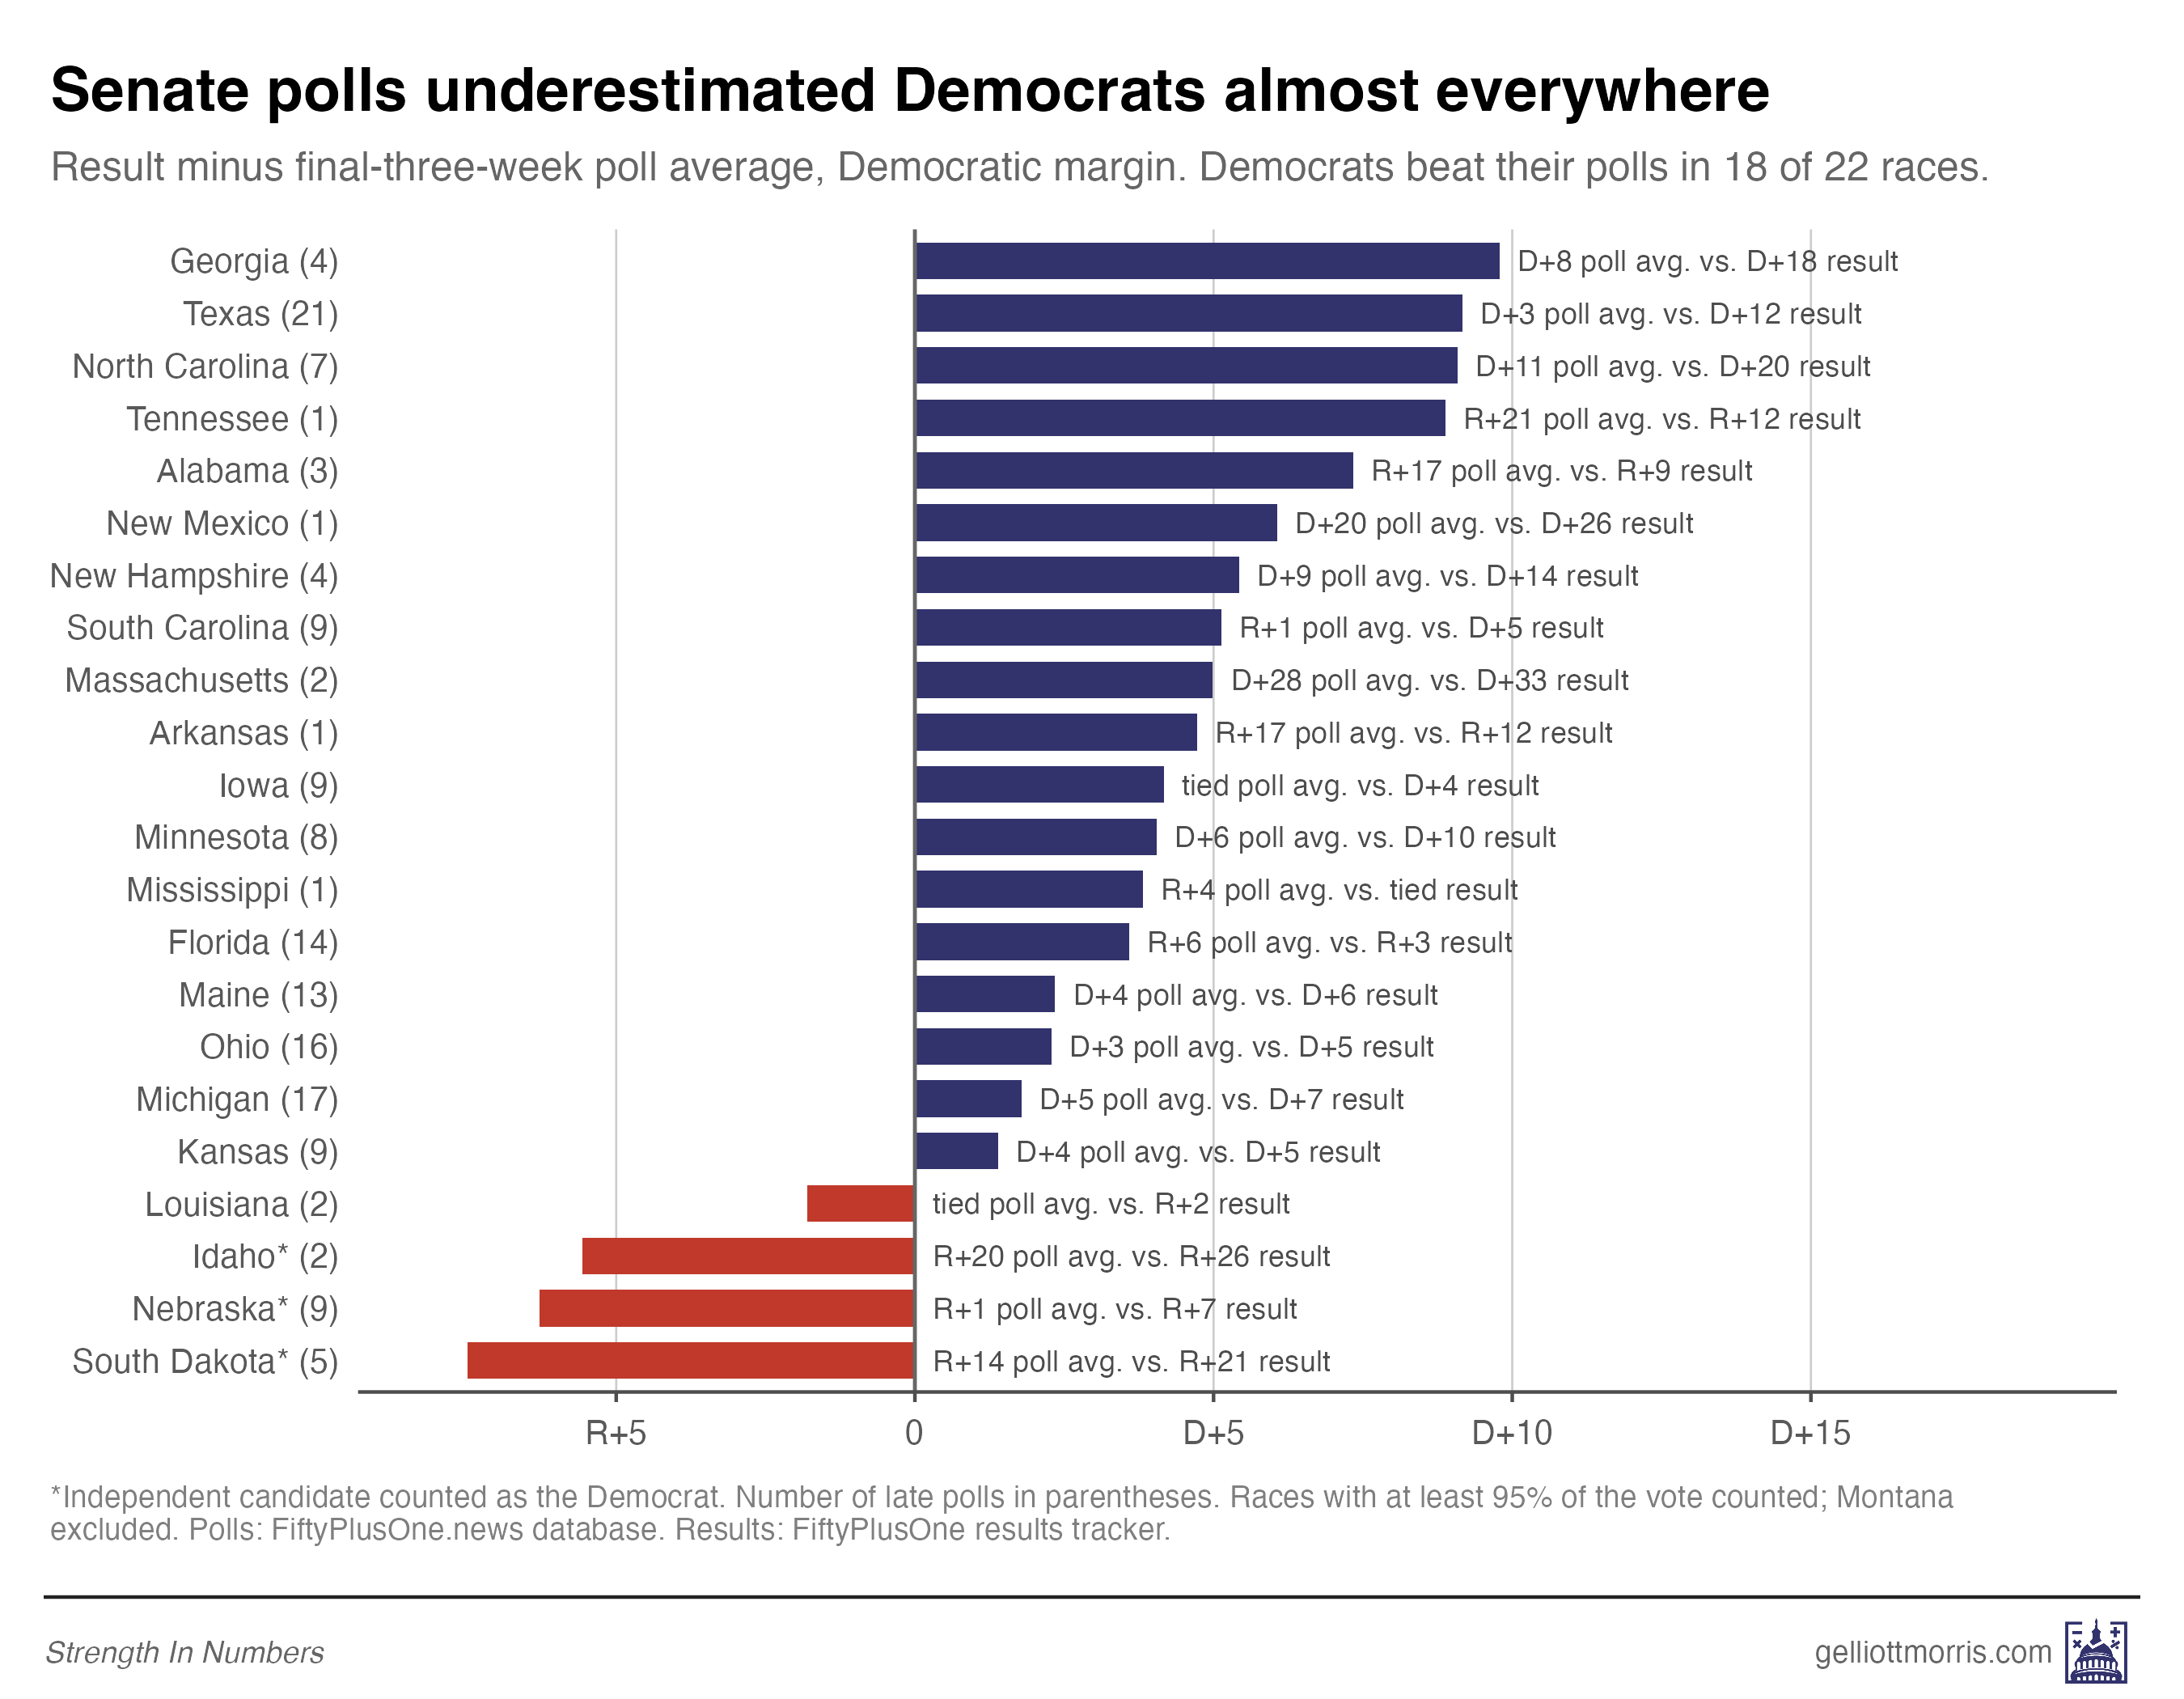
Now, I do not agree with people when they make a big deal out of polling “errors” of just a couple points. That could easily be due to noise, undecideds making up their mind, late campaign events, etc., and we need a lot of elections to distinguish random measurement error from bias. But a miss in nearly every state, by many different pollsters, often of over 5-10 points, means something systematic went wrong in the way pollsters gathered or processed their data. If we want polls to accurately represent the views of the public on policy and politics, we need to understand what caused those large deviations between measurement and result.
Pollsters reached the right people
Let’s start with what’s not driving the polling error — at least in high-quality data.
If non-response were the main problem in polls, it should show up in who our polls reached. Democratic-leaning people would be missing from the samples, and the samples would look too Republican even after weighting.
That’s not what we see. Our poll weights all adults so that their recalled 2024 vote matches the actual result, a 1.5-point Trump win in the two-party vote. But when you narrow it to the people who said they’d definitely vote this year, Harris beat Trump by 5.2 points. That’s almost exactly the makeup of the people who actually showed up: according to The Voter Poll, the 2026 electorate voted for Harris by about 5 points in 2024.
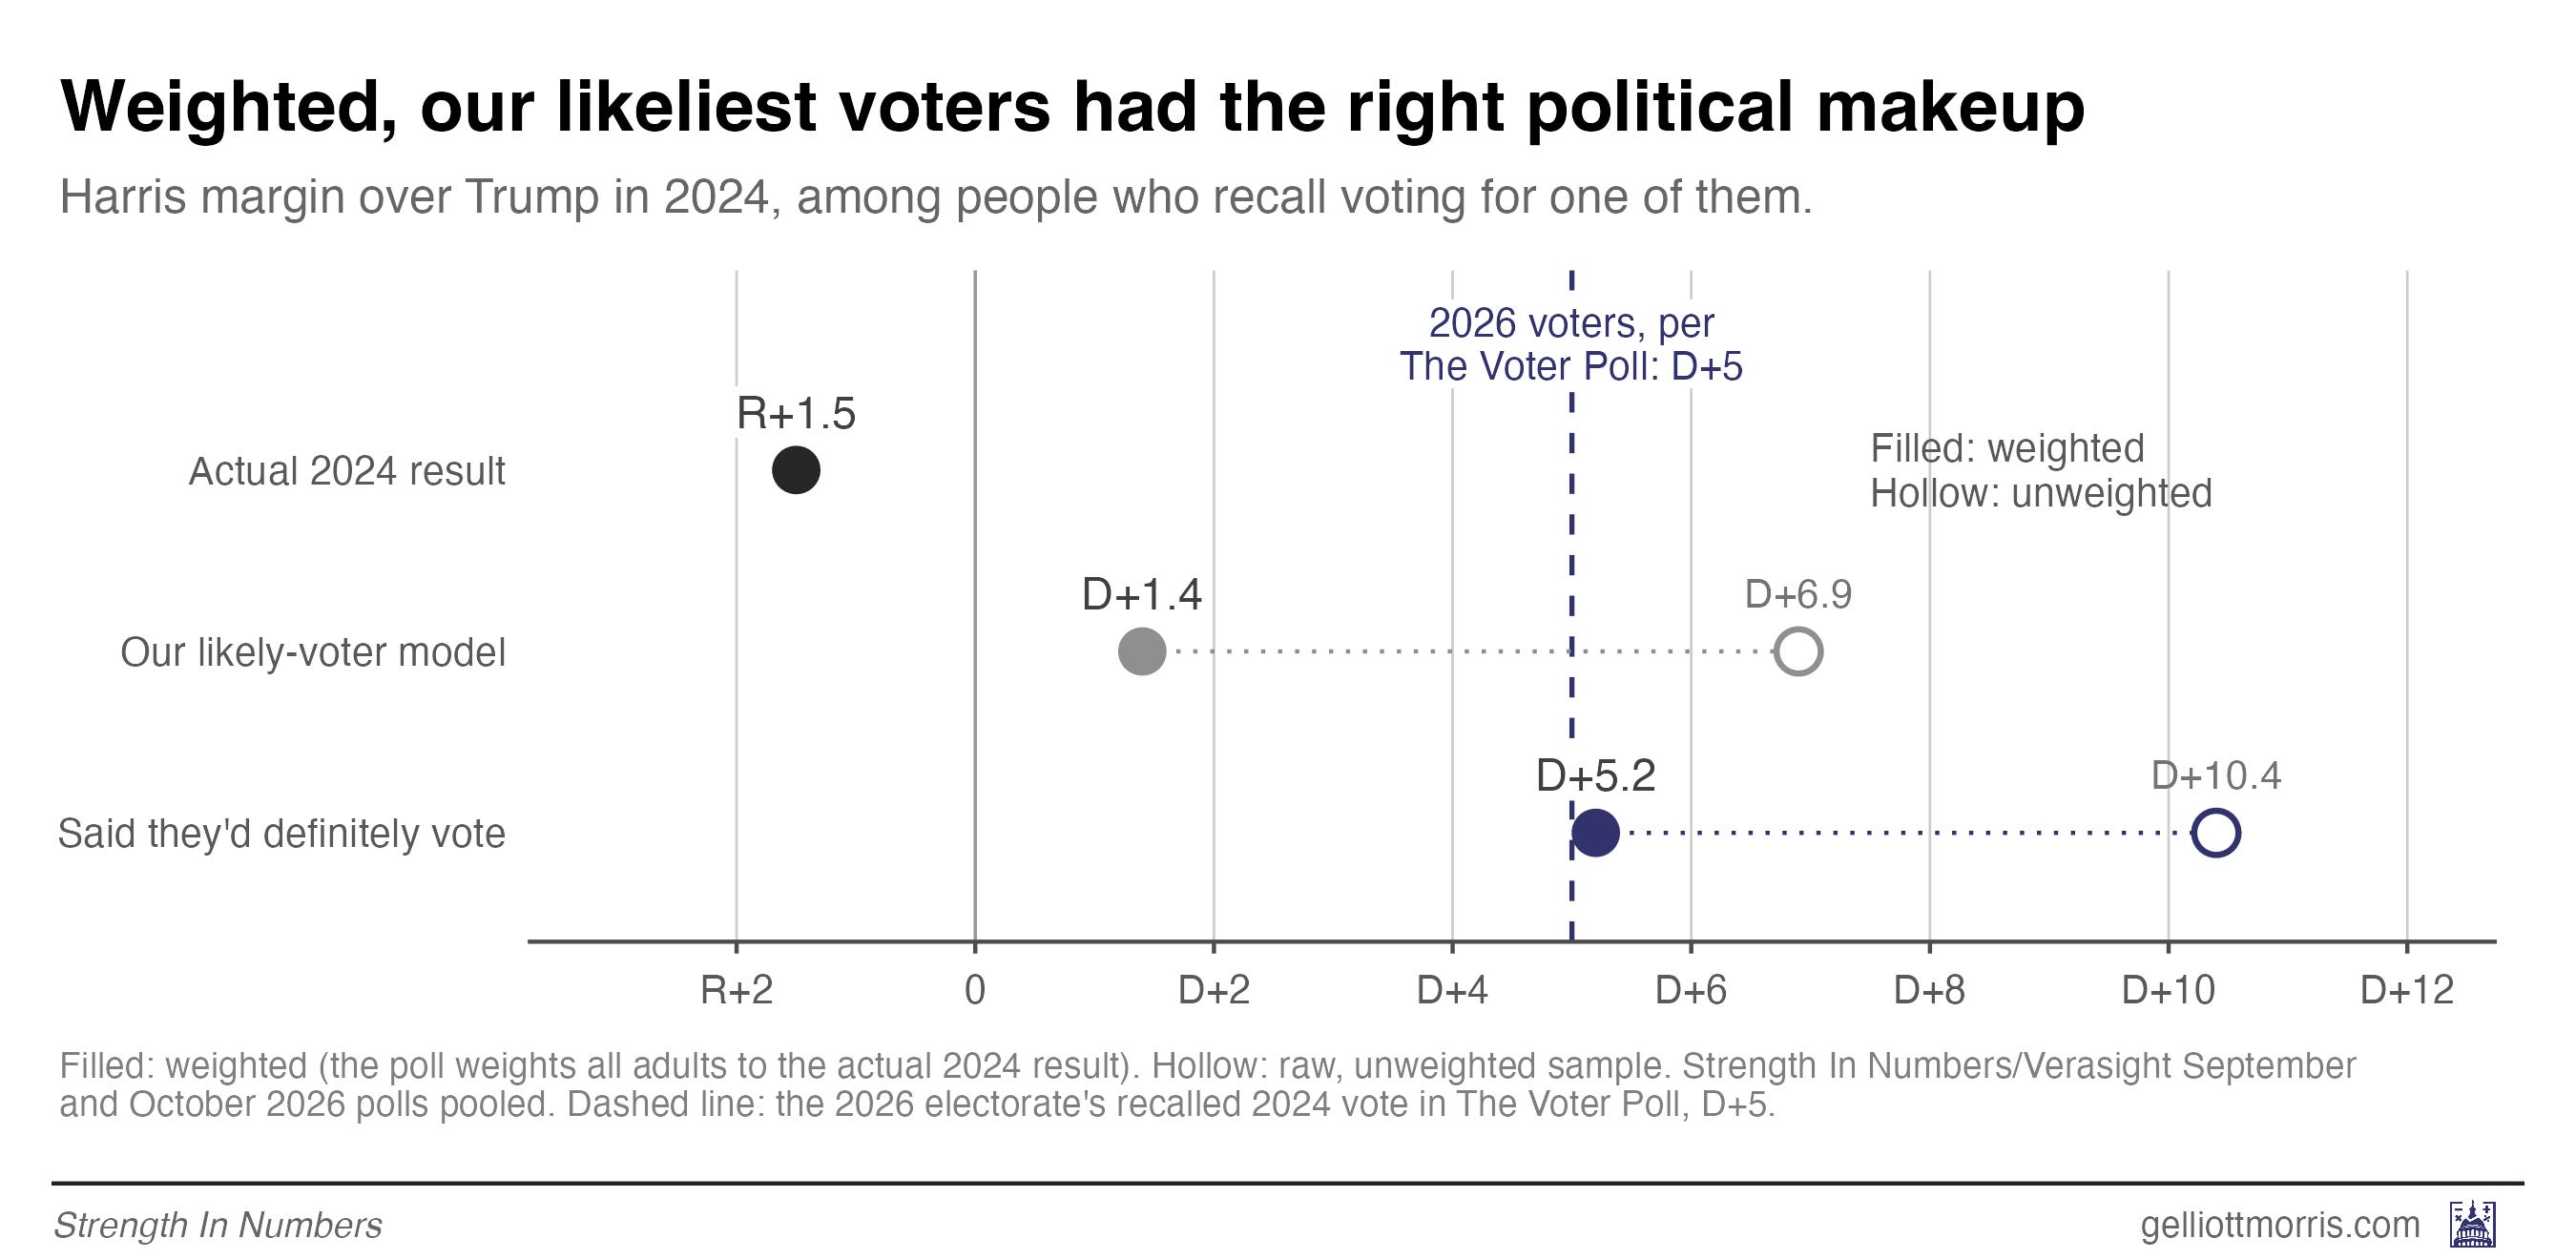
Moreover, the likeliest voters tilt Democratic about as much as actual voters did. In our September and October polls, respondents who said they’d definitely vote — who, this year, appear to better represent actual voters — favored Democrats by 15.2 points, against a projected result of 14.
This test can’t rule out every kind of non-response. If Trump voters who switched to Democrats were less likely to take surveys, for example, it wouldn’t catch it — this just looks at non-response by recalled vote.
But we can also see polls were picking up the right type of Trump and Harris voters, in terms of their likelihood to switch sides. In our final pre-election poll, fielded Oct. 13-19, 9% of 2024 Trump voters who said they’d definitely vote this year backed Democrats for the House, and 89% backed Republicans. In the Voter Poll, Trump voters split 7% to 91%. Harris voters matched almost exactly: 97% to 2% in our poll’s “definitely” group, and 97% to 2% in The Voter Poll. People who skipped 2024 lined up too, at 70% to 22% in our poll vs 71% to 25% among actual voters.
Among all registered voters, the picture is the same with more people undecided: 9% of Trump voters and 95% of Harris voters were with Democrats. If anything, our poll found slightly more Trump-to-Democrat switching than actually happened, though the 2-point gap is within the margin of error. That’s the opposite of what you’d see if Democrats had been ducking our surveys.
On this note, YouGov’s chief scientist Doug Rivers told The Washington Post’s Scott Clement that his data looked “about right on net switching” but “overestimated Republican turnout and underestimated minority and younger voter turnout.”
So then, what went wrong?
The way pollsters identified likely voters moved samples to the right
In brief, it appears pollsters reached the right set of voters initially, but when they adjusted their data in an attempt to identify likely voters, they moved the samples toward Republicans. They got turnout wrong.
To measure the turnout problem polls suffered from, I’m going to use a statistic called a turnout ratio. I calculate this by taking the percentage of Democrats who voted in the election and dividing it by the percentage of Republicans who voted. If our poll shows 90% of 2024 voters who called themselves Democrats said they’d vote in November but only 80% of Republicans did, that’d be a turnout ratio of 90 / 80 = 1.13.
Some more illustrative math: If 2024 Harris voters and 2024 Trump voters had turned out at the same rate this year, the 2026 electorate would have voted for Trump by 1.5 points in 2024, just like the country did. For it to have voted for Harris by 5 points instead, as The Voter Poll indicates, Harris voters would have had to turn out at about 1.14 times the rate of Trump voters.
Our final October likely-voter sample — which worked by weighting voters based on their self-reported likelihood to vote (methodology explained here) — expected a much lower turnout ratio than 1.13. Our poll had 86% of Harris voters turning out vs 81% of Trump voters, a ratio of 1.06. But if we filtered the poll to just people who said they’d definitely vote, we got turnout percentages of 85% of 2024 Harris voters compared with 74% of Trump voters. That works out to a ratio of 1.14, right where it needed to be.
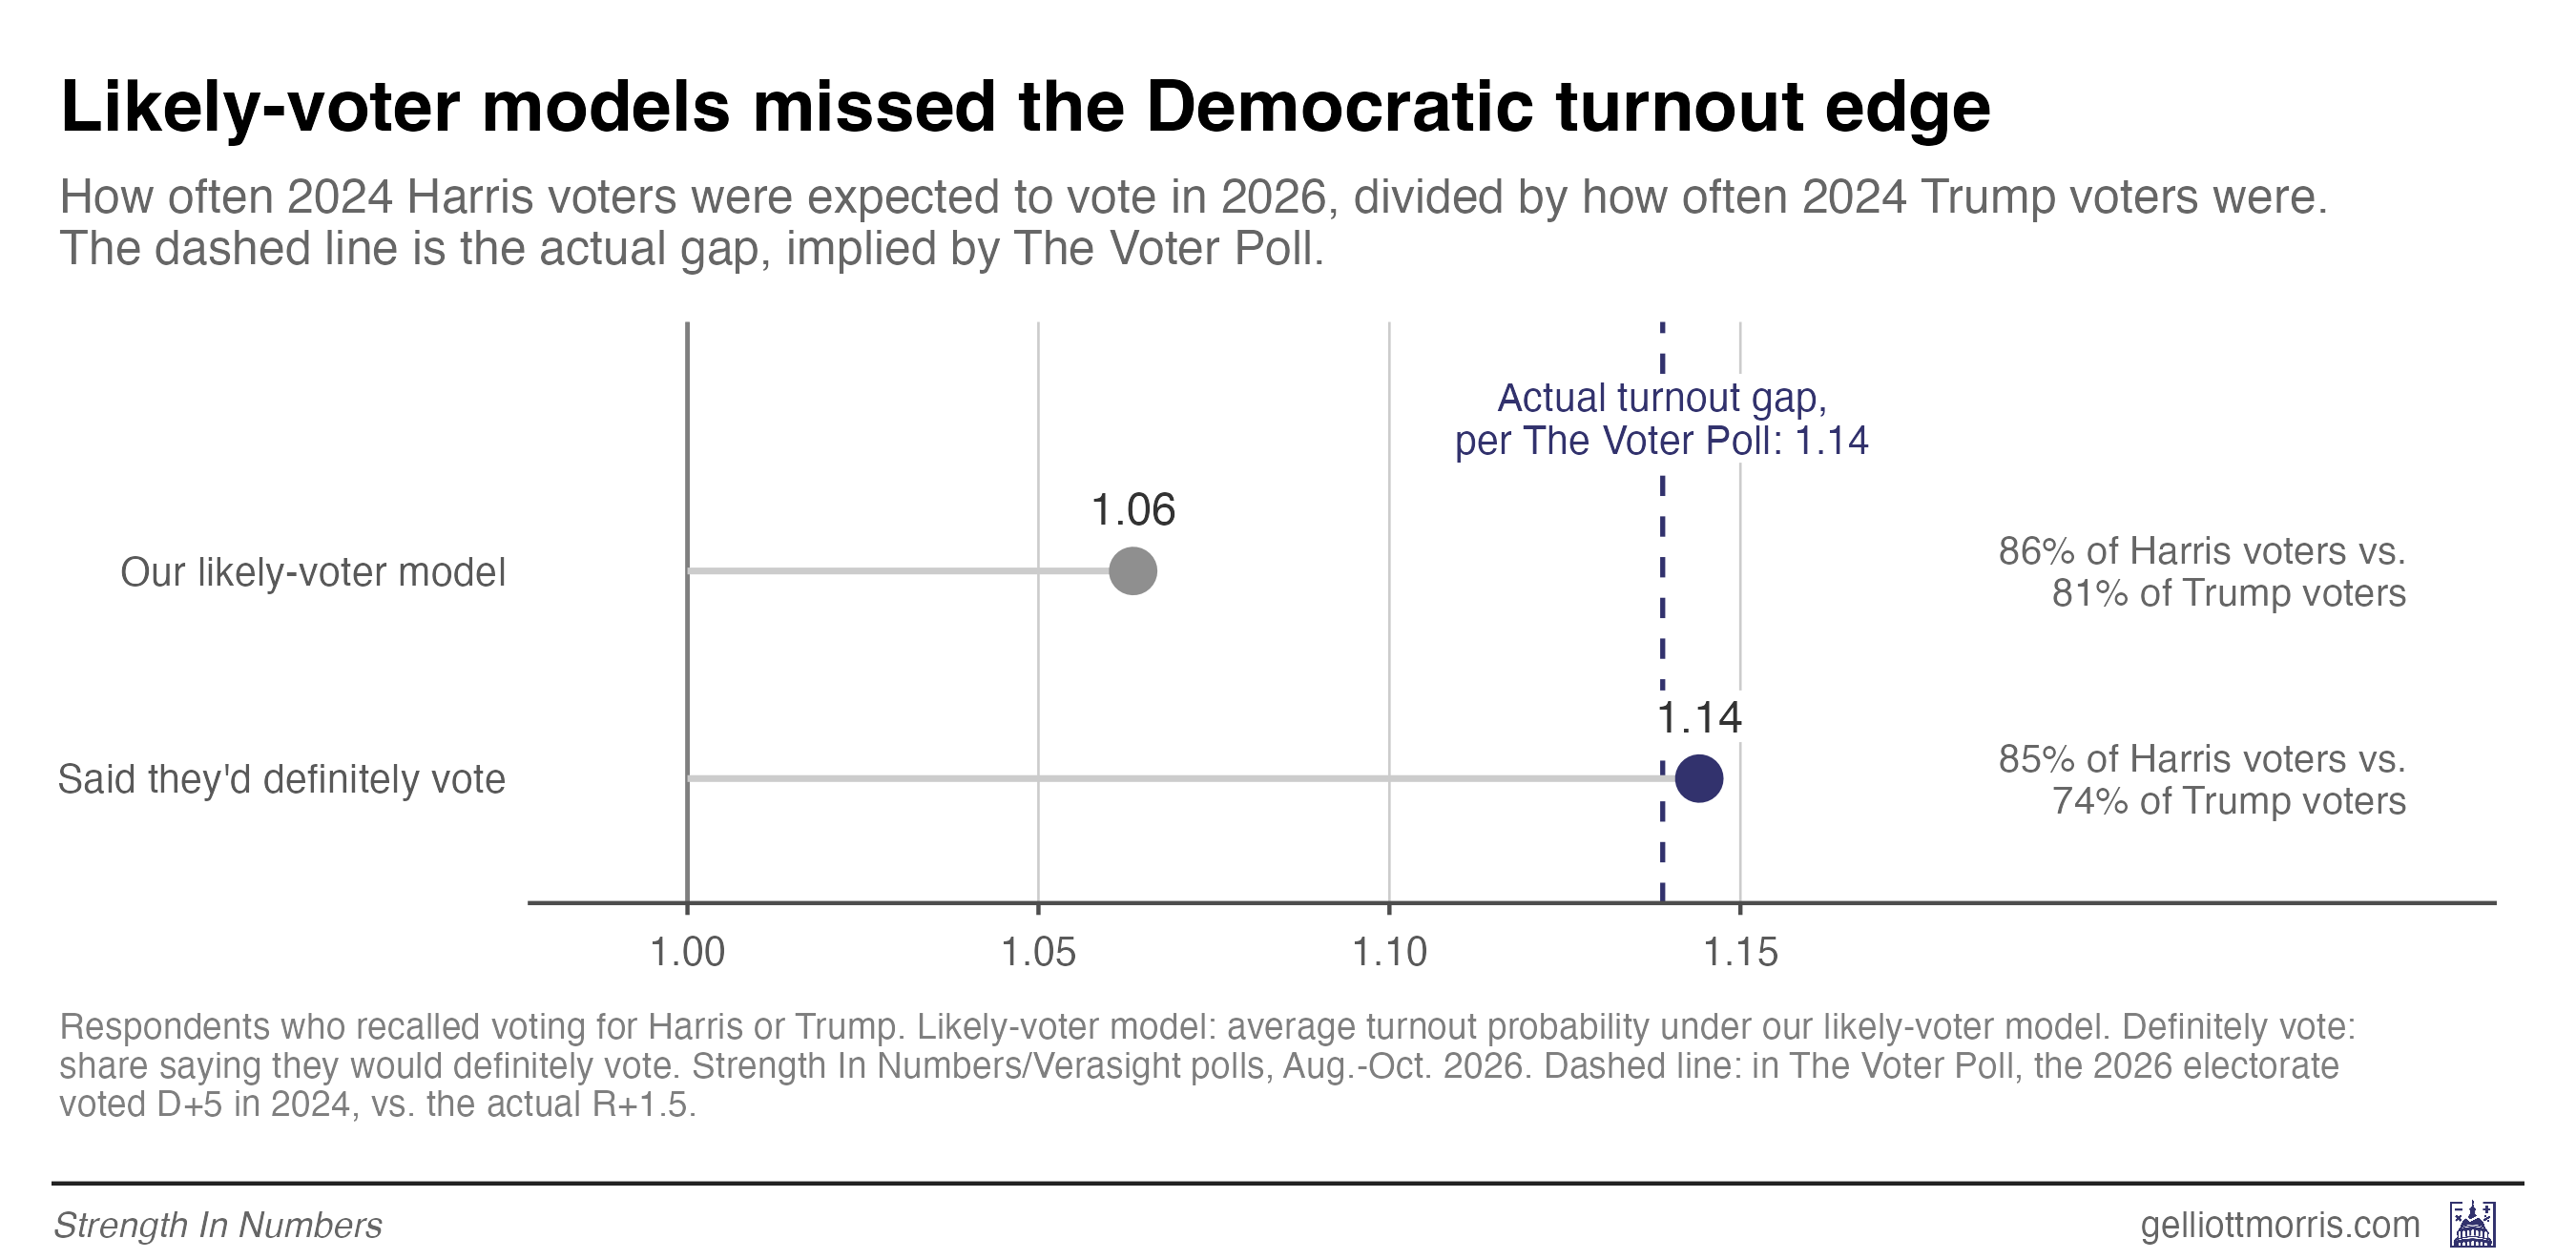
Another way of thinking about this is that turnout alone moved the electorate about 6.5 points, from a 1.5-point Trump lean to a roughly 5-point Harris lean. Our model had turnout moving the electorate just 3 points, which left about 3.5 points of Democratic margin on the table.
An added wrinkle is that new voters leaned heavily Democratic. People who skipped the 2024 election but said they’d definitely vote this year favored Democrats by about 50 points in our polls, or roughly 75-25. As I wrote the day before the election, people who had skipped the last two general elections cast more than 8% of North Carolina’s early ballots.
Infrequent voters — a separate group from new voters — swung hard toward Democrats, too. Joy Wilke, Vice President of Polling at the Democratic firm BlueLabs (and guest of the Strength In Numbers podcast!), told the Post that “in ‘24 [infrequent voters] broke for Trump by 7-8 points, but in ‘26, they broke for the Democrats by 16 pts.”
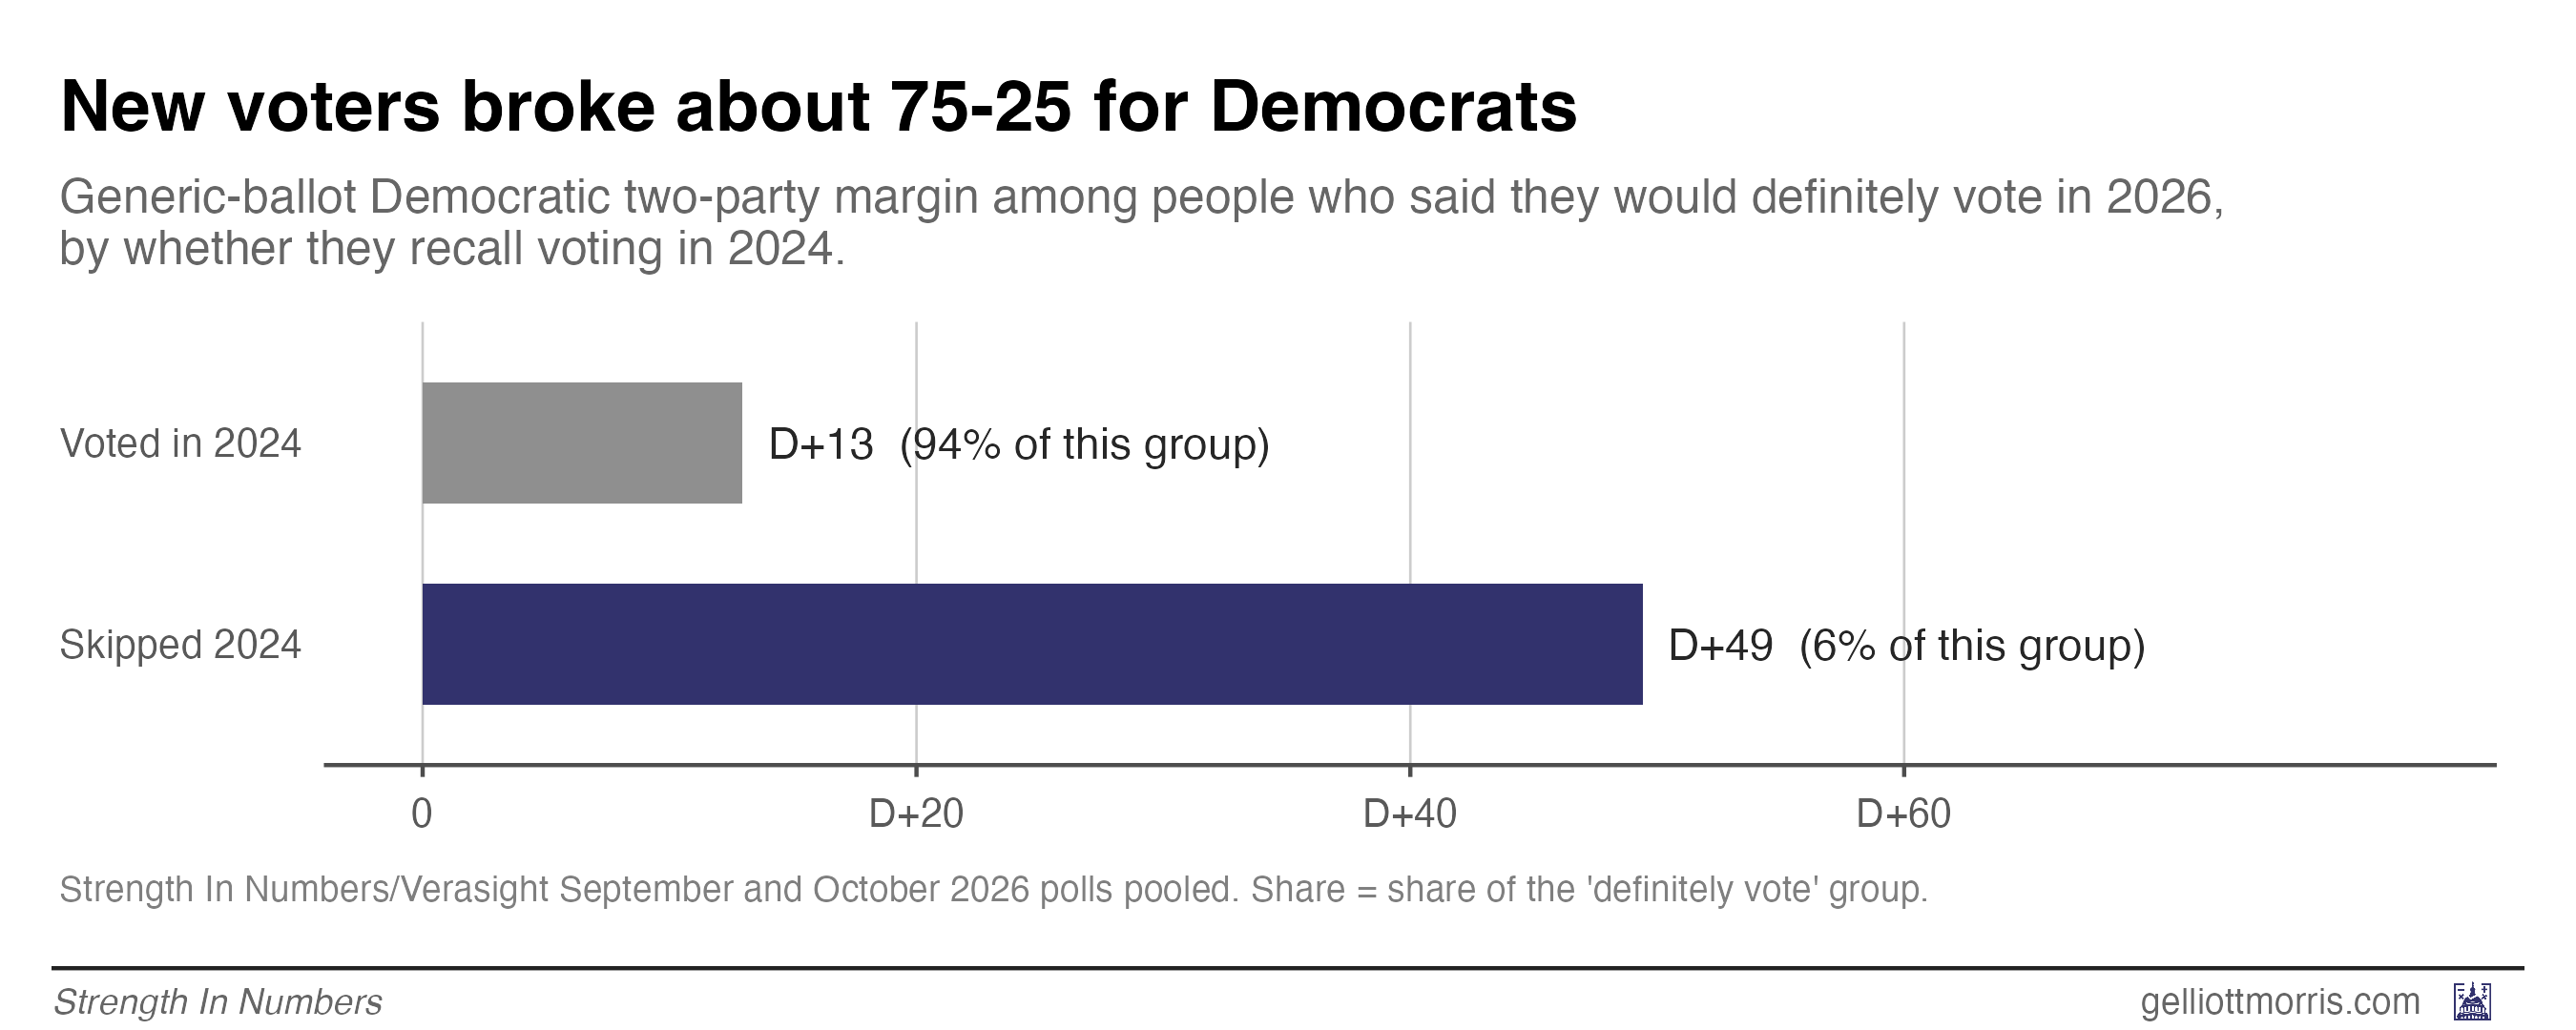
Any likely-voter model that discounted people without a recent voting record threw out the most Democratic slice of this year’s electorate.
Using vote history in turnout models hurt Democrats
Now, while thinking about how all polls did, not just the SIN poll, the culprit for higher error among other pollsters appears to be the use of vote history in calibrating turnout expectations.
Pollsters build likely-voter models in roughly two ways. Some ask respondents how likely they are to vote and take them more or less at their word (the SIN approach). Other firms use information about how individual voters performed in the past — whether someone voted in previous elections (often from the voter file), how interested they are in the campaign, their demographics — to “correct” for the fact that people overstate how likely they are to vote.
Usually, this works out. But this year, the corrections made things worse.
In the final three weeks of the campaign, public polls reported both registered- and likely-voter results for a race 32 times, and in 25 of them the likely-voter number was more Republican. In those 25, the likely-voter number missed the result by 4.4 points on average, while the registered-voter number missed by 2.6.
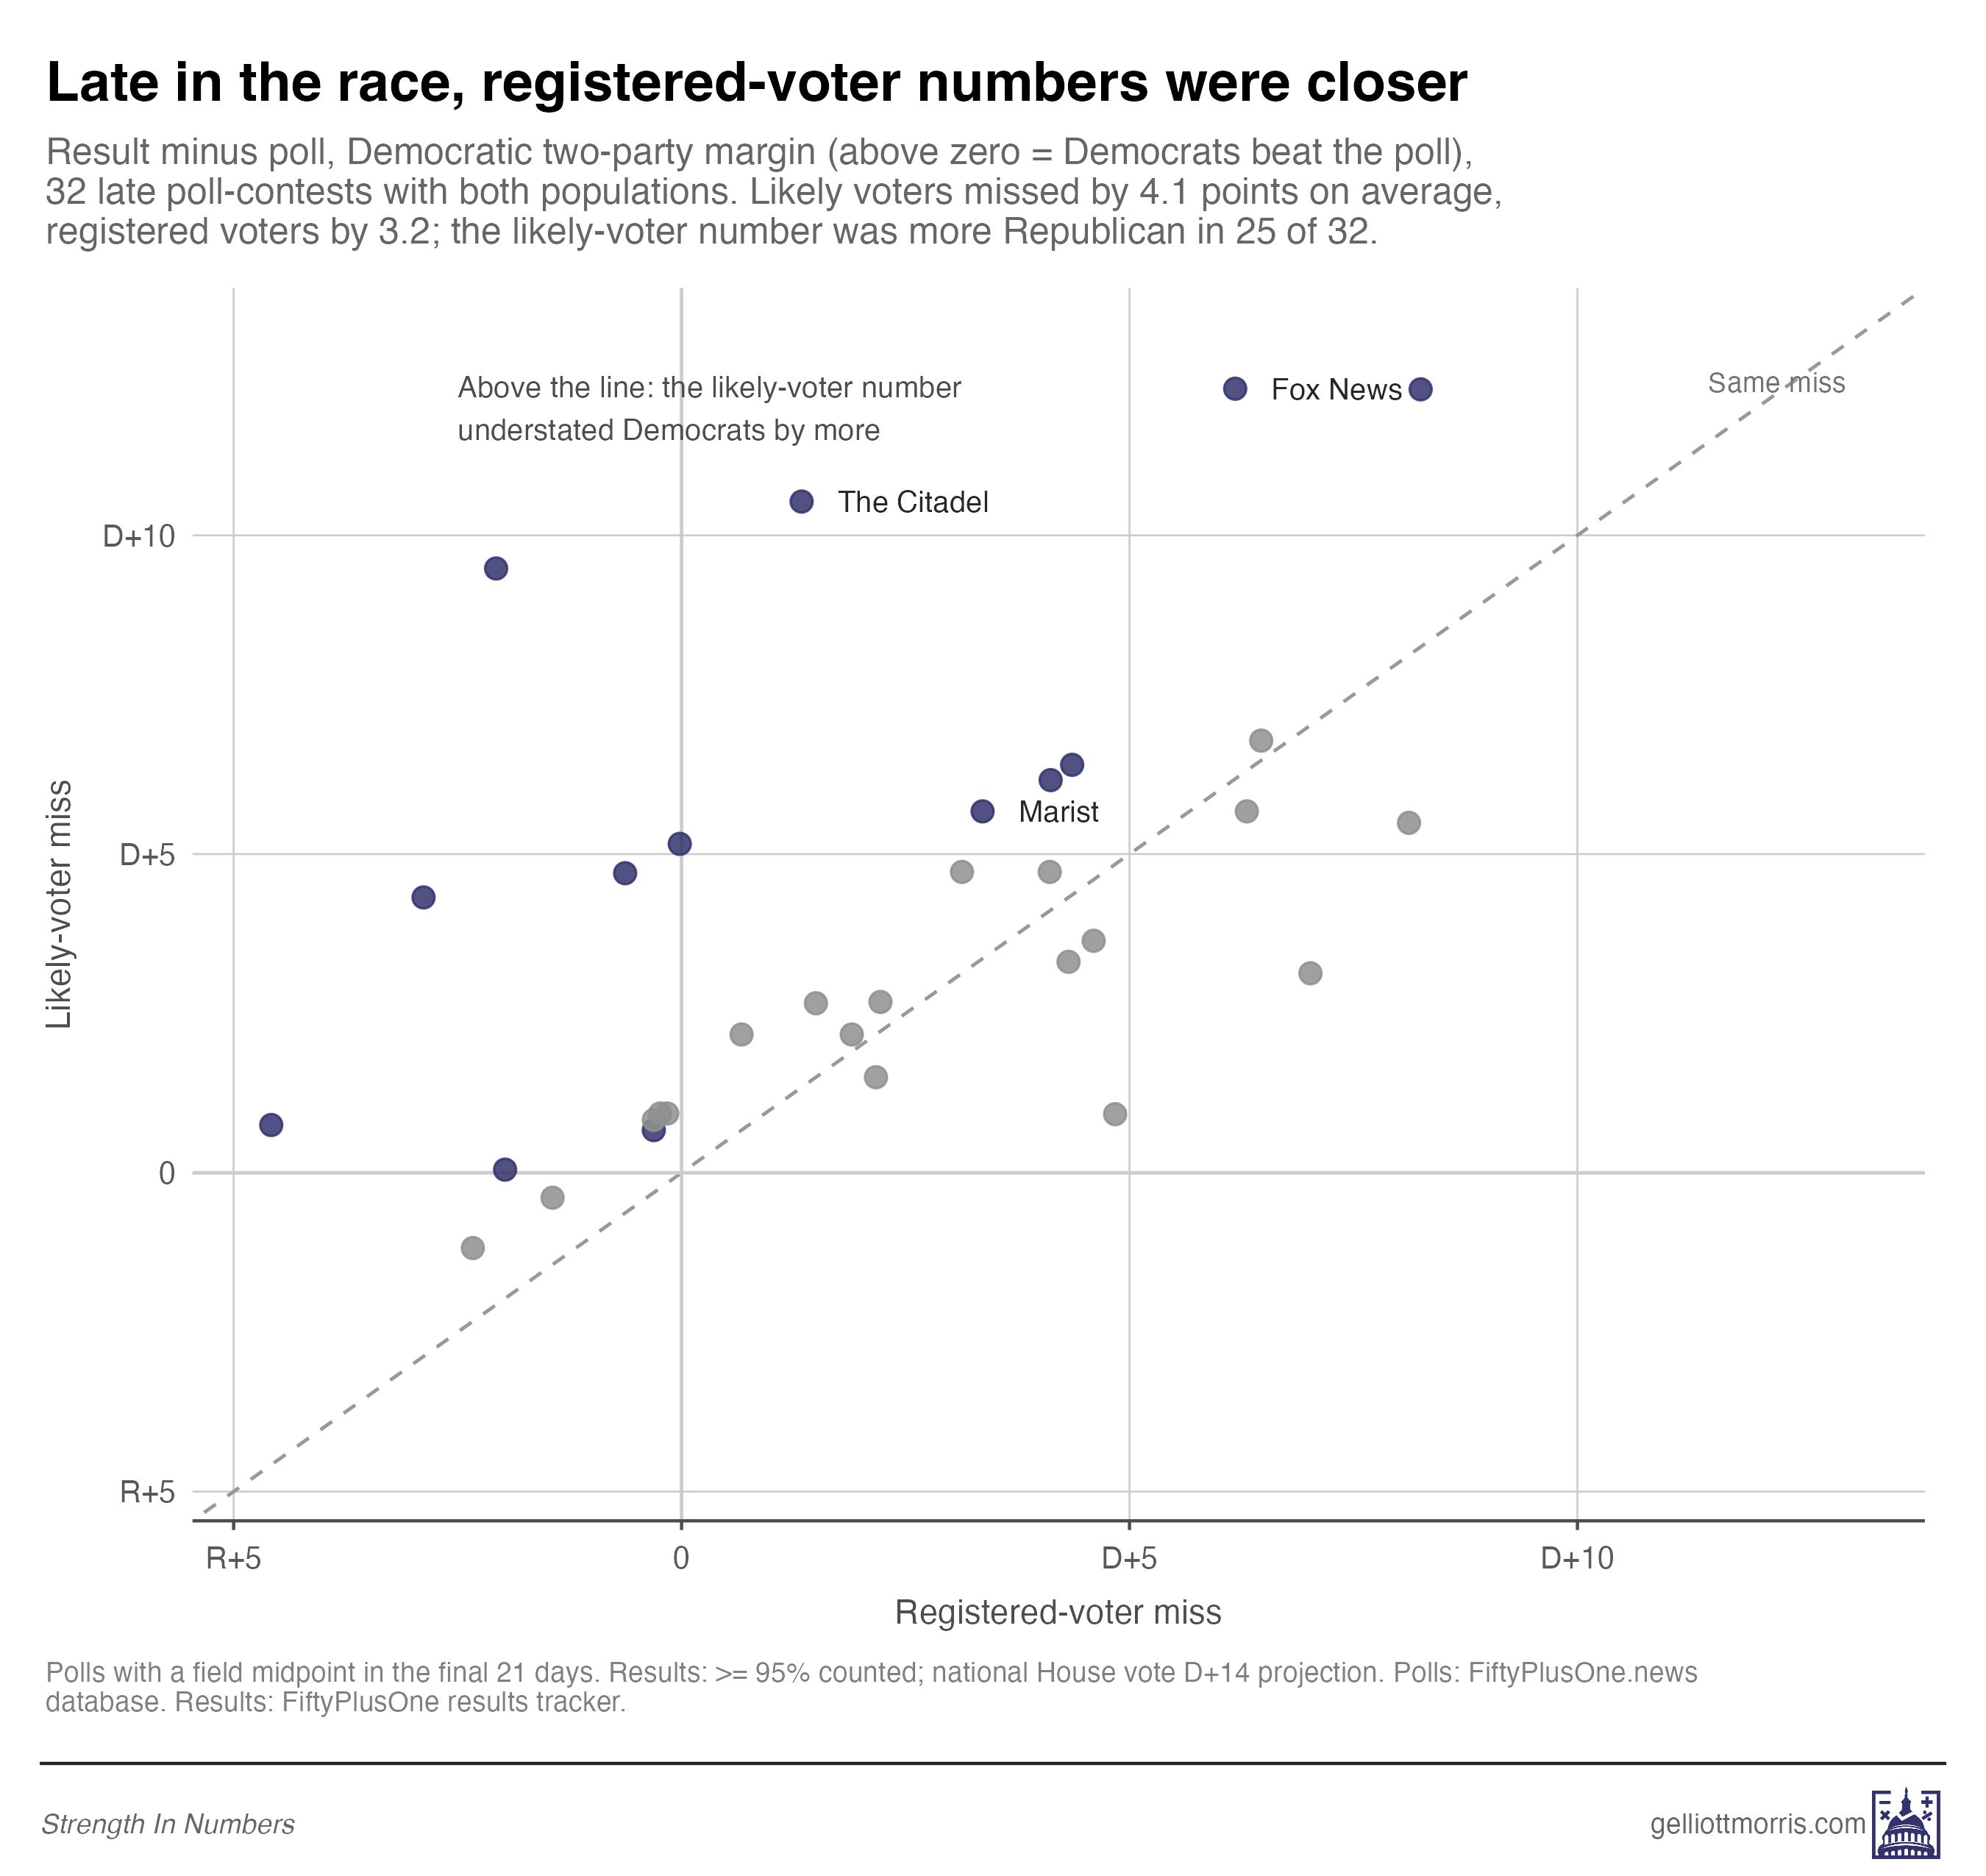
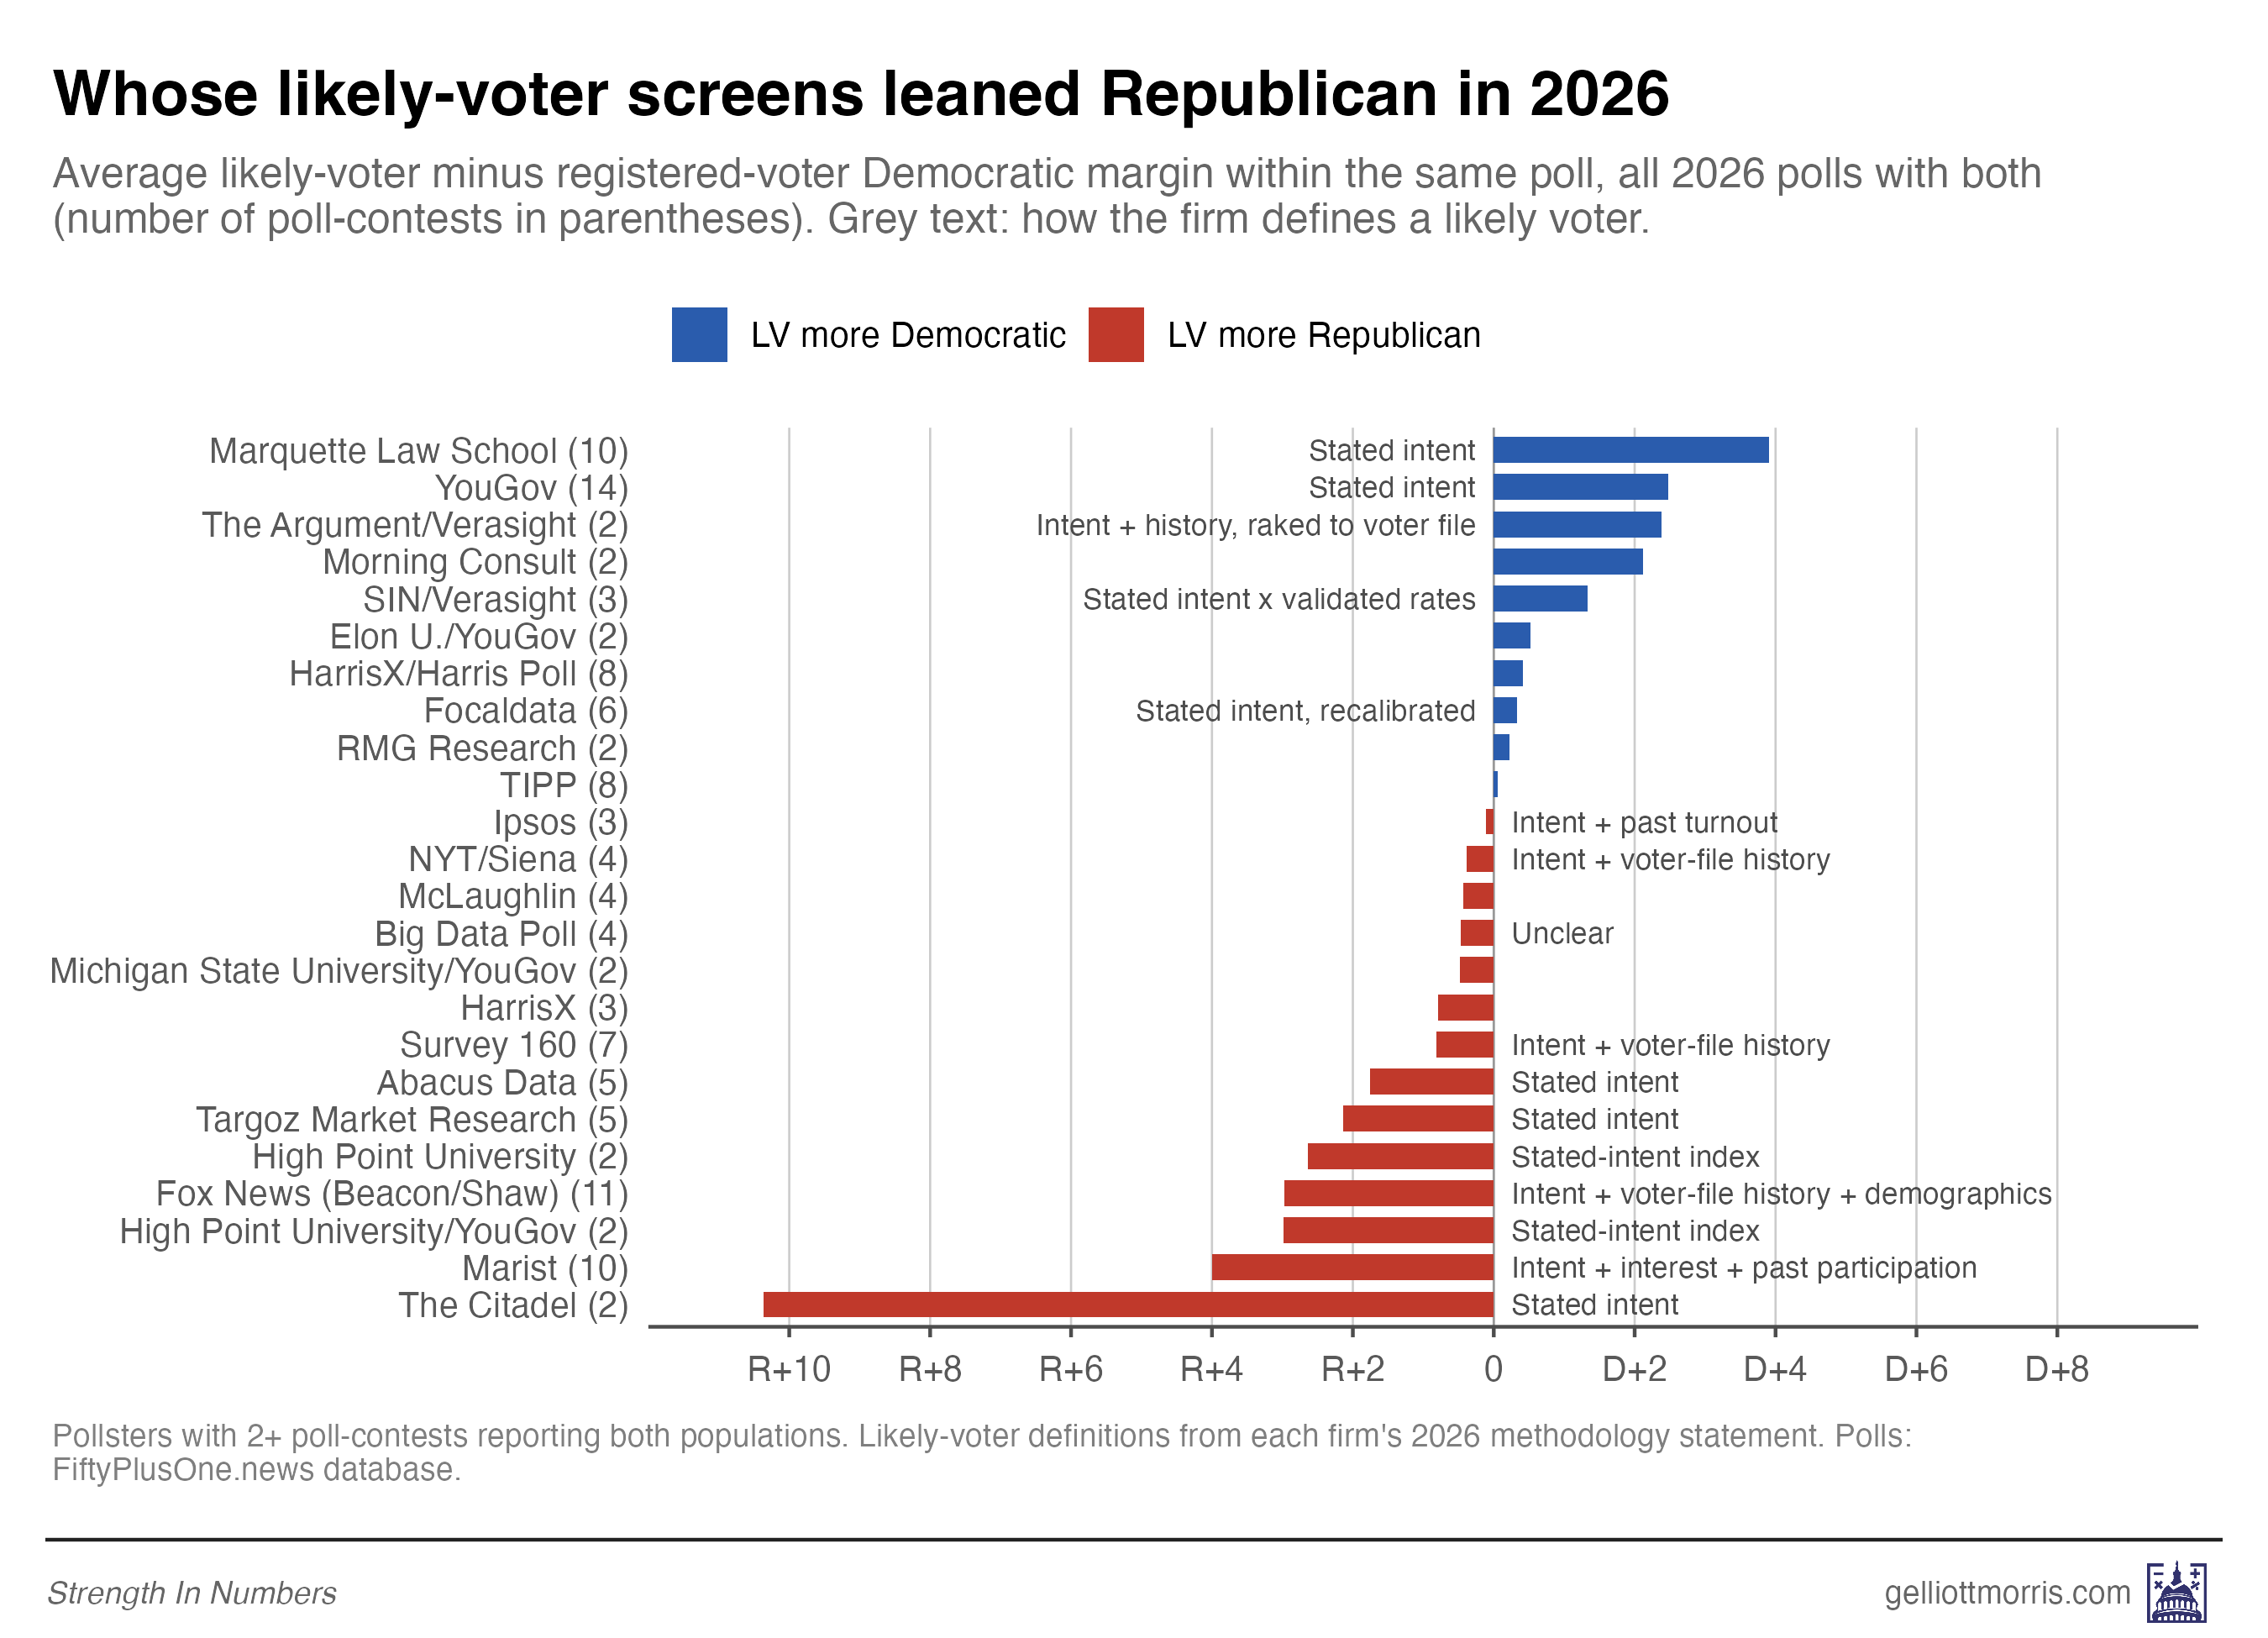
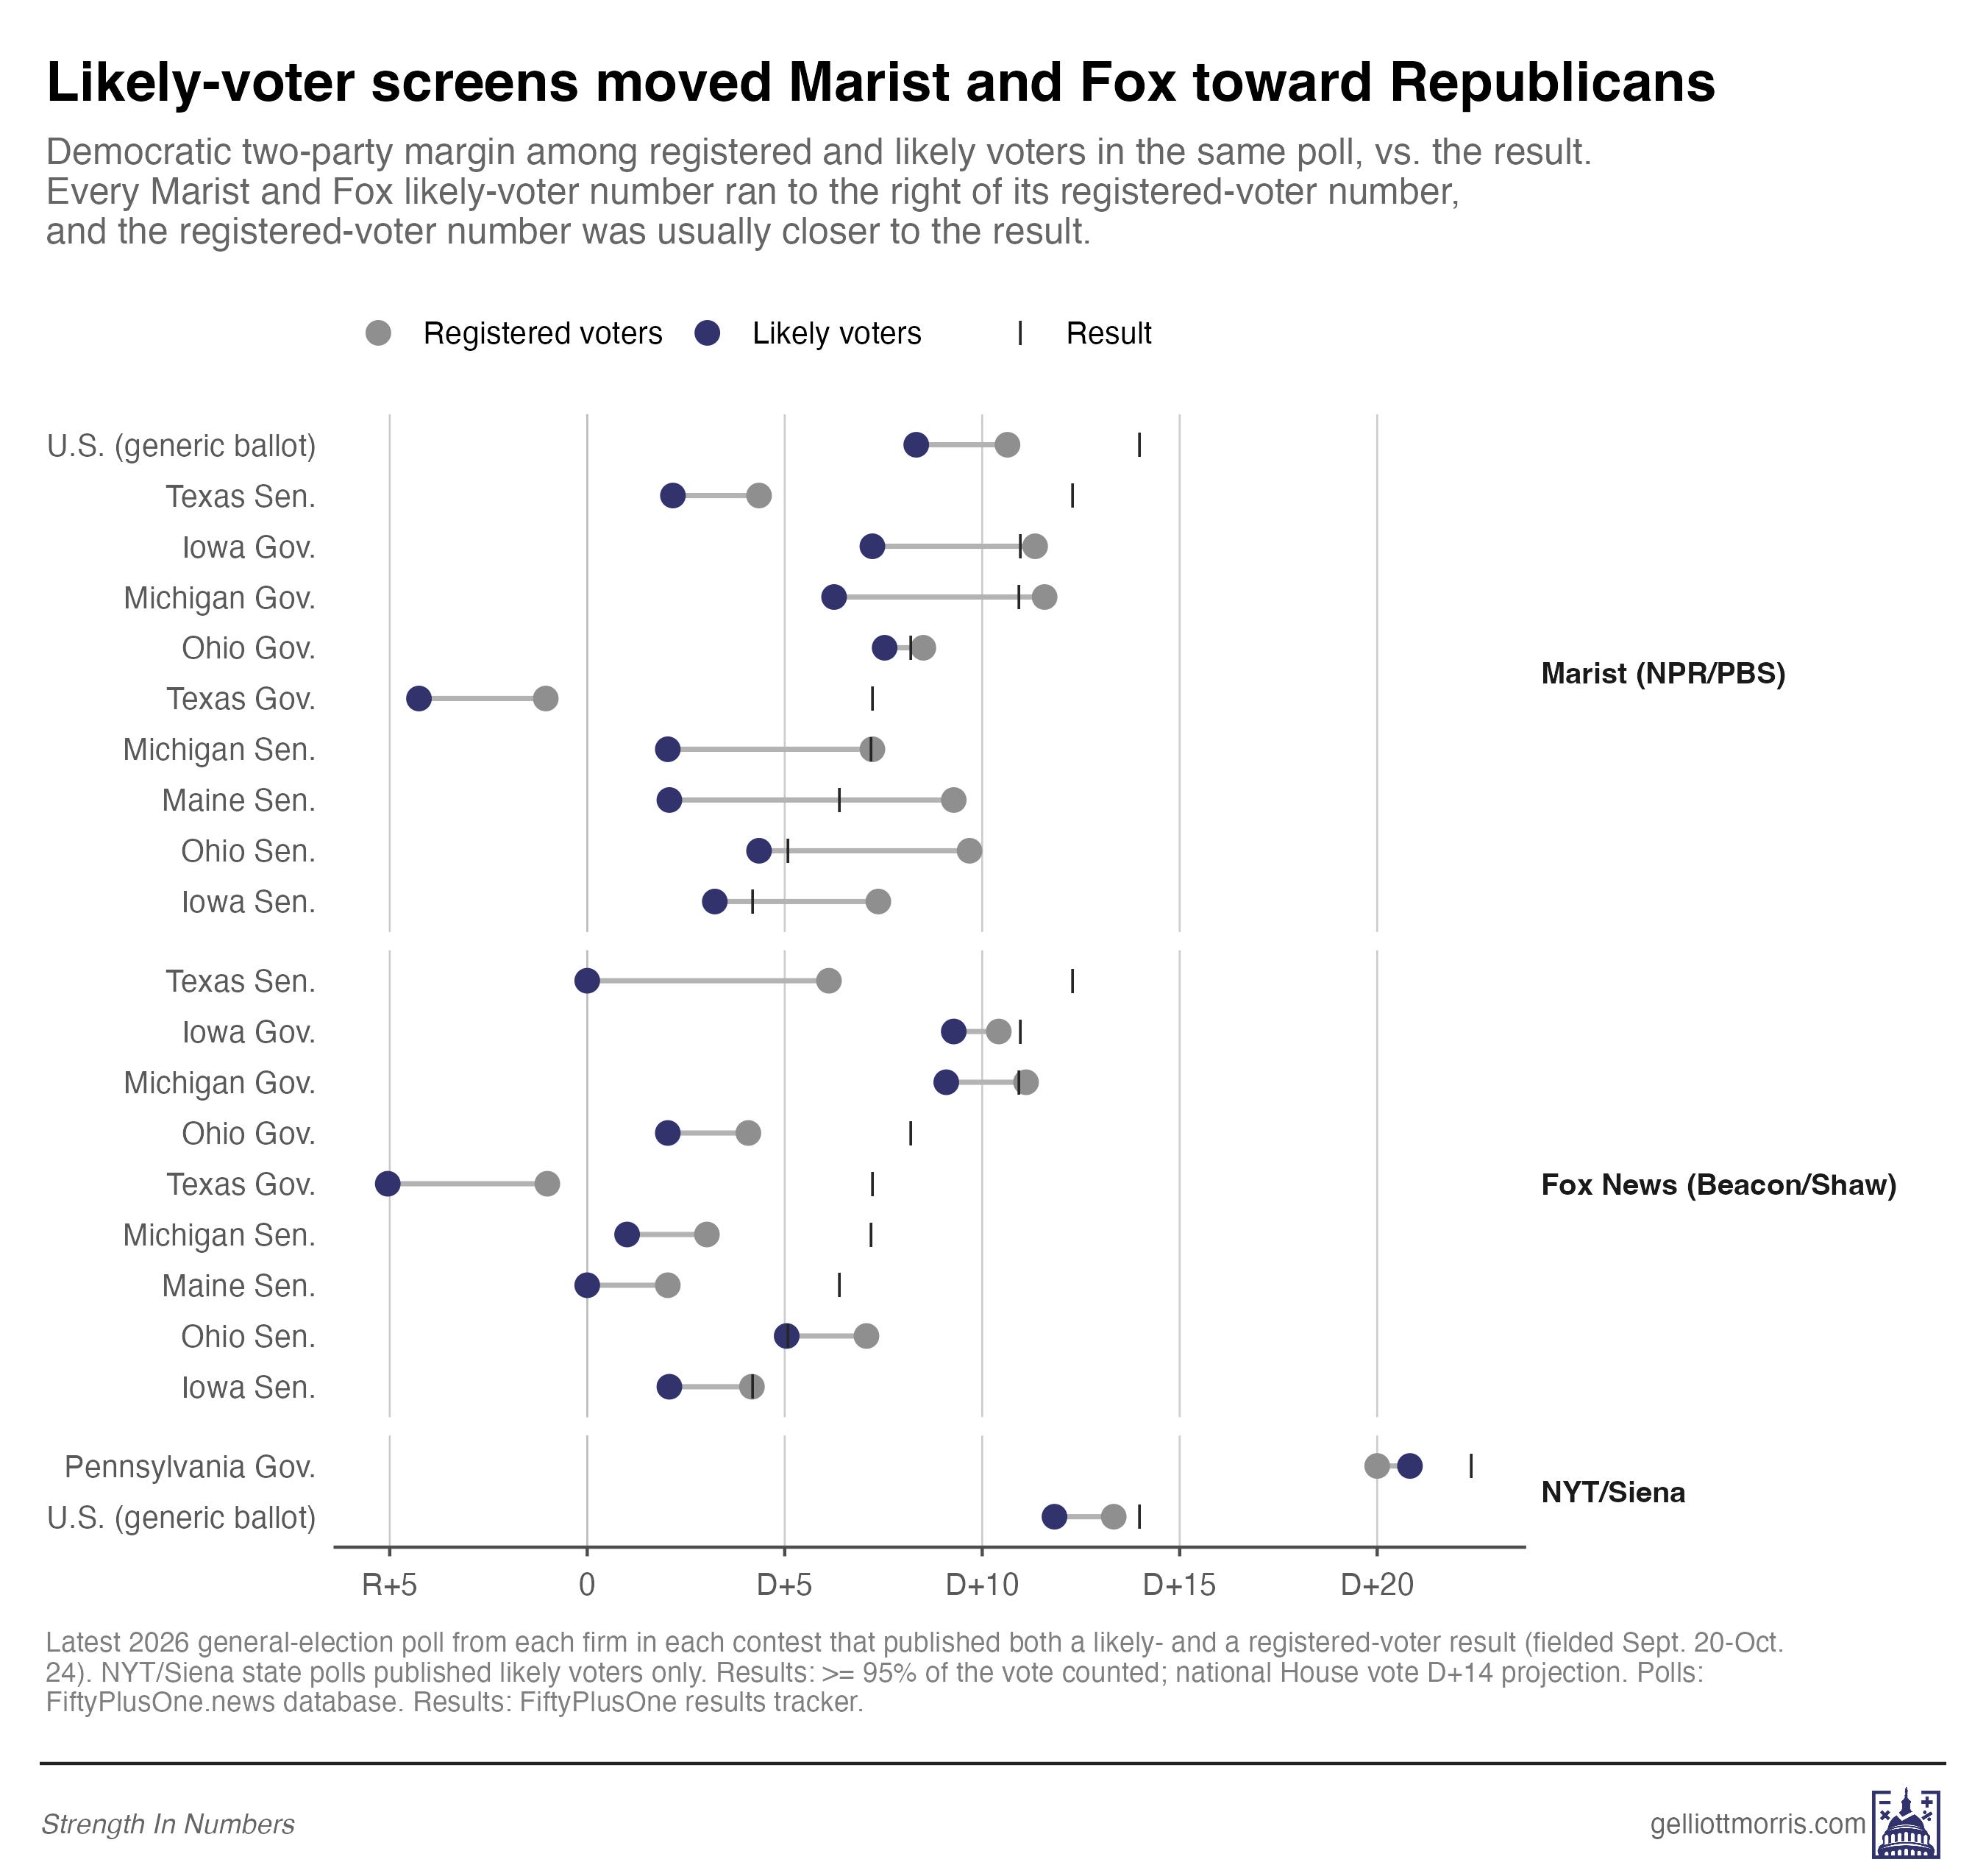
Screens that layered vote history, interest or demographics on top of stated intent almost always moved toward Republicans. Among those, Marist’s and Fox News’s moved the most, by about 3 to 4 points on average. Marist’s Barbara Carvalho explained to the Post that differences between polls were “likely based on the degree to which methods included previous turnout estimates … less dependence on previous elections [generates] wider margins [for Democrats].” (I added the words in brackets for clarity.)
Of the pollsters whose methods I could verify, only one history-based screen moved toward Democrats (The Argument’s, which also adjusted its sample to a voter-file model of the 2026 electorate). Screens based on stated intent alone were more mixed: Marquette’s and YouGov’s moved toward Democrats, but Abacus’s, High Point’s and The Citadel’s moved toward Republicans.
Fox’s Texas Senate poll is a good example. It had Democrats up 6 among registered voters and tied among likely voters. Democrats won by 12. (By way of caveat, The New York Times/Siena University poll had been performing well by this LV-RV metric earlier in the cycle, but in its final polls only produced LV estimates publicly. Those surveys thus don’t appear in this chart.)
Jason Corley of Quantus Insights, whose polls understated Democrats by about 9 points on average (one of the largest errors in the industry), diagnosed his firm’s problem to the Post’s Scott Clement: “A likely-voter screen built on past turnout can’t see a surge electorate.” (That’s true, but it also appears that Corley got some method details wrong when adjusting his polls for past vote.)
The bottom line
So here’s the upshot. Polls underestimated Democrats by about 3.5 points on average this year, with some particularly large misses in a few high-profile Senate races. James Talarico is going to win the biggest majority in a Texas Senate race in over a decade!
As best we can tell with early data, the main cause of the misfire was turnout modeling, rather than non-response bias among certain groups. This presents a few lessons for pollsters and for poll-readers:
Weight stated vote intention more when the out-party is surging, such as in midterms. Vote-history screens assume the next electorate will look something like the last one (or, more precisely, similar to whatever hypothetical a pollster creates using historical turnout data). But when one side is unusually motivated, that assumption breaks down.
Weighting to 2024 vote isn’t the problem. Weighting a sample’s 2024 voters to the 2024 result worked fine in our polls. The mistakes are pinning the 2026 electorate to the 2024 one, or relying on 2024 recall gathered two years later, when some disaffected Trump voters stop admitting how they voted.
Publish a range of poll results showing the influence of different turnout assumptions on vote margins. I have written about this before on this blog, but I’d love pollsters to start publishing a range of estimates for the horse race that show how the election could go depending on different (reasonable) assumptions and vote switching one could make. Like this.
I think pollsters are a little relieved that polls didn’t understate Republicans again for the 7th cycle in a row. New techniques like weighting by recalled vote and party to the Pew NPORS have given most pollsters the tools they need to bring their samples in line with the political composition of the electorate, when non-response isn’t a large factor within past vote.
But this election showed how more basic assumptions pollsters make about how to model the electorate still matter a lot, and there is no single best solution. What worked this year might not work in 2028. Yet while pollsters cannot hope to increase the accuracy of their methods much beyond the typical performance in the last 20 years (this is just a very inexact science), they can improve how they present their results and communicate uncertainty in estimates.


"Now, I do not agree with people when they make a big deal out of polling “errors” of just a couple points." GEM
Nor do I. Although the focus of this column is on the turnout assumption, going forward pollsters will need to make turnout assumptions and more! Given a sparse data set (too bad we don't have monthly elections) making good assumptions will continue to be challenging. Any future result inside 2% should be seen as total pollster dominance given the noise in the system. As for the chain of Republican coin flips, just like real coin flips three or four or even six in a row is not that improbable. Assuming pollsters aren't putting their thumbs on the scale.
Showing race polling like the House and Senate predictions (distribution with a range of probabilities) would help at least some people keep a better mental model of what a 53/47 poll result means.
I wonder if any of the big pollsters are going to focus more on recruiting & maintaining LT respondents (e.g. the "I'll take every poll" sickos and the "eh, I'll click once every few cycles"). I think #3 is most likely. Would love to see what Cygnal could do boosting some of the charts they bury on like page 45 of their methodology upload