

Is Texas actually a blue state?
Party registration statistics show there are more Democrats in Texas than Republicans... or do they? This and more in the Strength In Numbers August 2025 Q&A.

Good morning from the D.C. metro area. I've been traveling a lot recently and am glad to return home to promising fall weather. This month's Q&A comes to you from the hammock on my patio.
I love writing these posts because they’re a fun way for me to engage with readers directly while still adding value for the entire audience. The strategy in terms of ideas per person reached is not dissimilar to that of a book, where an author spends years perfecting a set of stories or research around one idea that hopefully hundreds of thousands of people will read. I spent about a full day on this, and at least 26,000 people will read it. That’s a strong ROI, so keep the questions coming!
This month, y'all asked:
About voter registration statistics and gerrymandering in Texas
How Americans feel about federalizing the National Guard
What's up with the "pollster" Rasmussen Reports?
Does passing unpopular laws matter?
And more.
One programming note: The September Q&A will go out on the 30th. You can send questions for next month to me via email (questions[AT] gelliottmorris.com) or leave them in the comments of this post.
As usual, the Q&A will be paywalled about halfway through as a reward for paying members of Strength In Numbers. You can sign up to read the full version here:
Without further ado, let's jump in.
Is Texas actually a blue state?
Chevelle asks:
The NY Times had a huge article this week on declining party registration for Democrats. I just discovered that my state (Texas) has substantially more registered Democrats than Republicans (as well as a good chunk of Independents). And yet Texas is considered to be reliably red. Are Independents in Texas reliably Republican voters? Are registered Democrats unlikely to turn out consistently? Or is there some other explanation for this stark difference between party registration and voting patterns?
So it's true that the reported estimate of voter affiliation in Texas leans Democratic, but there is some important nuance to how these estimates are generated and what they mean here in the real world. The bottom line is that characterizing Texas as a "Democratic state" is based on a misunderstanding of how these statistics are generated and what they predict.
Here's a map of Texas registered voters by their estimated party affiliation, per the voter data company L2:
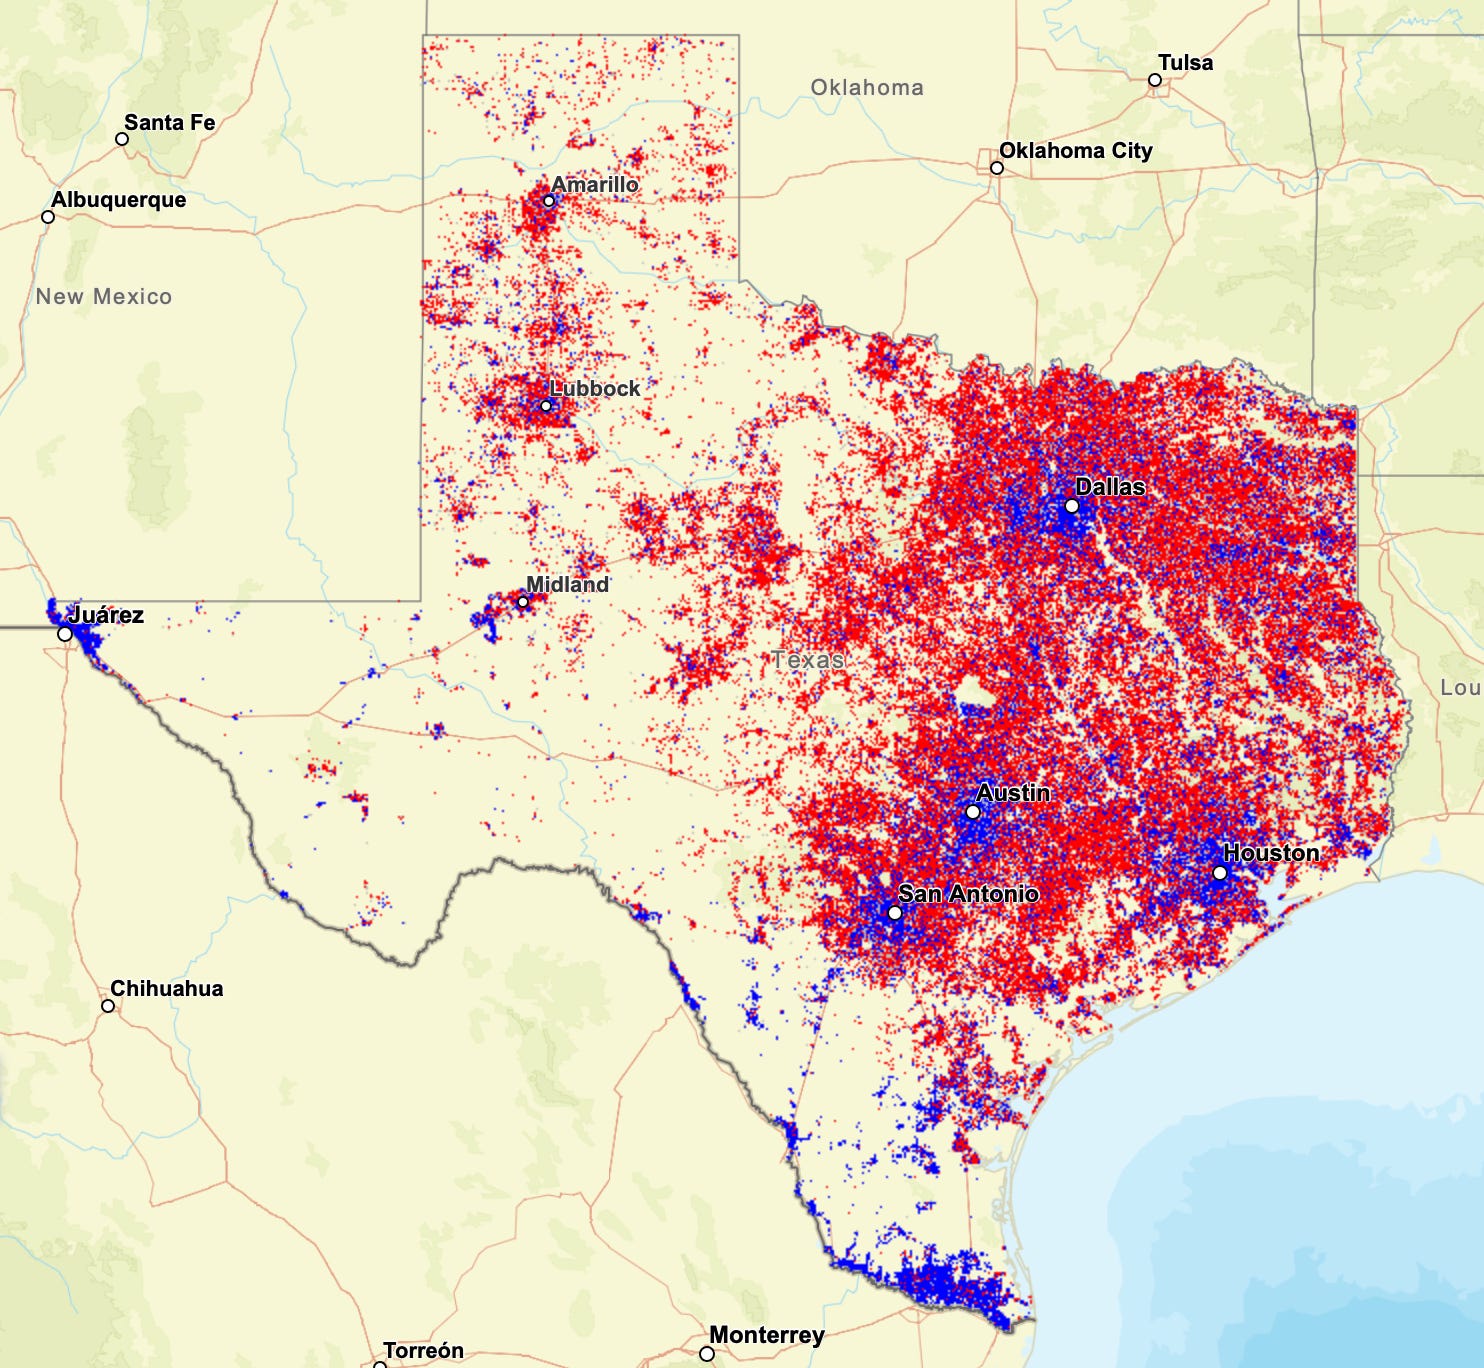
(Yes, we have access to a voter file now here at Strength In Numbers. I believe we are the only publication on Substack that does!)
See, the thing is, not all states have party registration. Only 30 do… and Texas is not one of them. In Texas, you can temporarily affiliate yourself with a party by voting in its primary, but (a) that affiliation falls off after a few elections and (b) that is not the same as party registration (which happens when you register to vote). So the totals people are seeing are predictions of party registration for both voters and non-voters, based on things like their surname, where they live, their age, which party's primaries they vote in, etc. And these predictions are not perfect predictions of who someone votes for.
Read more on this from L2 here: "How L2 Models Party Affiliation in Texas"
If you don't have party registration or a poll, by far the best predictor of someone's vote choice is which party's primary they regularly vote in. The problem is that there is a large proportion of Texans who haven't ever voted in a primary, leaving voter file companies to make pretty imprecise guesses of their affiliation. L2 reports that 41.1% of the electorate has participated in a primary at some point in their lives. Those voters are 56% Republican and 43% are Democrats.
The remaining ~60% of Texans who have never voted in a primary are modeled as Democrats at a rate of 46.5%, 37.7% are modeled as Republicans, and 15.7% are modeled as having no party affiliation.
So, the solution to the puzzle is twofold. First, turnout. Second, voter registration is not the same as vote choice.
On turnout:
Simple math shows that registered Democrats have a big turnout problem in Texas. Here is the number of each party's voters who turned out in 2024, divided by the total number of party affiliates L2 estimates live in the state:
Republican: 5,312,492 / 6,609,171 = 80.3% turnout rate
Democratic: 4,793,245 / 8,187,929 = 58.5%
NPA: 1,207,602 / 2,796,074 = 43%
So while all Texans who are modeled as either Democrat or Republican are 55% Democratic, only about 47% of voters in 2024 are modeled as Democrats.
In other words, turnout alone explains most of the disconnect between modeled party registration and outcomes, but 47% is still 4% higher than the share of the two-party vote cast for Kamala Harris in 2024 (43%). So the rest of the answer is that modeled party ID is not the same as vote choice. A good proportion of those modeled Democrats had to have voted for Trump (especially in the Rio Grande Valley, where imputation based on surname is likely to exaggerate the Dem lead), and a large share of the NPA voters are also Trump voters. There are a lot of modeled "independents" in Texas who did not actually vote for independents.
So this is why you don't want to infer partisan outcomes by voter registration. Texas is not a "blue" state just because
Red vs blue
And here's a related point: We are not a nation of "red" and "blue" states, but mostly a nation of varying shades of purple (Washington, D.C., and maybe Vermont and Wyoming are the exceptions). For the most part, elections even in "red" states like Texas are decided by differences of less than 10 or 20 points between each party. Nearly 45 out of 100 Texans in 2024 voted Democratic at the presidential level!
The red/blue distinction misleads the public by exaggerating polarization and making them think their neighbors are more homogeneous than they are. Here's one of my favorite papers on this subject, which presents respondents in a survey experiment with one of the following graphs and then asks them to predict how certain states voted:
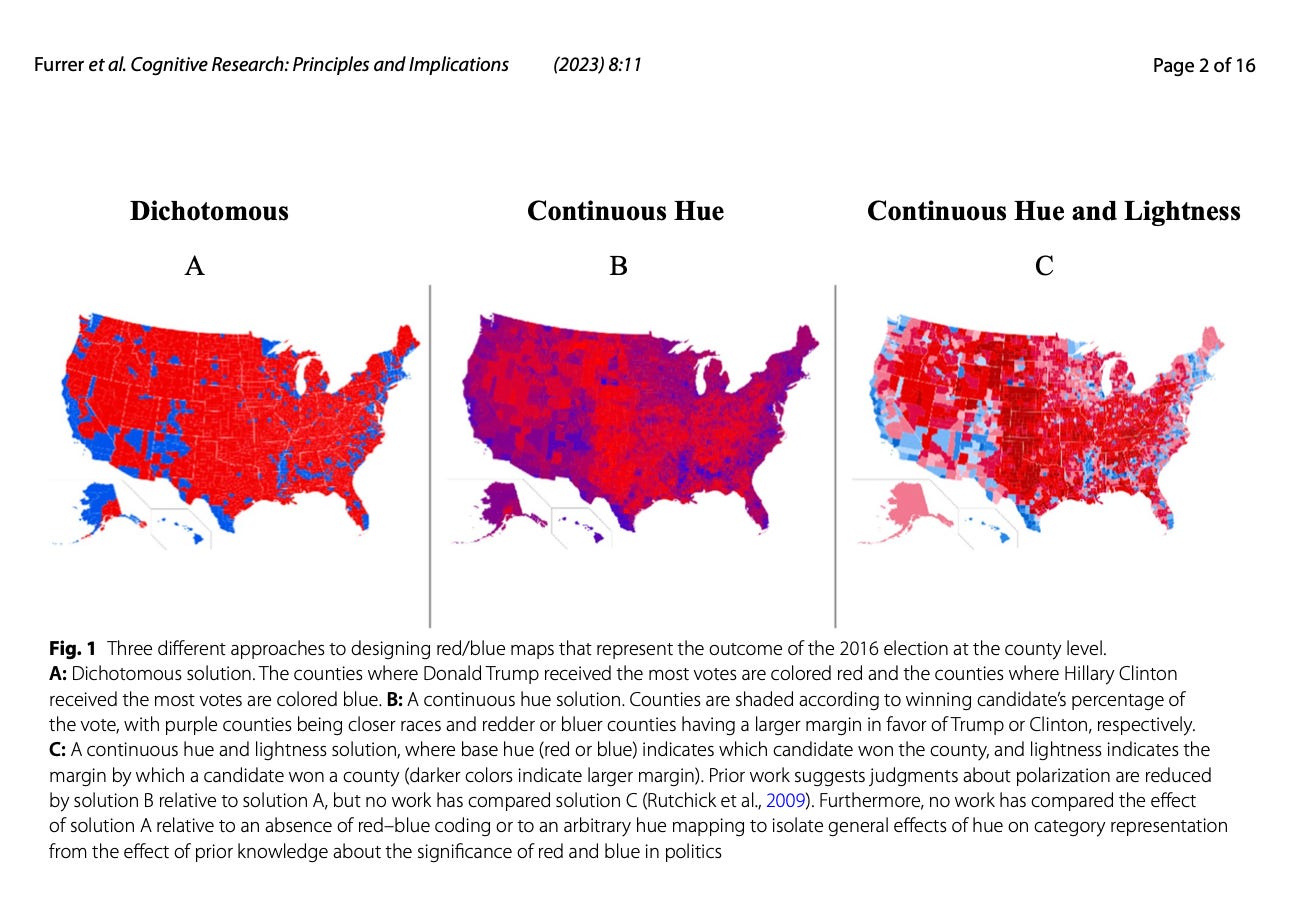
Overwhelmingly, voters make the best predictions of election results after they are shown a map with continuous colors, rather than the red/blue binary.
We are a nation of mostly purple constituencies with some solid red and blue sprinkled in, pulling state outcomes in either direction. Think about it this way: In an election, that matters, but you wouldn't characterize a school of 70% high schoolers and 30% elementary school kids as a high school.
Personal anecdote time. In July of 2024, I told my colleagues at ABC News that they should start coloring toss-up states on broadcast coverage as purple instead of yellow, which graphics had decided looked best for audiences 30 years ago. That decision had left ABC using purple to represent all third-party candidates, such as for the Libertarian and Green parties, which we at FiveThirtyEight did not feel were purple candidates or positioned between red and blue, but often on the ideological poles. Additional context here is that the TV side of ABC was trying to force the digital side, including 538, to adopt its normal coloring rules regardless of our different audience, format, history, and products. This level of intrusion was a constant annoyance while I was there.
We argued that toss-up states should be purple, since they had a mix of red and blue voters, and third parties should get whatever color they claimed (yellow and green per the parties above). We argued this case with the head of broadcast operations, who respectfully disagreed, and took the debate all the way up to the president of ABC News. She ultimately decided we were right and asked everyone to switch to using purple for toss-ups. Big victory for the news nerds!
Well, unfortunately, the president resigned soon after this for unrelated reasons (or maybe Bob Iger was just that pissed about the color purple?), and everyone on the broadcast side of operations immediately went back to their old ways. They told us it was "too hard" to update the colors and that purple "looked bad" on TV. Maybe they were right, and the products should have been siloed all along. Certainly, 538 would have fared better if out-of-touch executives hadn't tried to force it to fit into a broadcast TV format (and if they had let us pursue existing plans for monetization).
But my bigger point is this: I think this episode might tell us something about the media's initial decision to divide us into red and blue states in the 1990s in the first place. The way that these people made such consequential decisions about media coverage would shock you. They are generally unmoored from both social science best practices and common sense outside the NYC bubble.
Anyway, we were right. States like Wisconsin and Nevada are not yellow, and they are not gray until they are red or blue. They are purple. They contain a mix of red and blue voters. What happens when you mix red and blue on a palette?
Gerrymandering in Texas
Matt wants to know:
I see that Rick Wilson is saying that the gerrymandering in Texas is going to backfire on the Republicans and lead to a Democratic landslide in the midterms. [...]
My question is whether, if they are in fact willing to gerrymander, they can get more congressional seats than the GOP and, if so, how many states would have to be involved (assuming that the Republicans also aren’t content with just doing it in Texas).
I will direct Matt to my article from last Friday. According to redistricting experts I follow, all the mid-decade gerrymandering going on will likely net between 4 and 9 seats gained for Republicans.
This is a sizable boost, but it wouldn't prevent Democrats from winning the majority of the chamber. According to my simulations of seat totals based on changes in the national political environment, in the R+9-seat scenario, Democrats need to win by just 1-2 points to win the majority:
For context, that 1-2 point win is about as large as Republicans’ margin in the 2022 midterms, and less than the Democratic Party's margin in our current generic ballot polling average.
Voters' support for democracy
Evan asks:
About your democracy & gerrymandering polling results: Great set of questions and super interesting! It might be too complex or require too much oversampling, but I am curious to what extent the responses to "when we ask respondents to consider whether they’d still support fair, neutral maps even if their preferred party lost seats" varies depending on living in certain states where that issue is particularly salient (TX, CA, to a lesser extent NY, e.g.). Or if partisanship matters conditional on state context.
Do Republicans living in "blue" states feel similar to Republicans in "red" states on this Q? (and vice-versa for Dems?).
This is a great question. I loaded up our polling data to test for some differences by state and by party affiliation…
