Why most polls overstate support for political violence
Misperceptions about the popularity of violence increase public support for it — but you can help change that.
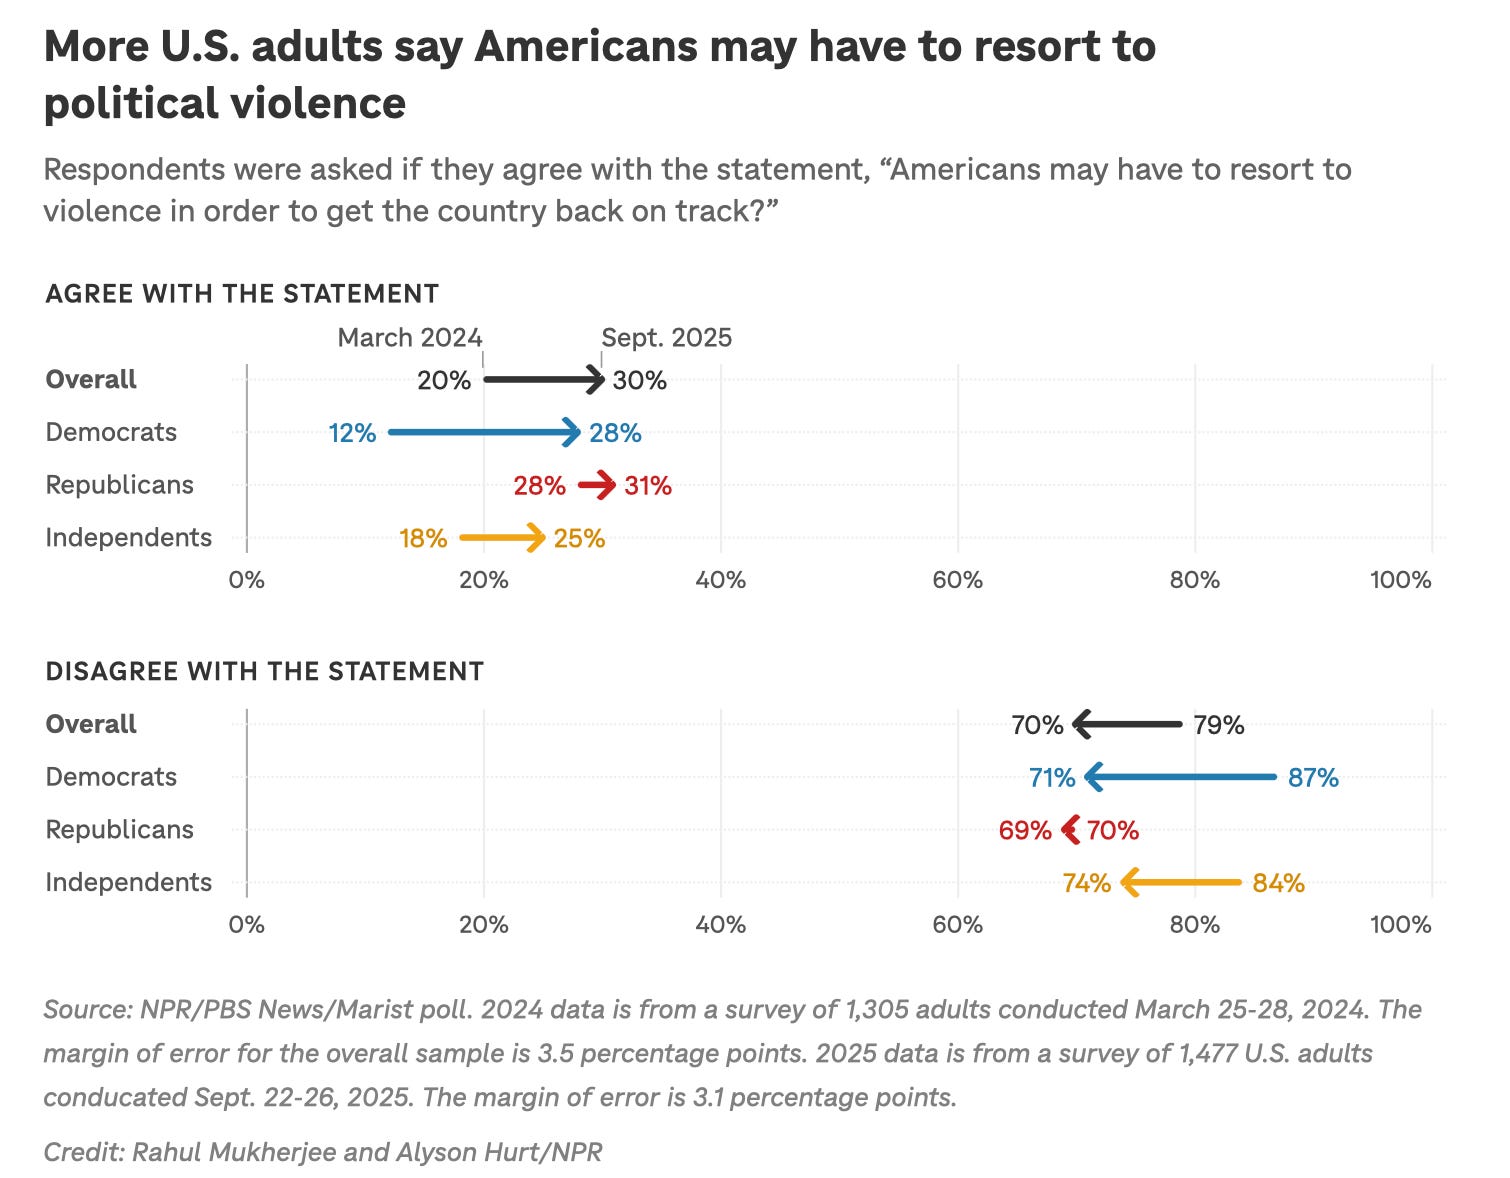
A new poll from NPR, PBS, and Marist College published on Wednesday, Oct. 2, shows a “striking change in Americans’ views on political violence.” We have grown much more violent as a country over the last year, NPR reports, with the share of U.S. adults who agree with the statement “Americans may have to resort to violence to get the country back on track” growing from 20 to 30% over the last 18 months.
Here is NPR’s chart:
This is scary data indeed. In NPR’s coverage of the poll, Cynthia Miller-Idriss, a professor at American University, says the data is “horrific”: “It’s just a horrific moment to see that people believe, honestly believe that there’s no other alternative at this point than to resort to political violence.” Where does America go from here?
But here’s the thing: The NPR/PBS/Marist poll did not ask people if they believed “there’s no other alternative at this point than to resort to political violence.” The survey asks adults whether or not they agree with the statement that people “may have to resort to violence in order to get the country back on track.” This is comparatively a much weaker statement and comes with a potentially heavy dose of measurement error. Respondents are asked to imagine a hypothetical scenario in which they’d have to commit acts of violence against a vague, unspecified victim. Maybe that means taking up arms against the government or their neighbors, or perhaps it just means throwing a rock at a cop or through a shop door.
The problem with polls and reports like this, in other words, is that they are not asking about the “political violence” we are imagining in our heads: An insurrection at the Capitol; driving a car through a crowd of protestors; shooting an activist you don’t like with a sniper rifle. The unfortunate reality (especially for those of us who care about democracy and what the people think) is that this survey does not ask whether Americans support certain acts of violence against their neighbors, even though that’s what the poll is being used as evidence for.
This disconnect between what is being polled and what is being talked about is part of a broader pattern I’ve pointed out in my recent coverage of political violence: Most polls overestimate mass support for political violence. I explain why this is the case, and why this is important for everyone from pollsters to elite journalists to casual news consumers to reckon with.
Most polls overstate support for political violence
To be clear, I’m not picking on NPR, PBS, and Marist here. Consider a YouGov poll released last month, which showed 11% of adults and 25% of liberals think violence “can sometimes be justified” to “achieve political goals”: The latter percentage even got repeated by Vice President JD Vance when he hosted Charlie Kirk’s video podcast a couple of weeks after Kirk’s murder:
However, these numbers are potentially misleading for a number of reasons. Problems with these surveys are well-documented in political science research, and objections mainly boil down to these three problems:
Support for political violence is higher if you ask respondents to imagine hypotheticals where violence could be justified, instead of, e.g., asking about support for concrete actions (like “would you murder your partisan opponent?”)
Support for political violence is higher among “inattentive respondents,” who will say yes to questions without reading them carefully, exaggerating the percentage of a sample that will say “yes” to all sorts of questions
Support for political violence is higher when question scales have more options for “yes” than “no” (for example: “Not at all,” “A little,” “A moderate amount,” “A lot,” or “A great deal”)
Here’s a study from Bright Line Watch in 2021 that shows this in action. BLW does three interesting things to combat the above biases: First, they separate out inattentive vs attentive respondents using a set of factual questions that everyone knows the answer to (eg, “Was Barack Obama the first president of the United States?”).
Second, BLW does not ask about generic “violence” but instead specifies three types of actions in different questions: “non-violent misdemeanors,” “non-violent felonies”, and “violent felonies.” Then, they provide examples of what each type of violence means (for example, for violent felony: “assault during a confrontation with counter-protestors”).
And finally, the researchers ran a survey experiment where half of their poll received the above response scale and half received a two-question response scale, first being asked a simple “yes/no” answer and then being asked about their intensity of support.
These changes are designed to create a survey that asks respondents how they feel about specific acts of violence, not hypothetical “violence” in general, and makes sure that they are actually paying attention to and thinking about the question.
When researchers correct these common survey design problems, public support for violence drops sharply. Adding a clear definition and filtering out inattentive respondents yields 9% support for threats, 8% for harassment, 6% for non‑violent felonies, and roughly 4% for violent felonies or using violence if the other party wins:
In other words, the popular numbers drifting around (including being shared by Elon Musk on Twitter) overestimate support for political violence by 6x!
And importantly, when you ask about support for felony violence among attentive respondents, there are no differences by party:
The largest partisan difference BLW found was when they asked if it could be justified to use political violence to “restore Trump to the presidency.” But the difference is still rather small (maybe 6-7 points) and the effect is driven by priming effects for both parties — Republicans are primed to favor the action, and Democrats to reject it.
Become a paid member of Strength In Numbers
I published this article in front of the paywall in the hopes that it would make a difference to how people think about polls on partisan violence. You can support our mission of helping people understand politics, public opinion, and democracy — for the good of the public — by taking out a paid membership to SIN today:
The political violence doom loop
The reason it is important to correct the record here is that misperceptions about support for violence could actually raise support for violence. This was the subject of a Sunday Strength In Numbers roundup a few weeks ago. When people believe that members of the other party support partisan violence, they become more likely to endorse partisan violence themselves:
This graph shows that the more people an individual believes support partisan violence, the more likely they are to support violence. Looking at the effect size here, getting everyone to believe that 30% instead of 5% of Americans support felony violence translates to increasing the share of all U.S. adults who say they support partisan violence, in the real world, by almost 10 percentage points.
This chart shows us how political violence is a psychological arms race, subject to the same tribal doom loop that characterizes political polarization and the tendency to dehumanize the opposition. After all, this is a natural response if you’ve come to view your political opponents as an opposing tribe threatening to wipe you out. No side wants to be caught flat-footed against an opponent that wants to murder them. Nobody wants to bring a pen to a gunfight.
People are saying, “Hey, well, if they want to hurt me, I might as well hurt them back.” Fair enough — the problem is that, at a minimum, 95% of Americans do not want to hurt you based on your politics. Other research finds that support for partisan murder, in particular, is opposed by 99% of adults.
This makes rhetoric about partisan violence very crucial. Spreading the misinformation that a lot of Americans — especially if you lay blame on one side of the political spectrum — support partisan violence actively increases the probability of future violence.
And regardless of the intentions of the researcher, irresponsible actors can also use these data to do real damage. About that YouGov poll, JD Vance said, “24 percent of self-described quote, ‘very liberals,’ believe it is acceptable to be happy about the death of a political opponent,” and “26 percent of young liberals believe political violence is sometimes justified.” He continued:
In a country of 330 million people, you can of course find one person of a given political persuasion justifying this or that, or almost anything, but the data is clear, people on the left are much likelier to defend and celebrate political violence.
This is not a both sides problem. If both sides have a problem, one side has a much bigger and malignant problem, and that is the truth we must be told. That problem has terrible consequences,”
Of course, JD Vance is also characteristically cherry-picking his data here. The Marist poll finds Republicans are more likely to support violence. When different polls conducted via different modes or pollsters disagree about something this important, it’s best to treat any of the findings with skepticism.
But the point is that misperceptions about violence have consequences. Given our tribal mentality, spreading those misperceptions by blaming one side of the aisle is particularly dangerous.
Correcting misperceptions decreases support for violence
So what can you do about this?
The good news is that if you correct people’s misperceptions, their own willingness to support violence decreases significantly. Another experiment in the study linked above compared support for political violence among a control group and a treatment group, where the treatment was people being told that support for violence was actually very low. This reduced respondents’ support for violence by between 40% and 80%:
In other words, we could decrease aggregate support for partisan violence significantly if we gave everyone the correct data on this question. And that’s the low end of the estimated effect size.
So, share this article with your neighbors. If you work at an outlet reporting on polling about political violence, raise this study with your colleagues. If we can be vigilant by countering claims that large masses of the public support attacking the opposition, we can meaningfully reduce the probability of general political violence in the future. That’s an easy, high-leverage project that all of us can contribute to.
Contrary to the statement by Miller-Idriss (the professor mentioned at the start of the article) few people actually believe “there’s no other alternative at this point than to resort to political violence.” The vast, vast majority of Americans want to live peacefully in a country where their beliefs are tolerated by their neighbors, where they don’t have to fear for their lives for putting a campaign sign out on their lawn. Our job as responsible citizens is to give them a reason to believe in that vision for their neighbors, too.
Here are the facts: Less than 5% of adults support their co-partisans committing violence against members of the other party. Less than 1% support murdering the opposition. Use these facts to advance a vision of the country you want to live in.
This is exactly the kind of thoughtful analysis missing from most "news." Who wants to read a story heaadlined "Less Than 5% of Country Supports Political Violence" vs "Over 30% Say Political Violence Can Be Justified"? How many news subscriptions or TV viewers does that get you? Sheesh!
Good and very important post. It's also worth noting that even the 4% estimate is almost certainly a sizable overestimate because of misclassification bias. The short version of this argument is that surveys are bad at estimating the size of extremely small groups because even a small measurement error (e.g. clicking yes when you meant to click no, misreading the question as being against violent felonies instead of in favor of violent felonies), multiplied by the vast majority of respondents who are not in the population, will still result in greatly overstating the percentage of people in the very small group. Removing obviously inattentive respondents probably reduces this bias, but does not eliminate it.
An example of this error being used to erroneously claim that the CCES shows non-citizen voting: https://cces.gov.harvard.edu/news/perils-cherry-picking-low-frequency-events-large-sample-surveys#:~:text=Hence%2C%20a%200.1%20percent%20rate,no%20non%2Dcitizens%20actually%20voted.
If you prefer an example from the opposite political valence, here is a paper overestimating the percentage of Americans who have witnessed a mass shooting: https://statmodeling.stat.columbia.edu/2025/09/22/its-jama-time-junk-science-presented-as-public-health-research/