The hidden axis: the left-right spectrum has a non-ideology problem
Most voters want a party that emphasizes cost of living issues and makes the world a better place. Few Americans think in solidly ideologically terms. "Moderates" are mostly non-ideological.
This article presents more results from our November Strength In Numbers/Verasight poll. You can read the first article about this poll here:
Introduction to this essay
Dissatisfaction with American politics and the two major parties is at a modern high. In our new Strength In Numbers/Verasight poll, 54% of voters said the Democratic Party doesn’t get people like them — and 55% said the same about the Republicans. Nearly a quarter said both parties are out of touch, and only a third of voters told us they are happy with their current choice of political parties. Today, most voters say that a major third party is necessary to get the country back on track.
While general anti-party sentiment is growing, Democratic strategists and center-left pundits are engaged in a fierce debate over whether to move the party’s “brand” and policy positions substantially to the right as a way to appeal to more moderate voters. Republicans will soon face similar soul-searching efforts, addressing the question of what the party looks like after Donald Trump is gone.
To address the questions from all of these groups, we need data. It’s obvious that Americans broadly want something new from their political leaders, but “something new” is not a policy platform or ideology. In order to start a successful third party — or to meaningfully change the brand of one of the major ones — we have to know what, exactly, voters actually want from their leaders. We need clean, clear, hard data.
Many analysts try to approximate an answer to these question by first looking the policies that are popular with voters, or by forcing voters to pick one of several pre-determined party platforms. Then, they use that data to infer the policy positions a party should take, and the messaging strategy it should use, in order to win the next election. They use their data, in other words, as a way to back in to an analysis of the thing they actually care about — as proxy for answering the question “What should my party campaign on to win the next election?”
These approaches can be useful, and are often cool from a data (esp. visualization) perspective. However, they suffer from two problems. First, the use of proxy variables (asking voters “do you favor this?” to answer the question “would you vote for a party that campaigns on this?”) introduces many assumptions into analysts’ models of how voters think and make their decisions.
Second, these approaches suffer from identification errors by researchers: In these approaches, survey analysts and party actors can only act upon information explicitly asked about in the survey. Question wording and response options are often drafted by strategists looking for a certain answer or pattern. This biases results toward the priors of the researcher. If you ask voters 20 questions about a mixture of economic and social policies, and force them to answer those questions, your analysis can be based only on the questions you asked and the response options provided. Then, you have to come up with a way of combining all that data to answer the ultimate question. It’s assumptions all the way down.
What if, instead of making all these assumptions, we simply asked voters straight-up what they wanted their party to advocate for — in their own words? This would certainly get us closer to the result we are trying to draw inferences about.
To this end, in our November Strength In Numbers/Verasight poll I asked over 2,000 Americans to describe, in their own words, their ideal political party. This article analyzes those answers and presents several conclusions for general readers, party reformers, and partisans looking for actual data to guide future electoral strategy.
This article has four parts: First, I write a general topline section and discussion of each group of voters I identify based on their description of their ideal party. Then, I map each voter onto the political spectrum based on the issues and positions they mention in their answer. Third, I show how the analysis of voters according to their economic and social left-right ideology obscures an important third dimension in politics. This third dimension is correlated both with political knowledge and ideological thinking in general, and a focus on material outcomes for voters rather than ideological policy positions. In the final section, I discuss the implications of these findings.
My argument in this piece is that American politics does not play out only on the usual left vs right political spectrum, but on a spectrum running from ideology-driven politics to pocketbook, material politics, too.
This article is in front of the Strength In Numbers paywall because I want it impact the way the public thinks about ideology and voter behavior. Specifically, the omission of any concept of ideological strength from most practitioner analysis on this subject makes it look like everyone, but especially political moderates, has a coherent mental model of politics and what parties stand for. But our data suggest that most Americans do not reference ideological issues when describing their ideal political party. Instead, most reference kitchen-table issues and general values about politics and society.
If you find this work valuable, please support Strength In Numbers with a paying subscription. Analysis like this takes time, effort, and computational resources — none of which are possible without financial support from you, the reader.
1. Most Americans aren’t ideological, and just want a party that lowers prices and works for the people
This analysis is based on a survey of 2,038 American adults in which they were asked to respond, in their own words, to the following question:
In a few words, what would your ideal political party argue for or believe in?
Respondents were allowed to write as much or as little as they wanted. The question came at the end of a survey about national politics today.
When reading through the open-ended responses to our poll, five broad visions of Americans’ ideal political parties emerge. These visions are not just left vs right vs center, but use a mixture of ideological and non-ideological language. They also offer competing ideas of what politics should even be for.
The chart below presents our headline findings. Most Americans tell us they want a party that improves their general standard of living, and don’t use ideological language at all when describing what their ideal political party would stand for. E.g., popular responses to our question were simply “The American dream,” “Work for the people,” and “Affordability.”
Inspecting responses by hand, I put voters into one of five categories based on the issues they mentioned and presence of ideological speech in their answers.
This first, non-ideological, kitchen-table group represents 38% of our sample.
From there, I categorized remaining voters based on the ideological lean of their answers and the anti-elite/anti-system sentiment expressed in their responses. While many voters mentioned clearly ideological positions such as “MAGA” and “strong borders,” or “Public healthcare for all at no cost” and “End of capitalism,” still others used anti-elite or populist language like “Professional Govt has got to GO! They are useless and have no concept of the American struggle.” Respondents were put in a right-wing (26% of the sample), left-wing (26%), or generally populist bucket (6%), respectively, if they included language similar to that above. Voters who expressed anti-system or anti-party attitudes (one person said “My ideal system would have no parties”) were also placed in the bucket with populists.
Finally, respondents that used words such as “moderate” or “centrist,” and those that said they wanted their party to take issue positions on opposite sides of the political spectrum, were put in a fifth group. These are voters who describe wanting to vote for an explicitly moderate political party, or hold a mix of liberal and conservative views.
1b. Examples from each party group
The above categorization gives us five party groups. Each group of voters expresses support for a different party that lands somewhere on each of three spectrums: First, the traditional left-right ideological spectrum, combining views on both economic and social policy; Second, the pro- vs anti-system axis of politics, where populists stand opposed to committed left- or right-leaning partisans; and third, the welfare/engagement/ideological thinking axis, where most voters express support for general welfare of the country and don’t mention any ideological concepts at all.
Using the labels above, my five categories are described as:
Affordability / General Wellbeing / No Ideological Content
These voters express desire for a party that keeps life affordable, protects basic rights, and focuses on practical solutions to help working- and middle-class people feel secure and supported.Generally Right-Leaning Positions
These voters want a party that champions small government, low taxes, strong borders, and traditional religious and family values rooted in constitutional freedoms.Generally Left-Leaning Positions
These voters want a party that expands the social safety net, advances equality and human rights, and funds robust public services by taxing the wealthy more.Populist / Anti-Party / Disengaged
Anti-system and disengaged voters want a party that seeks to break the power of career politicians and big money by enacting term limits, curbing lobbying, and reforming institutions to serve ordinary citizens first.Explicitly Moderate / Mix of Partisan Positions
These are ideological voters who want to vote for a centrist party that blends some mix of liberal and conservative views while prioritizing compromise, pragmatism, and de-escalation of partisan conflict.
To improve our understanding of what each group of voters believes in (and what the categories mean in terms of respondents’ answers), below I have described each party group based on the open-ended responses to our poll. I have also included a word cloud of the issues mentioned in each answer, broken down by each group.
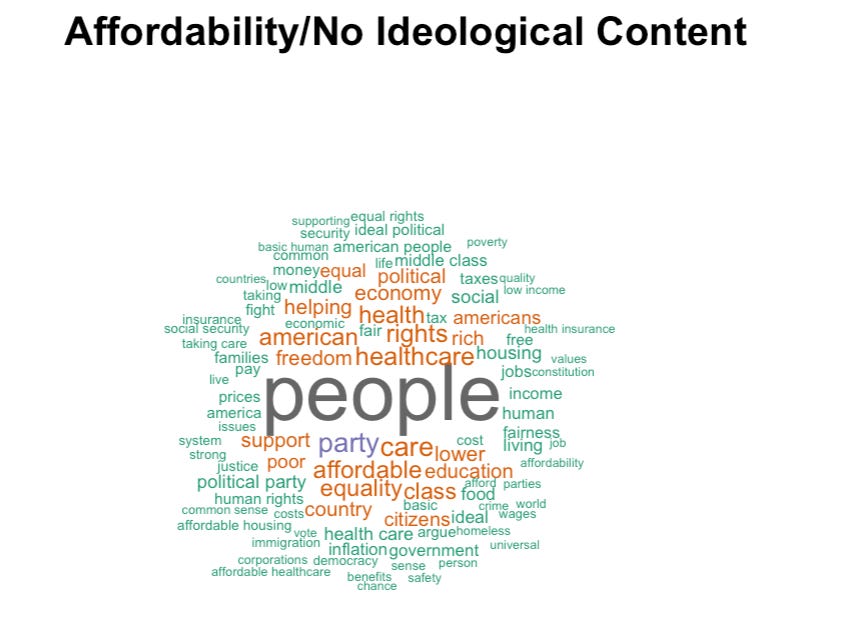
The Affordability Party (38% of adults)
Americans in this bucket are not looking for a grand ideological project, they simply want a party that makes day-to-day life less stressful. When these voters imagine an “ideal” party, they describe something that keeps basic necessities affordable, protects people’s rights in a broad sense, and looks out for the middle and working classes.
Unsurprisingly, the core of this vision is economic. Respondents talk a lot about the economy, prices, wages, jobs, taxes, rent and housing costs. They use words like “affordable” and “cost of living” and mention rising prices as their number one issue. Healthcare sits right alongside those pocketbook concerns: people repeatedly mention health care and Medicare, and they tend to frame access to affordable care as something close to a basic right.
There is also a lot of language on fairness. Words like “equality,” “rights,” “freedom,” and “treating everyone the same” are common, but they are generally not tied to “liberal,” “conservative,” “Democrat,” or “Republican” labels.
The vast majority of respondents in this group also don’t use clearly political language at all. Responses like “Help the people” and “Represent the people” are frequent. In that sense, this group is best described as focused on material wellbeing, and not intensely interested in politics — or potentially even aware of the ideological lines of American politics.
Concrete improvements in economic and social wellbeing is this group’s focus, and generally speaking, these voters do not specify an ideological path to accomplishing that outcome.
Here is a word cloud of the text that respondents in this group gave to our open-ended question:
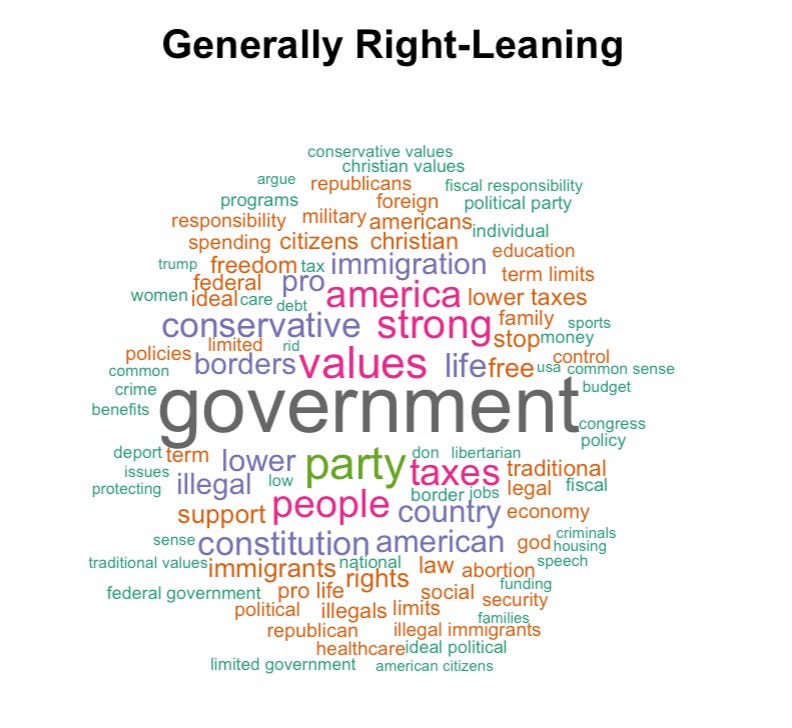
The Right-Leaning Party (26%)
The voters in the generally right-leaning group picture an ideal party built on small or limited government, traditional social values, and a tough line on borders and crime. They talk about a party that defends constitutional rights, keeps taxes low, and pursues “America first” priorities in economic and social life. In their view, government should exist, but it should be modest in scope and deferential to families, communities, and religious institutions — except when it needs to be tough on crime, immigrants, and trade.
Respondents regularly call for less government, smaller government, fewer regulations, or tighter controls on public spending; they say government should “stay out of people’s lives” and stop wasting money. Immigration and border security are also mentioned frequently. These voters oppose “sanctuary” policies for undocumented migrants and favor mass deportations. Traditional or Christian values and broader social conservatism also loom large, with repeated references to Christian or religious values, “family values,” abortion (in pro-life terms), gun rights, and “law and order.”
Appeals to constitutional rights and “freedom” often are mentioned before specific policies. Respondents may be using these labels as heuristics for organizing their political thinking. Compared with other segments, these voters are more likely to bundle concrete stances on taxes, immigration, and social issues with broad ideological frames about small government and religion.
Here is a word cloud of the text that respondents in this group gave to our open-ended question:
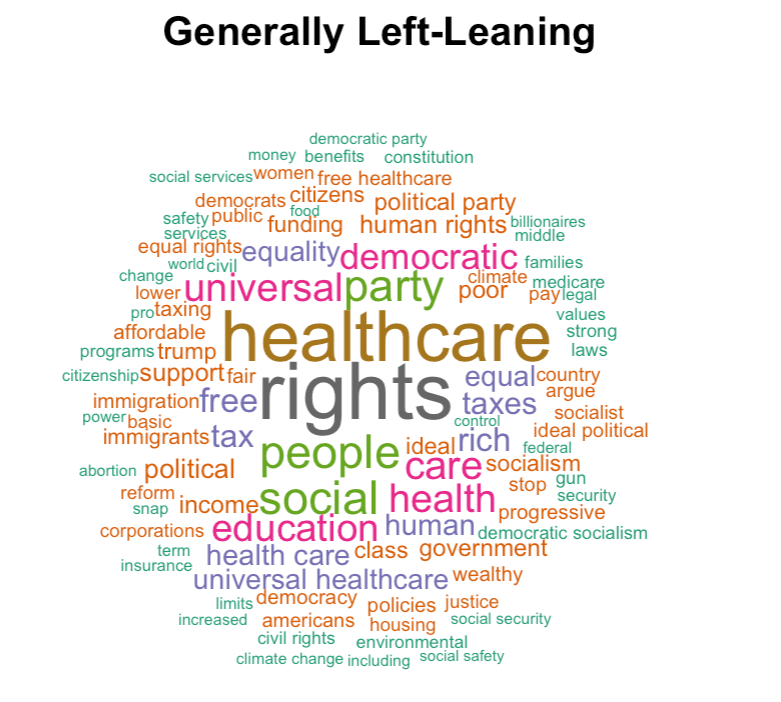
The Left-Leaning Party (26%)
The generally left-leaning group imagines an ideal party that uses government to expand the social safety net, reduce inequality, and protect vulnerable or marginalized groups. They want a party that is comfortable talking about human rights and social justice and that is willing to tax the wealthy more in order to fund public services.
Universal healthcare and a stronger safety net sit at the center of this vision. Respondents frequently mention healthcare — often explicitly as “universal” or “Medicare for all” — and call for improving the system as a whole. People in this group also use words associated with equality, civil rights, and social justice frequently. They often point to minority rights, LGBTQ+ rights, racial equality, and anti-discrimination as core priorities.
Many people in the Left-Leaning Party also support progressive taxation and redistribution, explicitly calling for higher taxes on the wealthy or “taxing the rich” to pay for education, healthcare, housing, and other services. Climate and the environment show up as well, usually in the form of calls for climate action and investment in renewables.
Not for nothing, respondents in this group were very ideological, in that they were attached to parties and ideological language. Only a small minority gave vague or apolitical answers. For many of this group, politics and policy are familiar subjects, their ideal party is clearly defined both in terms of values and policy. The left-leaning group is very “operational,” to use the terminology from political science.
Here are the words and phrases used most frequently by the left-leaning party:
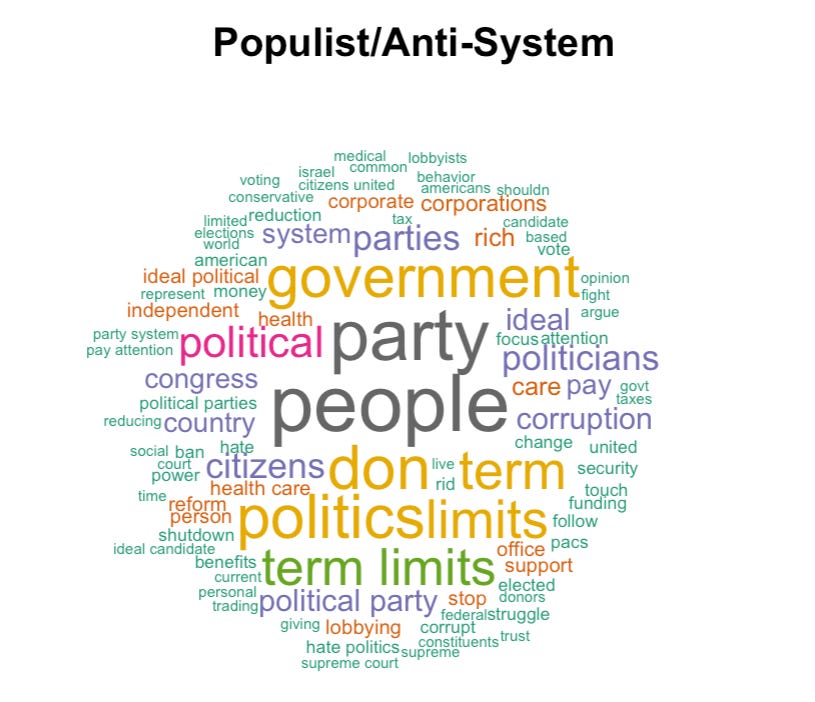
Populist/Anti-System Party (6%)
The populist, anti-party, and disengaged voters in this sample are united less by where they fall on a left–right spectrum and more by their frustration with the political system overall. When they describe their ideal party, they are often really describing an anti-party: something that does away with the current major parties, cleans up corruption, shrinks the distance between voters and officials, and stops politicians from treating politics as a career.
Issue priorities for this group include term limits for members of Congress, anti-corruption and anti-lobbying policies, and getting rid of “cronyism” in general. These voters want to curb the influence of PACs, lobbyists, corporate donors, and “big money,” and ban stock trading. They want politics to work for the people, but express this in anti-system language (“work for people instead of themselves!!!”).
In this group, traditional ideological content is rare. No respondents in this group describe their ideal party as liberal or conservative, and they rarely go into detail on policy areas like taxes, immigration, or health care. Instead, their answers are overwhelmingly about process, integrity, and accountability. The best way to understand this segment is not as a missing middle between left and right but as a bloc organized around distrust of political elites and a desire for systemic reform.
Here is a word cloud of the responses these voters in this group gave to our survey:
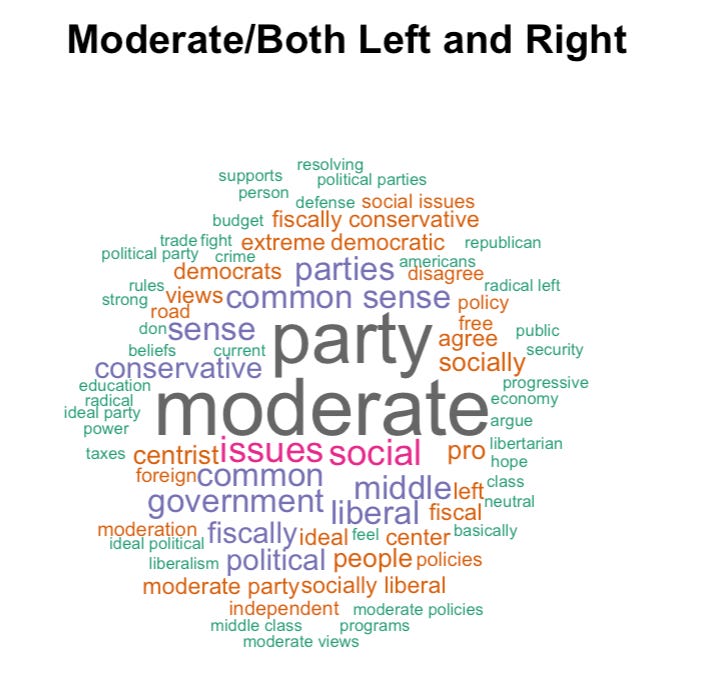
The Moderates (4%)
Finally, the explicitly moderate group expresses support for a party that lives in the true political center. These respondents describe a “purple” and “centrist” party that avoids extremes, taking “the best parts from both left and right.” In our formulation, someone is a moderate either by using the word moderate (or a similar word) in their answer, or by describing a moderate party with issues taken from both sides.
Compared with the other categories, these voters spend more time talking about where their ideal party sits on the ideological map than about any single issue. Concrete issues like crime, taxes, healthcare, or education do show up, but mostly as examples of where a balanced approach is needed rather than as core causes in and of themselves. Overall, this segment puts a premium on stylistic and ideological moderation.
Here is a word cloud of the words used by moderates in their answers:
2. Voters want a generally left-leaning party on both economic and social policy
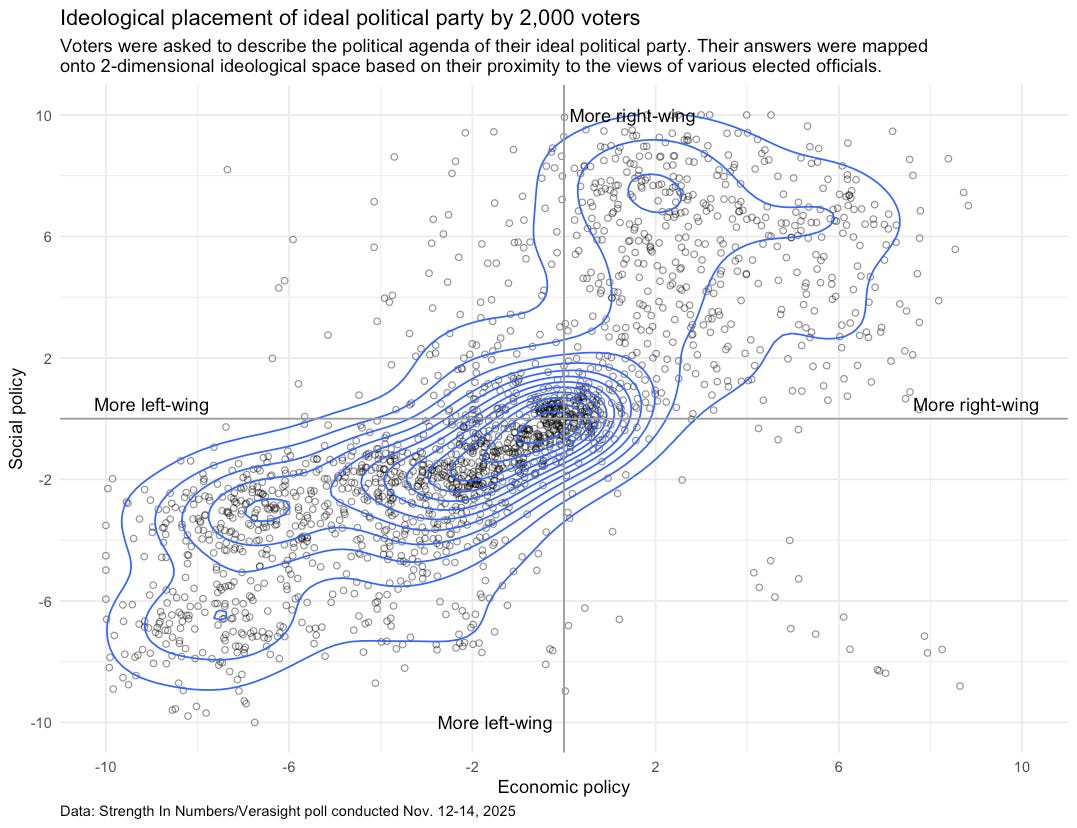
Diving in deeper now, I visualize how each voter describes their ideal party by placing it somewhere along the traditional left-right ideological spectrum. I rate the ideology of each party description on two axes, based on both the economic and social positions described in respondents’ answers.
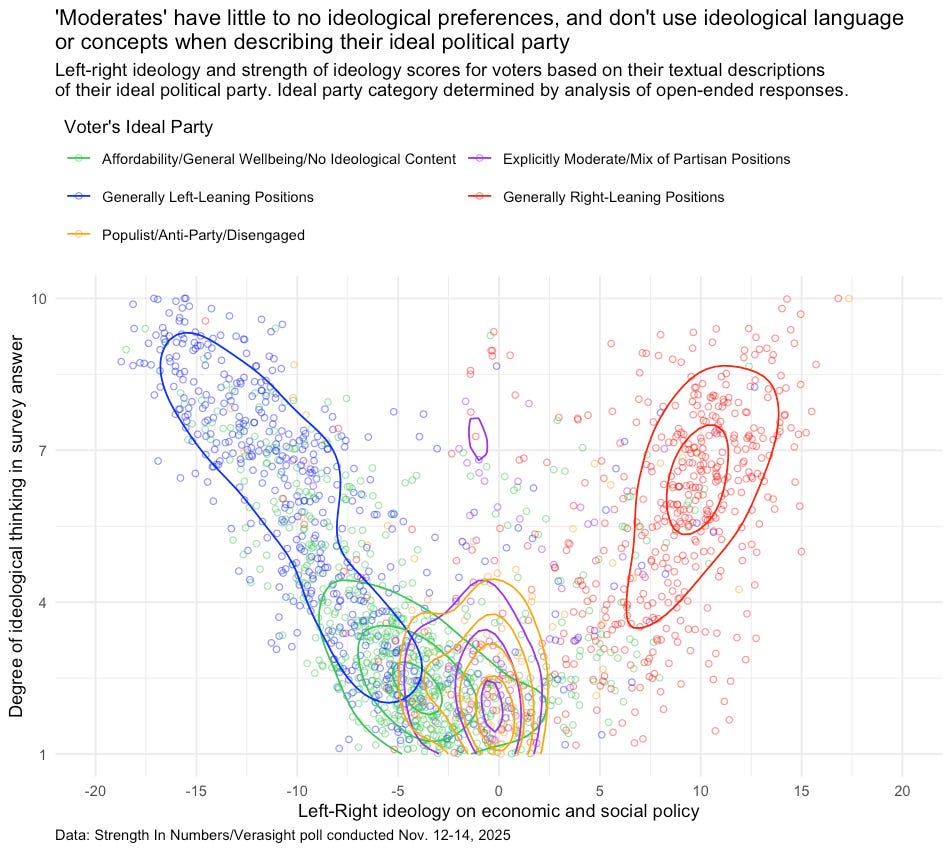
In the chart below, I have placed every respondent to our survey somewhere on the plot based on the ideological position of the ideal party they described in their survey answer. Each person’s ideal party was given an ideological rating on both economic and social policy, so that this chart would be comparable to other popular approaches for analyzing voter ideology. The contour lines on this chart are drawn computationally to highlight the density of points on the plot (most voters occupy the center or center-left).
However, compared to other approaches, this analysis is difficult because we have to place textual data somewhere on the two-dimensional ideological plane (whereas analysts with lists of issue positions can simply calculate averages across questions they deem as concerning “economic” or “social” policies). We are posed with the challenge of assigning quantitative numbers to qualitative text answers based on the meaning of voters’ responses.
A short methods detour
One method of analysis would be for a researcher to assign values for each answer based on their own idea of where positions belong on a scale in some two-dimensional space — say, from -10 to 10 on both axes, with negative values representing more liberal positions and positive values represent more conservative. However, this method poses several challenges, and two especially stand out: First, the bias of the researcher would inevitably pollute their analysis, since what one individually deems as ‘left’ or ‘right’ varies by person and by context. Second, it would take an unreasonable amount of time.
To solve these problems, I rely on a large language model (LLM) to return various pieces of data for each answer in our survey. Using the computational backend to OpenAI’s GPT-5.1 model (in other words, using computer code instead of ChatGPT on my browser) I send each text answer to the LLM and ask it to perform the following tasks.
First, the LLM identifies the major political issues and values mentioned in the response. If there are multiple issues or values mentioned, the model separates them with a comma. If a response is blank or says something like “idk bro” I ask the model to skip it.
Second, I ask the LLM to place the party the person described on the two-axis economic/social left-right political spectrum. I have the LLM return a rating from -10 to 10 for how left-right the described party is on each axis, and tell it that 0 represents a party in the middle. I give the LLM examples of what constitutes a traditionally left- or right-wing party in the US.
Third, I ask the model to rate the strength of ideology in a person’s response on a scale from 1 to 10 — with 10 representing a very ideological answer with strong partisan cues and ideologically charged issues, and 1 representing an answer with no ideological lean at all (eg, “affordability”).
The full prompt used in this analysis is given in the footnotes.1
While they come with a learning curve and some risks, LLMs have been successfully used by both academics and practitioners to study various topics in politics today. For example, LLMs are good at placing elected politicians on the left-right ideological spectrum, and can also categorize historical speeches made by U.S. political figures. While LLMs/AI fall short of many promises made by enthusiasts over the last couple years, we are relying on them for the one thing they are good at: summarizing and analyzing text.
Back to the data
When the LLM analysis is done running, we are left with new data on each of our 2,038 respondents for three auxiliary variables: (1) the left-right economic ideology of the ideal party they describe in their open-end; (2) the left-right social ideology of their ideal party; and (3) the amount of ideological words and phrase used in their answer/the person’s individual “strength of ideological thinking.”
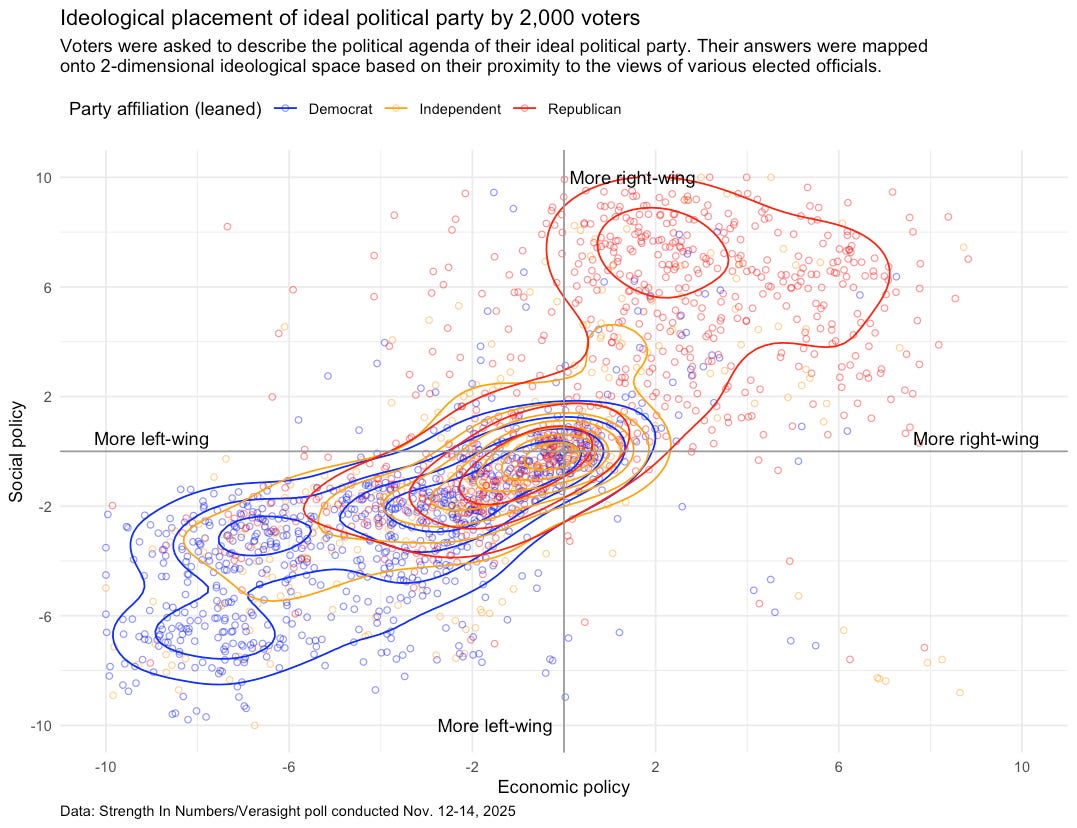
One enhancement we can make to the original plot above is to add colors for each political party. In the chart below, I have colored each voter by their self-categorized party identification., and they are placed as above — according to how they describe their ideal political party:
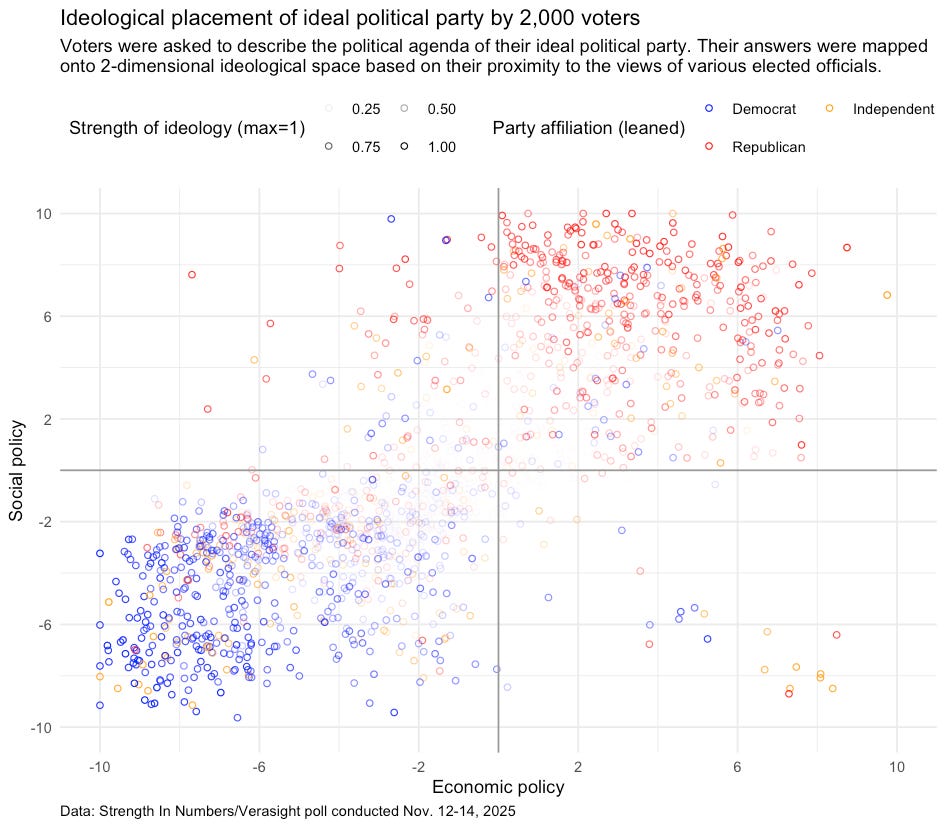
Observe how Democrats mostly describe a left-leaning “ideal party,” Republicans describe a right-wing one, and independents range the ideological spectrum but are tightly clustered in the middle.
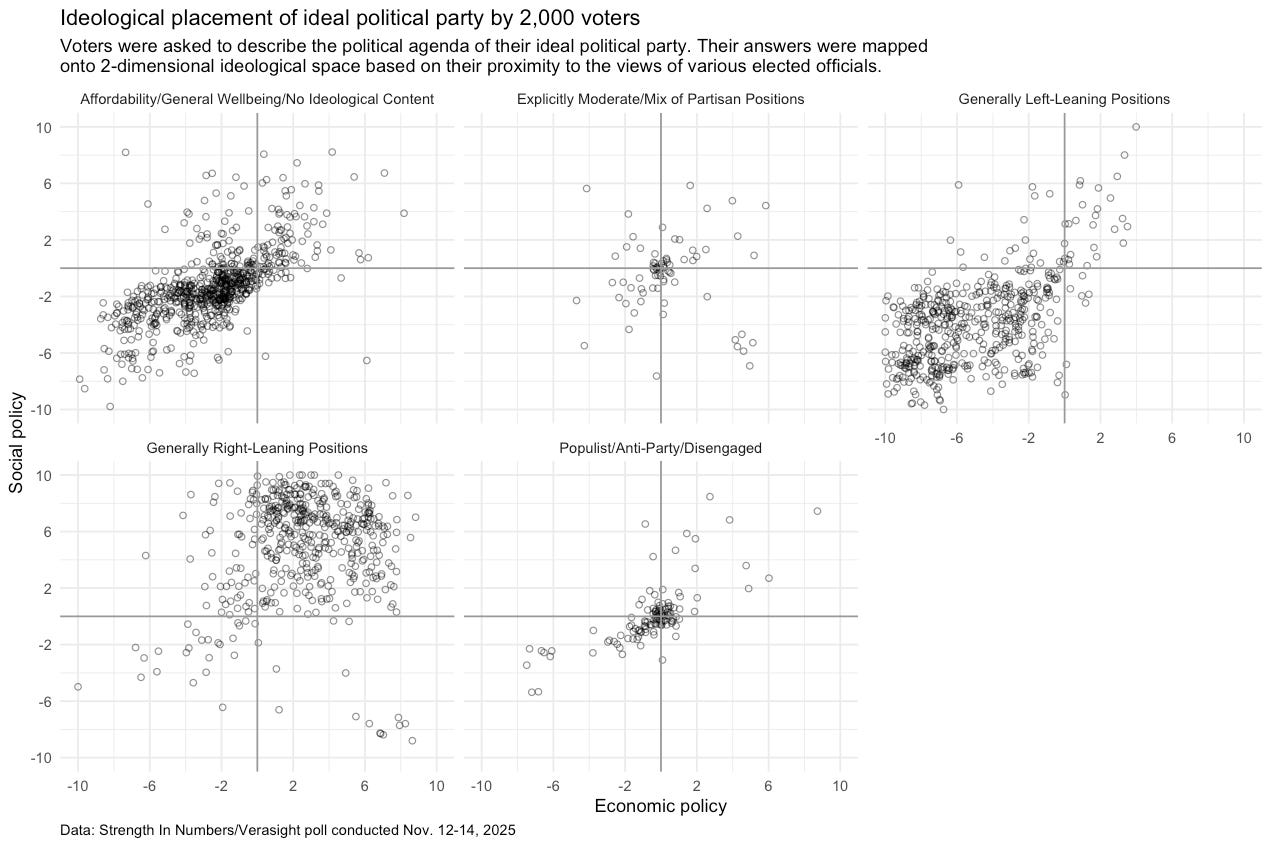
We can also create multiple plots that separate out voters based on those human-created categories I described in section 1 of this post:
The above plot has the added utility of validating both my human categories and the LLM’s reasoning. Voters falling into the categories I identified as left-wing, right-wing, or centrist mostly fall onto the appropriate portions of the graph. Additionally the affordability bucket has a mix of center-right and center-left codings, though visually appears to lean more center-left. This is likely due to many affordability-minded respondents using words like “equality” and “fairness,” which the LLM may assign a left-leaning value to based on the Democratic Party’s stance in favor of redistribution and equity.
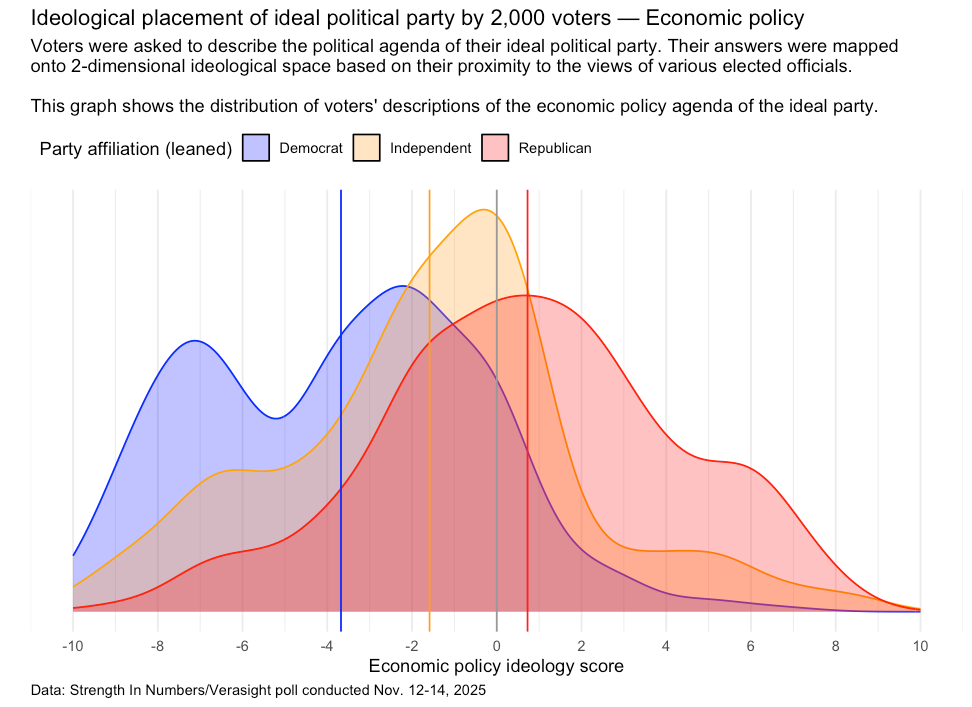
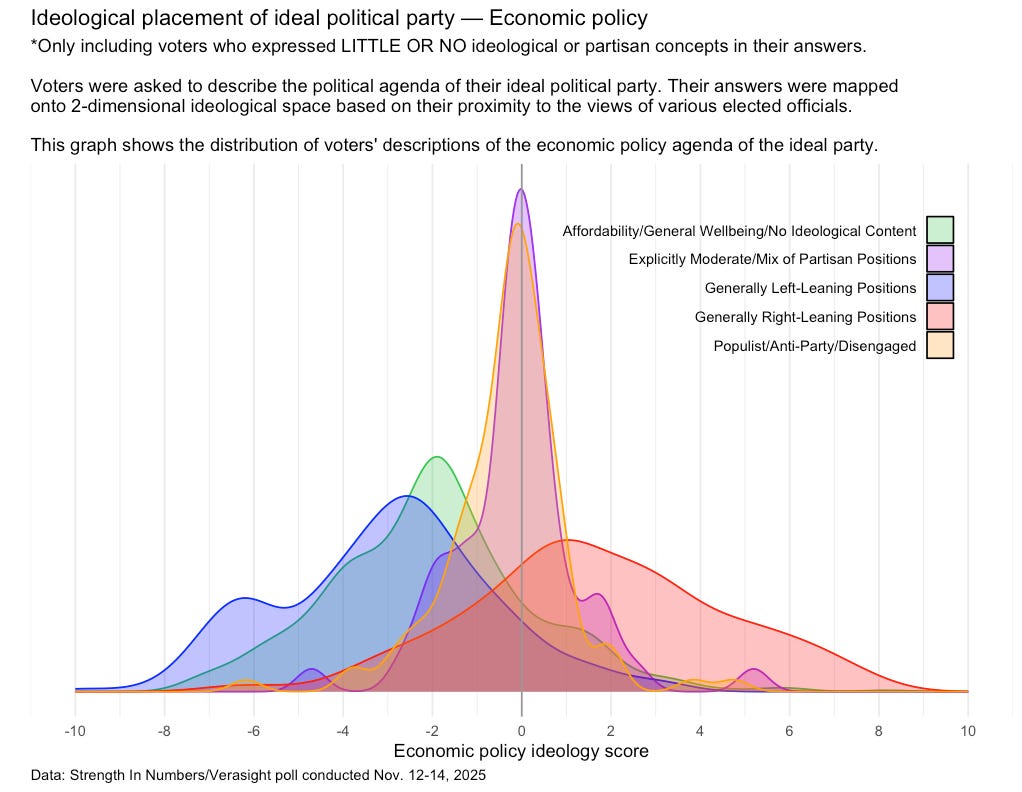
We can also greatly simplify the above analysis by looking just at one dimension of ideology at a time. Below, I have graphed the density of ideology scores for each political party, but only for the LLM’s score on economic policy. More voters exist on left-right spectrum where the curve for each party is higher.
Note the general lean to the left for Democrats and independents:
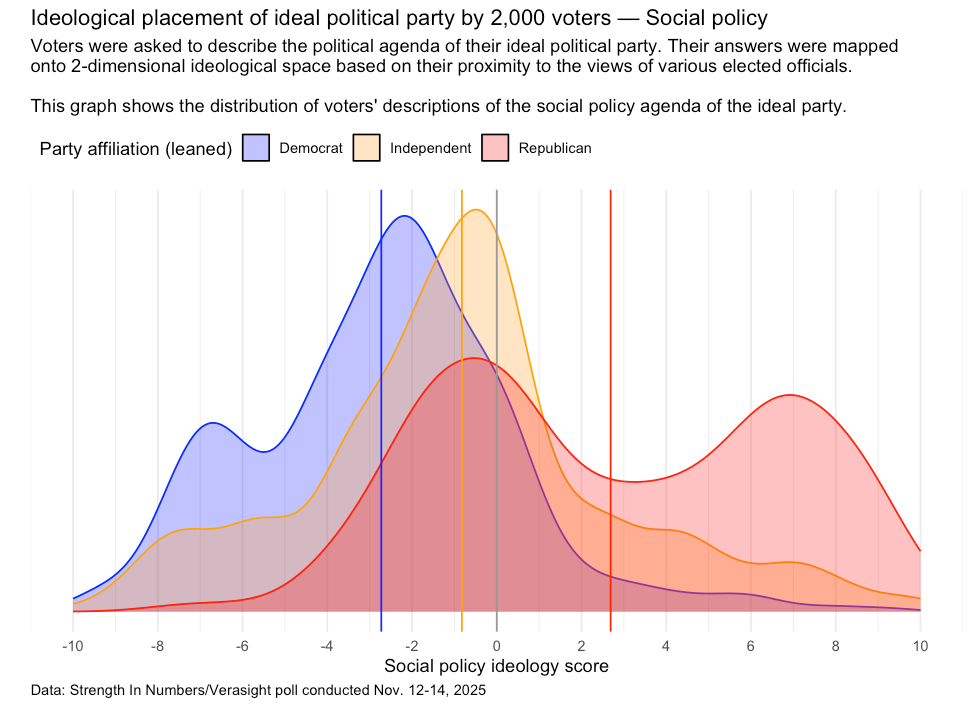
Now, here is the plot of voters according to way they LLM scored their mention of social policy:
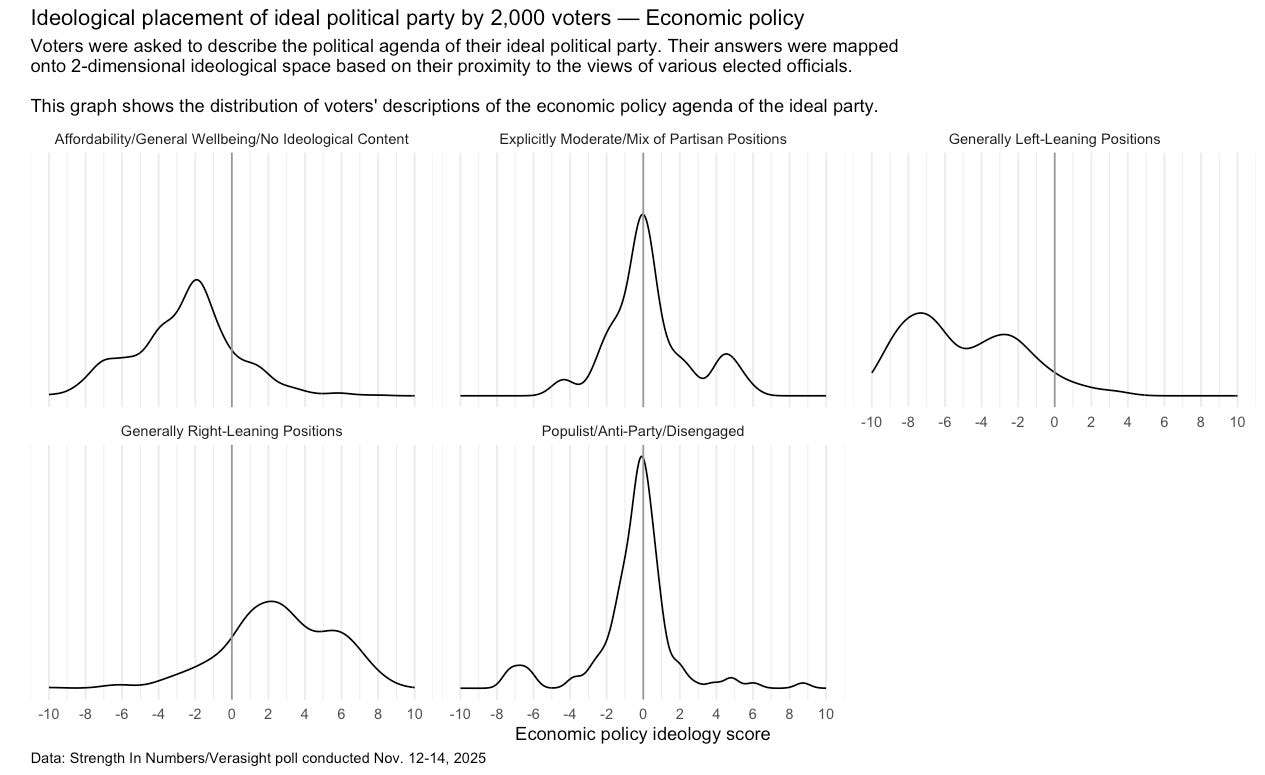
Finally, here is the way the LLM categorized the economic policy of voters’ ideal parties, broken down by my hand-categorized party buckets:
The clear takeaway from this initial analysis is that most voters imagine their ideal political party to be slightly left-leaning on both economic and social policy.
This is especially true for non-partisans and independents. Particularly on economic policy, respondents to our survey who either did not affiliate themselves with a political party OR whose surveys answers indicated their ideal party would prioritize affordability/general wellbeing over other ideological issues landed closer on the ideological spectrum to territory we typically associate with the Democratic Party than the Republican Party.
3. But most Americans don’t think about politics ideologically, & just care about material wellbeing
However, the above analysis overlooks the role of ideological thinking in the American political mind. Most voters are simply not that ideological, with the canonical estimates in political science indicating that at best 20-25% of the population thinks about political issues in ideological terms.
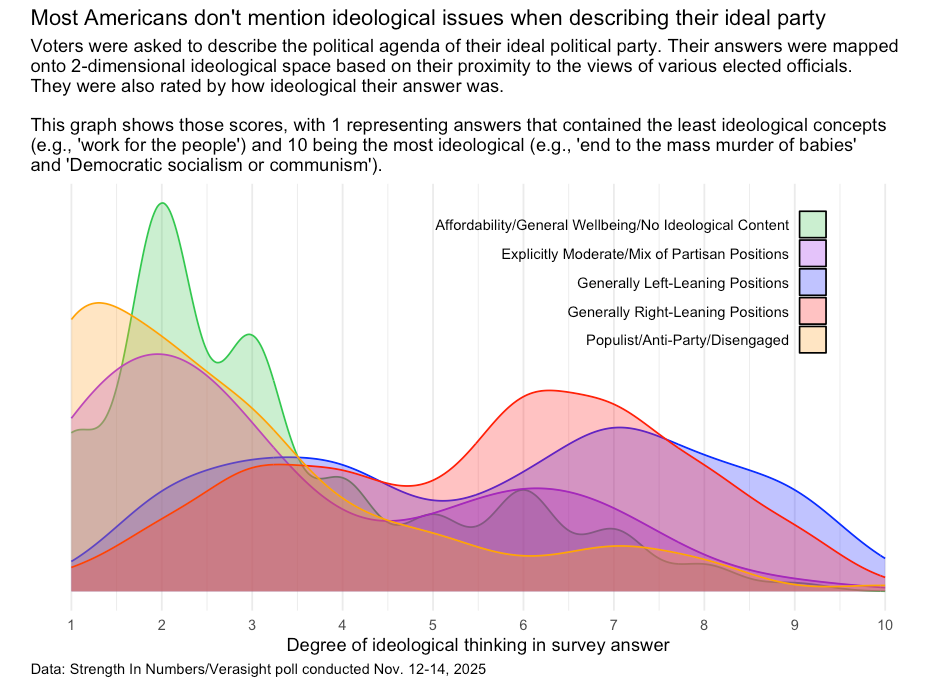
Our analysis affirms these findings from the academic literature. The chart below shows the distribution of our LLM’s scores for the “strength of ideology” of each person’s answer, broken down by the party group I assigned them by hand:
Note that the groups of voters I identified as citing non-ideological issues related to affordability and general wellbeing are also given low “strength of ideology” scores by the LLM. By and large, so are the populists and moderates.
In contrast, the Left-Leaning and Right-Leaning groups peak in the 6-7 range for strength of ideology, and some manage to rank very highly for the ideological coherence of their answers. Importantly, no voters in the affordability party rank above an 8 on the ideological scale.
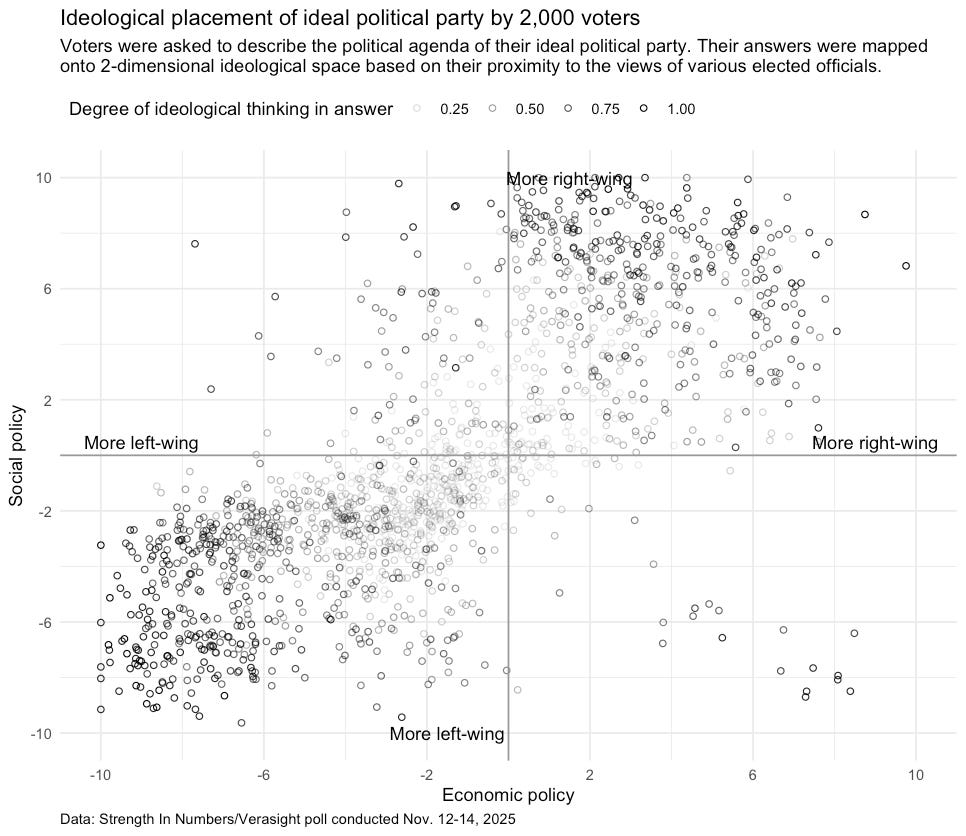
We can also return to our original left-right placement of voters, but this time draw weaker circles for those respondents who do not mention ideological topics when describing their ideal political party. In the plot below, the darker a dot (voter) is, the more ideological their answer was:
And we can add the color back to that plot, too:
Note that once you fade out respondents with low ideological strength, the center of the chart hollows out significantly. Remember this, it will be important for the discussion at the end of this piece.
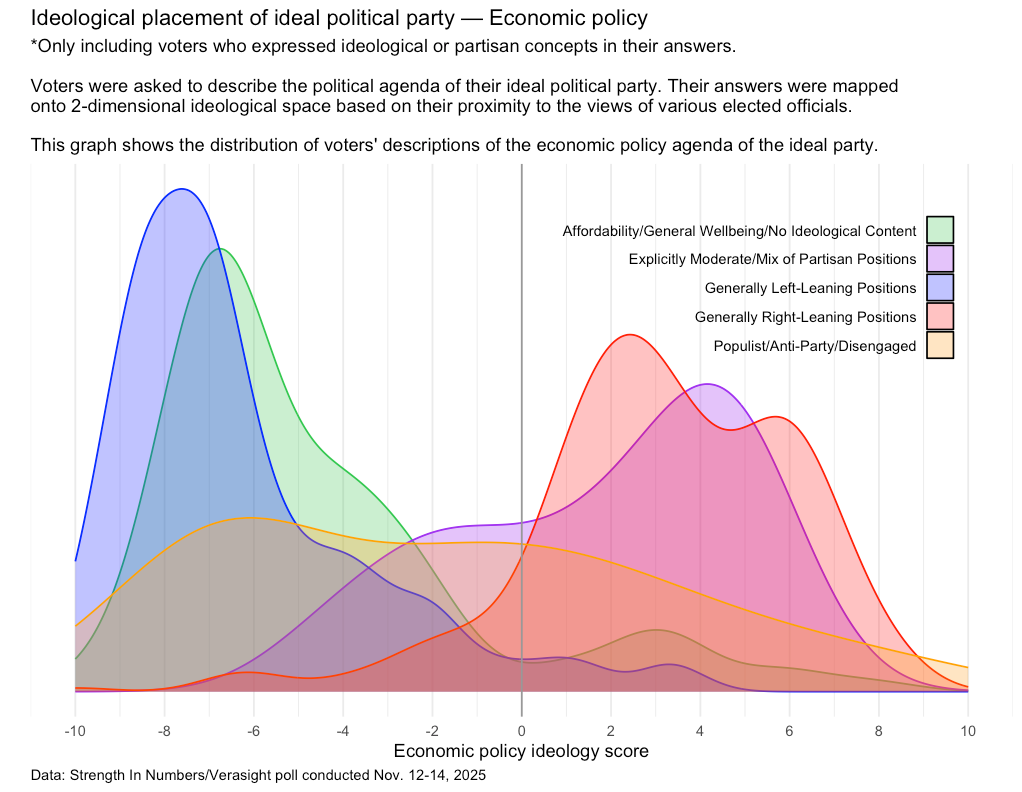
Finally, we can consider the differences between the following plot showing distribution of economic policy scores only among voters who express lots of ideological concepts in their text answer to us…
… and this plot showing the distributions of economic ideology scores for the voters who express little or no ideological concepts in their text answers to our survey question:
For a quick quantitative analysis, consider that the clearly left- and right-leaning parties score much higher in terms of the ideological content expressed in respondents’ answers:
Populist/Anti-Party/Disengaged: 2.07 average ideology strength (out of 10)
Affordability/General Wellbeing/No Ideological Content: 2.90
Explicitly Moderate/Mix of Partisan Positions: 2.89
Generally Left-Leaning Positions: 5.96
Generally Right-Leaning Positions: 5.97
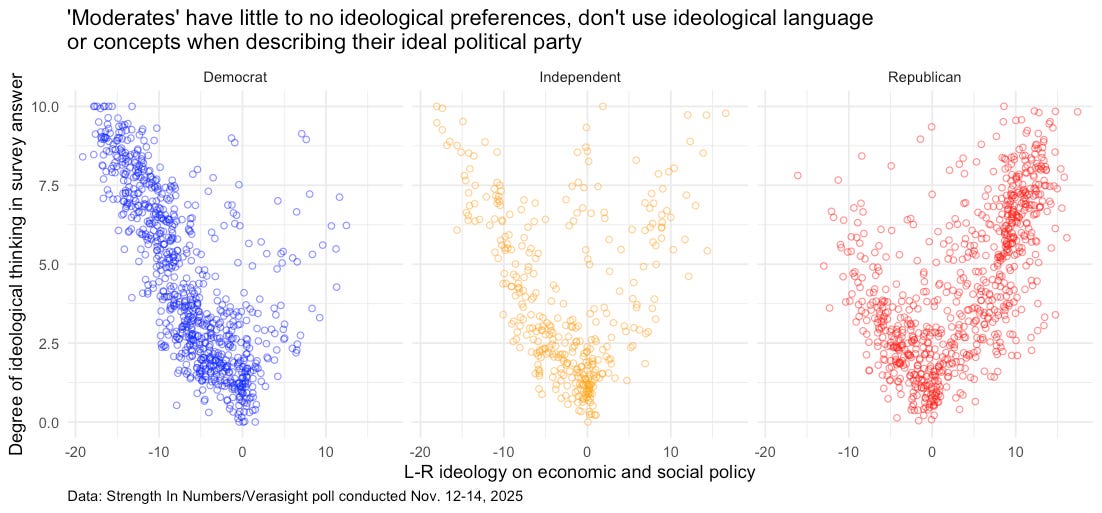
Or, if you prefer the traditional partisan buckets, see the chart below that shows the combined left-right ideology scores for Democrats, Republicans, and Independents by each person’s LLM-rated “strength of ideology” score:
The above chart shows that voters who don’t use ideological language when describing what they want their ideal political party to stand for (dots lower on the graph) appear as more “moderate” because they have ideology scores closer to 0.
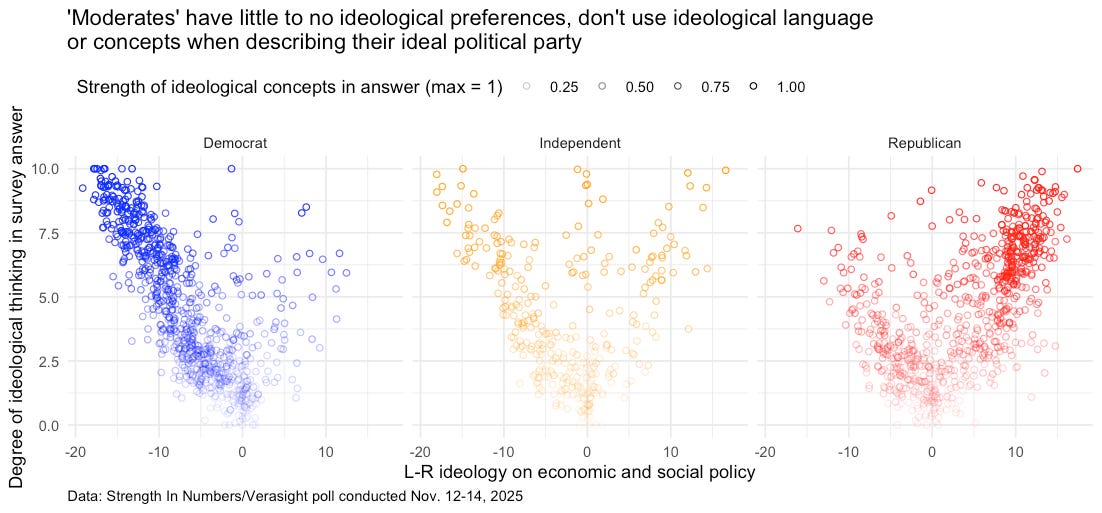
But again, this is just an illusion created by the fact that these people give us no ideological answers to analyze! They get ideological scores close to 0 because 0 is the default, not because they expressed moderate views. If we scale the transparency of points by the ideological coherence of each voter, notice how the voters near the bottom of the chart start to disappear:
The only moderates that are left are the respondents at the points y = 10, x = 0 — representing voters who expressly voice support for moderate politics or take positions on both the left and right of the political spectrum.
What this added visual transparency does is cue you that the points toward the middle of the graph are also uncertain points — the analysis technique has placed voters there explicitly because they did not use ideological language in their response, so they get 0s on economic and social policy.
These voters are not ideological moderates, but instead are more like ideologically empty voters.
Why this matters
The addition of the concept of “strength of ideology” to our analysis of voters’ liberalism/conservatism forces us to reckon with the fact that many voters have a surprising lack of ideological concepts in their minds.
To summarize the main finding from this article: most voters that appear as “moderate” on the normal two-dimensional, economic-social ideological plane are actually non-ideologues — they are being forced onto the ideological spectrum because of biased analytical techniques, but do not actually belong there if the question being answered is “What political party would this person vote for?”.
It is easy to see how this bias crops up when you consider how other survey analysis of voter ideology is conducted. When a researcher asks voters 20 questions about a mixture of economic and social policies, and force them to answer those questions in favor of liberal or conservative issue positions, they end up putting voters into an ideological box related to those issue positions. Most so-called “moderates” get placed in the middle of the Democrats and Republicans because they are forced to pick positions on issues they otherwise do not care about.
Our analysis allows moderates to escape this forced ideological categorization by adding an additional axis of “ideology” — that of non-ideology.
As mentioned, this is not a surprise; decades of political science research has found that most voters are not ideological Additionally, as the salience of affordability and inflation have risen in recent years, it is not a wonder why voters have prioritized issues that are not clearly on the left or the right of the political spectrum. This needs to be taken into account when creating our mental models of voters. Not everyone sits squarely somewhere on the ideological spectrum. Some voters exist off it entirely.
If you have been stuck in the left-right/economic-social ideological world that elites and party strategists operate in, this analysis offers you a path to a more accurate prediction of voter behavior and party persuasion. Our findings suggest the way parties approach “moderate” voters need not actually be ideologically moderate. Instead, party can enjoy much success focusing on the issues these voters care about.
The chart below shows that so-called “moderate” voters use very little ideological context when rationalizing about politics today. Instead of thinking about how the Democrats can save SNAP and pass Medicare For All, or how Donald Trump and the Republicans are deporting thousands of immigrants, most voters are are thinking about issues that are close to them — like the cost of living, and how the system has failed them.
Elite Democrats are currently stuck in a debate about whether to address their loss in 2024 by running to the left to increase turnout, or publicly shifting major issue positions to the center to win more “moderates” (an imprecise strategy that is unlikely to move the needle).
My survey analysts suggests there is a pressure-relief valve for ideological conflict, an escape hatch from this tiresome debate — a way out of the trap of ideological thinking that blinds strategists to better solutions.
That escape is a third strategy — not left, not right — that exists on another axis of ideological conflict in America today. That axis is non-ideology and general wellbeing: There is a great mass of voters today who don’t care about left vs right (or left vs center), and just want politicians to care about them and improve their lives.
My bet is this: The party that wins the non-ideological, affordability-minded voters will win the next election.
Footnotes
Full LLM system prompt given to OpenAI’s GPT 5.1:
“You are now a political scientist/survey scientist. Think very hard about your answer.
I am going to give you a text response to a survey question I asked a sample of American adults.
The question I asked was: ‘In a few words, what would your ideal political party argue for or believe in?’
Your job is threefold. First, I want you to identify the major political issues and values mentioned in the response. If there are multiple issues or values mentioned, separate them with a comma.
Second, I want you to place the party the person described on the two-axis economic/social left-right political spectrum, in the American context. Give the party a rating from -10 to 10 for how left-right it is on each axis, where 0 represents a party in the middle.
Third, I want you to rate the strength of ideology in a person’s response on a scale from 1 to 10.
Think hard about where the answer fits in the context of ideology in America today. The political right generally stands for limited government, lower taxes, a free-market economy, a strong national defense, stricter immigration enforcement, socially conservative positions on issues like abortion and gender/sexuality, and an emphasis on individual responsibility, traditional values, and states’ rights within the U.S. federal system.
The political left, in contrast, stands for a more active federal government to address social and economic inequality, progressive taxation, stronger social safety-net programs (like healthcare and welfare), protections for civil rights and liberties (including for racial, ethnic, LGBTQ+, and other minority groups), environmental regulation and climate action, more permissive immigration policies, and generally more progressive positions on social issues such as abortion rights and gender/sexuality.
The political right has values of individualism, limited government, traditional social norms, a free market, and national sovereignty and security.
The political left has values of equality and social justice, economic security and welfare, collective responsibility, progressive social change, and regulations for the common good.
If people say something like ‘helping the people’ or imply an agenda of economic equality, you should put them in the left economically and center/center-left socially.
If people say something like ‘serve American citizens not immigrants’ or suggest out-group animosity at minorities, you should put them on the right socially.
For example, for the response
‘Pro-life, border control, defund UN & WHO, control inflation, address predictable Social Security & Medicare funding crises.’
You should return the issue labels:
‘abortion, immigration, foreign relations, economy, social security, medicare’
And you should put them in the left economically (they are in favor of entitlement spending) and on the right socially. They would get an economic score of around -2 and a social score of around 8.
And for the response
‘More help for working class families. Raise taxes on the wealthy. Help LGBTQ and immigrants’
You would return a strong negative economic and social score, because of the endorsement of redistributive tax policies and helping liberal minority groups.
And, for the response ‘my ideal political party would be only for the people’, you should give a low strength of ideology score.
Try to avoid putting people at exactly 0,0 unless they truly state no preference. Most people have an ideology.
Please explain your thinking for each analysis. Return your answer in the form:
Issues: {list}
Economic axis: {integer}
Social axis: {integer}
Strength of ideology: {integer}
Reasoning: {text}
”



These findings remind me a lot of what we have learned from More in Common’s polling as well - our partisan focus obscures there’s a lot that people are united around than we often realise.
This is fantastic analysis. How to get this in front of the people having this debate for the dem party??