The Senators who beat expectations; + a FAQ about WAR/WARP
Our estimate of the Wins Above Replacement for U.S. Senators as of 2024
Today, Strength in Numbers is releasing our 2024 Senate estimates for Wins Above Replacement (WAR) and Wins Above Replacement in terms of Probability (WARP). We use the same open-source model that was used to generate our 2024 House WAR/P estimates. We won’t re-hash the methodology here, but as a quick refresher:
WAR is a measure of how much better or worse a candidate for office performs, in terms of vote margin, compared to a hypothetical “replacement-level” candidate from the same party, for the same seat.
WARP measures how much a candidate changes their party’s probability of winning a seat, relative to that same hypothetical alternative.
The full Senate results are listed below, along with the House results for the convenience of having all our WAR/P estimates in one location. Additionally, we’ve appended this article with answers to common questions that were asked after we released the house results.
Senate WAR/P
House WAR/P
FAQs About WAR/P
We’ve gotten some questions about our WAR model. We answer them below. (The rest of this article, including the footnotes, was written by Mark).
How does Mariannette Miller-Meeks, the republican representative who barely won Iowa’s first congressional district, end up with a positive WAR when Trump carried her district by 9 points?
We’ve gotten a flavor of this question over the past few weeks for candidates with WAR estimates that diverge from their performance relative to the presidential results. We walk through our methodology in the house WAR/P announcement article, but it’s probably also helpful to walk through how we arrive at a particular result, using Miller-Meeks as an illustrative example.
In short, our model makes two predictions in every race. It first predicts the results of the election with the actual candidate on the ballot, then predicts what the results would be if the candidate were swapped with a hypothetical alternative. A candidate’s WAR is then the difference between these two predictions.
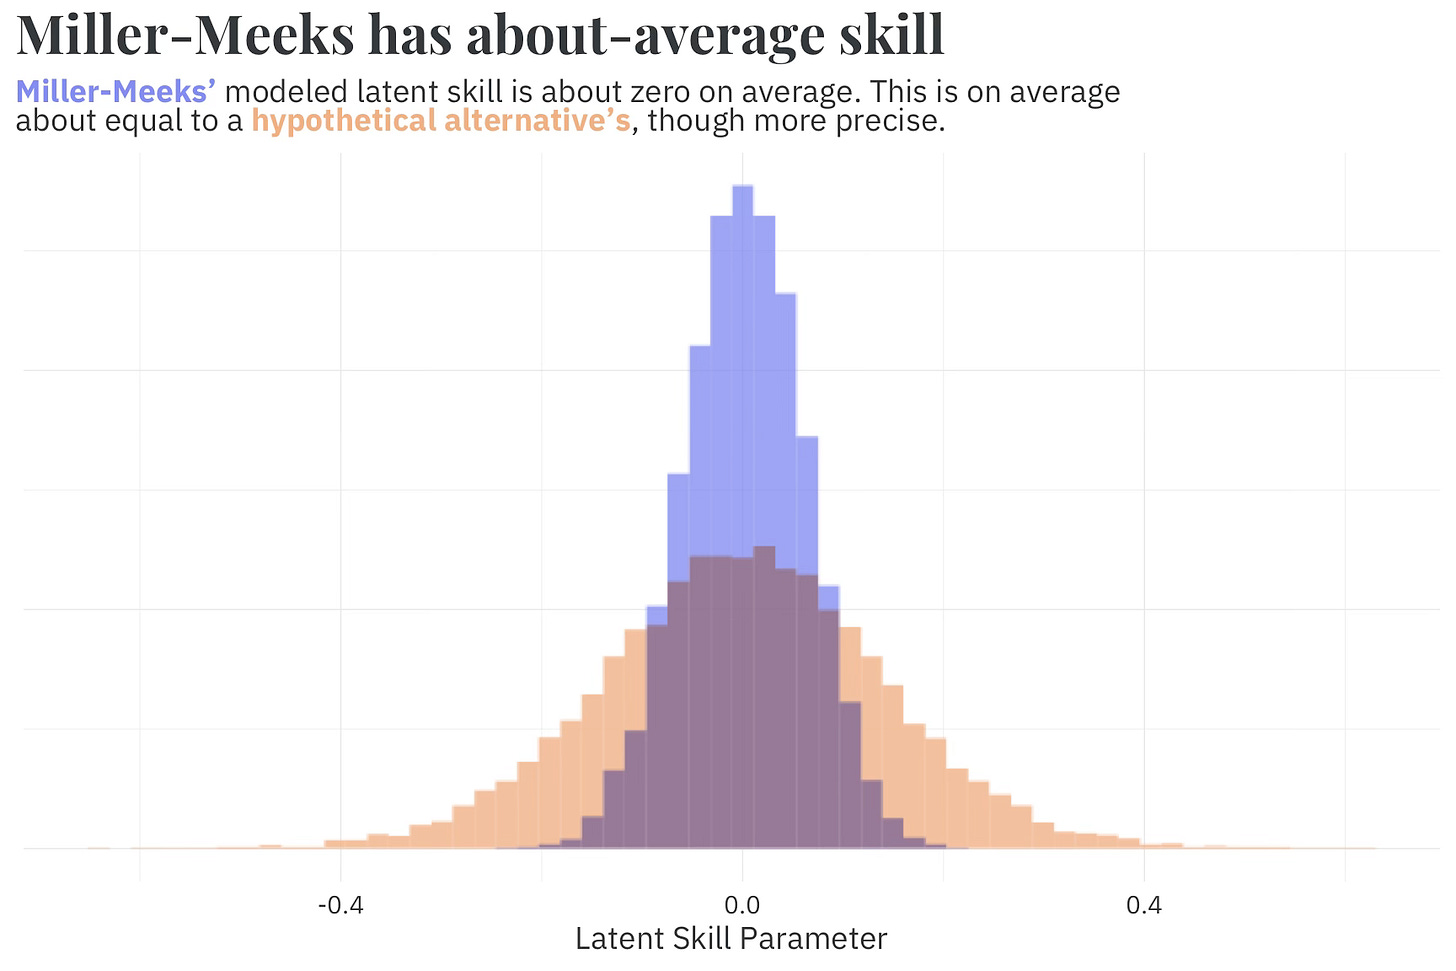
Per our model, the estimated result (in terms of margin) in IA-01 with Miller-Meeks on the ballot is R+4 +/- 8%. Miller-Meeks’ modeled candidate skill is about zero, on average,1 meaning that any difference between her predicted value and that of the hypothetical replacement is due to incumbency, experience, and fundraising.
Hypothetical alternatives are non-incumbents who likely do not have an experience advantage against their opponent and tend to fundraise less than incumbents. The benefits of incumbency, experience, and fundraising have shrunk over the years as everything has come to be dominated by partisanship, but it isn’t 0! If we simulate a hypothetical alternative for Miller-Meeks who is a non-incumbent, likely doesn’t have an experience advantage against her democratic opponent, Christina Bohannan, and likely fundraises less, the predicted result shifts in the democrats’ favor to R+2 +/- 14%. Taking the difference gives us an estimate for Miller-Meeks’ WAR of +2 +/- 15%.
Wait — you use the difference in predictions? Why don’t you just compare the actual result to the model’s result?
The straightforward answer is that our model is a predictive model, so we only use predictor variables that are available before election day (the model is still trained on election results, as the dependent variable).
Another reason we don’t use this comparison to calculate WAR/P is that doing so would confuse candidate quality with model quality.
Say, for example, we make some changes to the model and its predictions more closely match the actual election results. If WAR is the difference between the actual results and the model’s results, then every candidate’s WAR moves closer to zero in this improved model. In the extreme case, where we build a model that perfectly matches the results,2 this perfect model would give every candidate a WAR of zero, which I don’t think is realistic! This only occurs because this calculation is answering a different question: “what is my model’s error term?”
Taking the difference in potential outcomes3 instead answers the question we’re interested in: “how much does this candidate help (or hurt) relative to a hypothetical alternative?” In the event we build a perfectly predictive model, the potential outcomes approach would still let us estimate each candidate’s WAR (it would just be more precise), since this method actually measures our quantity of interest independent of model error, rather than mistaking model error for candidate value.
To be sure, there is some utility in comparing actual election results to the model’s estimated results. We do this to evaluate the quality of our model at predicting elections, for example. But we think a comparison of predicted and actual results is not the right way to calculate WAR itself.
So it sounds like you don’t use the 2024 presidential results in each district in your WAR estimate? Why not?
That’s right, we don’t use the 2024 presidential results to calculate each candidate’s WAR. As stated above, since this is a predictive model, we only make use of variables known prior to seeing the results. This lets us make predictions about future candidates, which should be more valuable to campaigns and prognosticators; what use is a model that only tells us who’s a skilled candidate after they run?
Additionally, because WAR is the difference between two estimated values, no WAR calculation currently available uses the 2024 presidential results as the baseline for comparison.4
By way of example, let’s look at Split Ticket’s model, which uses the difference between the House result and the presidential result in each district as the dependent variable in their regression.5 They use a slightly different definition for WAR, though it still takes the difference between two values — they estimate WAR as the difference between the actual result (in terms of their dependent variable) and the predicted result in each district. Since their dependent variable is the difference between the House and presidential results, however, subtracting one value from the other fully removes the presidential results from the equation.6
Even if you’re not looking at the “difference in differences,”7 just comparing the presidential results to the district results doesn’t answer a question that WAR is interested in. We want to use WAR to estimate how much a candidate improves their party’s chances relative to a hypothetical replacement. But Harris and Trump were not running as House or Senate candidates!
That’s the big reason we don’t use the 2024 presidential results as the dependent variable in our WAR model. We want our model to predict House results, not whether running Harris as a House candidate would have been worse than running an actual House candidate.
Alright, I see why you don’t use the presidential result when calculating WAR. But shouldn’t you use it as a predictor in your regression?
You definitely could use the district’s presidential results as a predictor!8 When you do this, however, you lose the benefit of being able to estimate WAR/P in a predictive capacity. We think that dropping this variable is a worthwhile tradeoff for the predictive model. And as we’ll explain in a moment, we’ve designed the model to be robust to the specific set of predictors used.
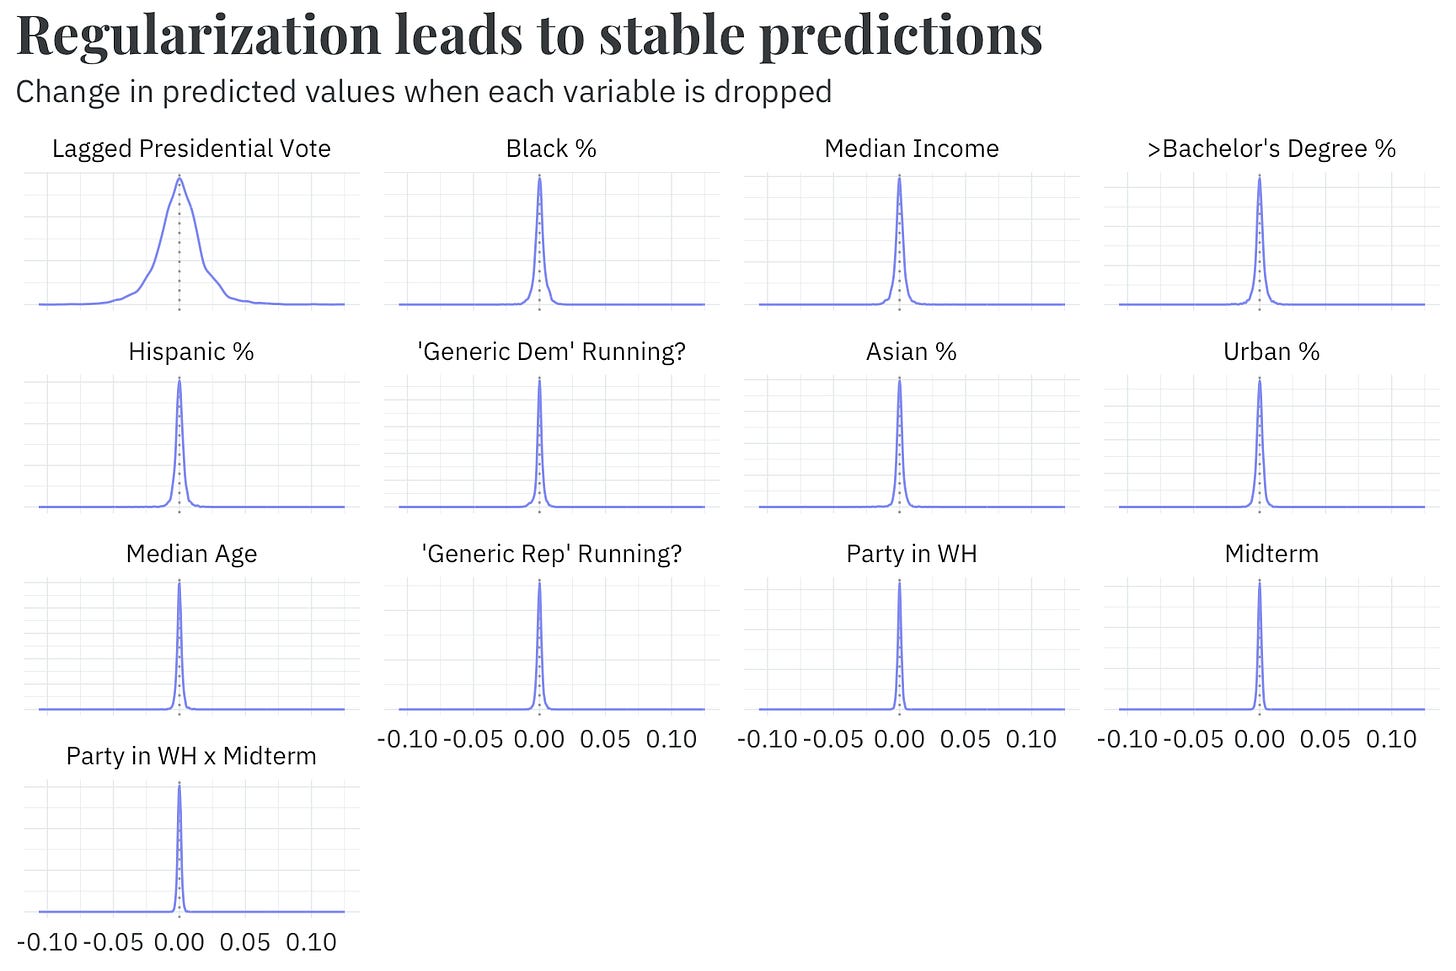
Our model is, to use the statistical lingo, overspecified — we use a large number of variables relative to the size of the dataset.9 To guard against overfitting — wherein the model “memorizes” the training data but cannot generalize to new data — we use regularization, a technique that shrinks the estimates for uninformative predictors towards zero.10 Without regularizing the model, we would either have had to drastically reduce the number of variables included or simply use an overfit model. Either choice likely leads to a poorer predictive model.
The benefit of regularization is that it allows our model to maintain good predictive performance regardless of whether or not we drop or include an extra variable. As a thought exercise, I’ve written a quick analysis that refits the model many times over — each time dropping one variable. In each fit, our model’s overall quality (in terms of RMSE) remains about the same as the full model that includes all variables (about 0.026). Similarly, the predicted outcomes don’t change too much. Even if we drop the most influential variable, lagged presidential vote, 95% of predictions are within 3.5% of the full model’s predictions.
If anyone shows you a perfect model with zero error, it’s likely that they’ve coded a bug somewhere.
To be clear, this refers to using the 2024 presidential results in a WAR calculation after having fit a regression. Others use the 2024 presidential results as predictors in their regressions (and we explain why we don't later in this article).
I bring this up because several people online have pointed to Split Ticket as an example of comparing district and presidential results to calculate WAR
To be clear, I don’t mean this as a slight against the folks over at Split Ticket (I don’t want to start any more WAR wars). I am just using them as an example to show that, by construction, any estimate of WAR that takes the difference between two regression results necessarily removes the presidential results.
Economists, don’t be mad at me.
And, to be fair, this is what Split Ticket does, via swing (i.e., ’24 presidential results minus ’20 presidential results).
We also let many variables vary over time, which effectively multiplies the number of parameters in our model by the number of election cycles in the dataset.
Specifically, we implement a variant of Bayesian regularization described by Lauderdale and Linzer (2015).


I hit the wrong button and published this a day early. Oh well, there you go!
You seem to think that WAR and WARP are immediately understandable terms. I looked at the "methodology" and it's not any clearer.
I can't be the only one who thinks this.
I'm a new subscriber so perhaps you've covered this in depth previously.