


Every month, our Strength In Numbers/Verasight poll is weighted so that the people responding match demographic targets from the Census Bureau (on things like age, race, metropolitan status, and education) and partisan targets from two sources. One is the results of the 2024 election (something polling nerds call “weighting by past vote”), which provides a target for both (a) how many adults are voters and (b) among those voters, how many are Democrats, Republicans or independents. The other is a running three-year average of the party identification distributions from Pew Research Center’s National Public Opinion Reference Survey, or NPORS — one of the highest-quality surveys of U.S. adults that also has a very high response rate. As the name suggests, pollsters use the NPORS as a reference point for what the partisan makeup of the country actually looks like. (More on NPORS here from last week.)
My agreement with Verasight (a smart, mixed-mode pollster that does all my polling) is that they get to make all the methodological decisions for our poll while Strength In Numbers drafts question wording and response options. This firewall between editorial and the data-generating process behind the poll is intended to shore up public trust in my reporting; I literally can’t tilt the poll methodology to give me numbers that are more convenient to publish.
But all weighting choices generate a certain amount of uncertainty for polls, and I want to be transparent with readers about how the conventional approach to weighting by party identification could be shaping polling results. This affects poll results for every firm that weights by party ID.
The big question is this: Who counts as a Democrat, Republican, and independent?
There are several ways to answer this question, and each has an impact on a pollster’s results. As we’ll see, Verasight’s data actually fares very well on sensitivity to weighting choices — much better, by comparison, to some other non-probability data collected before the 2024 election.

This post is part of The Data Lab, a new section of Strength In Numbers for extra charts, general polling wonkery, and methods work that doesn’t fit into the normal editorial vertical. If you’re the type of person who wants to know how our polling is done or reads election forecasting methodologies, the Data Lab is for you.
Emails for posts on the Data Lab vertical are off by default, but you can easily toggle them on here. If you have a post to contribute to the Data Lab, email me.
Most Data Lab posts are free, but the occasional deeper ones are for paying subscribers, whose support makes all of this possible.
What is the “right” way to measure party ID?
Pew presents its party ID shares from NPORS in the following graph:
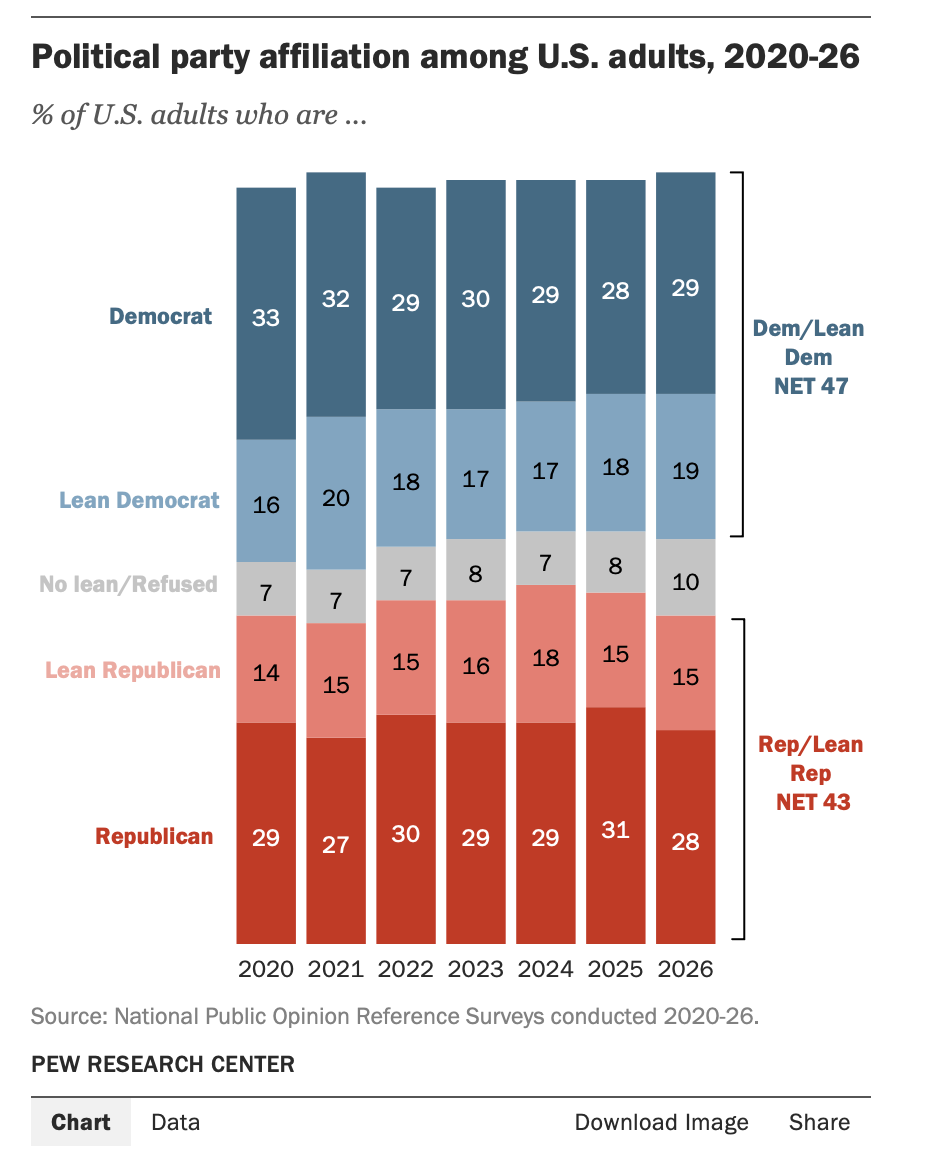
You could count up Democrats, Republicans, and independents in three ways using this data:
Count independents who say they “lean” toward one party as belonging to that party, and sum up party shares (47D, 43R, 10I). This is what Pew does.
Count independents who say they “lean” toward one party as independents (28R, 29D, 44I).
Treat “leaners” as their own group (29D, 19 Lean D, 10 I, 15 Lean R, 28R)
Currently, Verasight weights the Strength In Numbers data using the second methodology listed above, weighting to what I’ll call from now on “3-way party ID” instead of “leaned party ID”. There’s also “5-way party ID” (bullet three above).
So how would our results change if we weighted to leaned or 5-way party ID instead of 3-way? And how do our results change in 2026 if we update the weights from their 2025 to 2026 vintages? (That’s the question I had originally that set off this whole investigation.)
To answer these questions, I reverse-engineered Verasight’s weights for our published Strength In Numbers polling using its weighted demographic and partisan marginals. Then I updated those weights in three separate experimental polls to account for the three new party ID benchmarks. Fake poll A re-weights the published data to 3-way party ID per the 2026 NPORS alone — the same counting rule we use today, just the new vintage. Fake poll B re-weights to leaned party ID per the 2026 NPORS. And fake poll C re-weights to 5-way party ID in the 2026 NPORS. So the gap between the published line and fake poll A is the vintage decision, and the gaps among A, B, and C are the leaner decision.
To account for uncertainty in Pew’s party ID benchmark (their NPORS survey reports a margin of error of 1.8 percentage points in 2026), I repeated each experiment 500 times while randomly varying the party ID results used in the weighting program.
Our polling data, weighted four different ways
The chart below shows the generic congressional ballot among registered voters under each of the three experimental weighting models described above, compared to the average published result from May through July 2026.
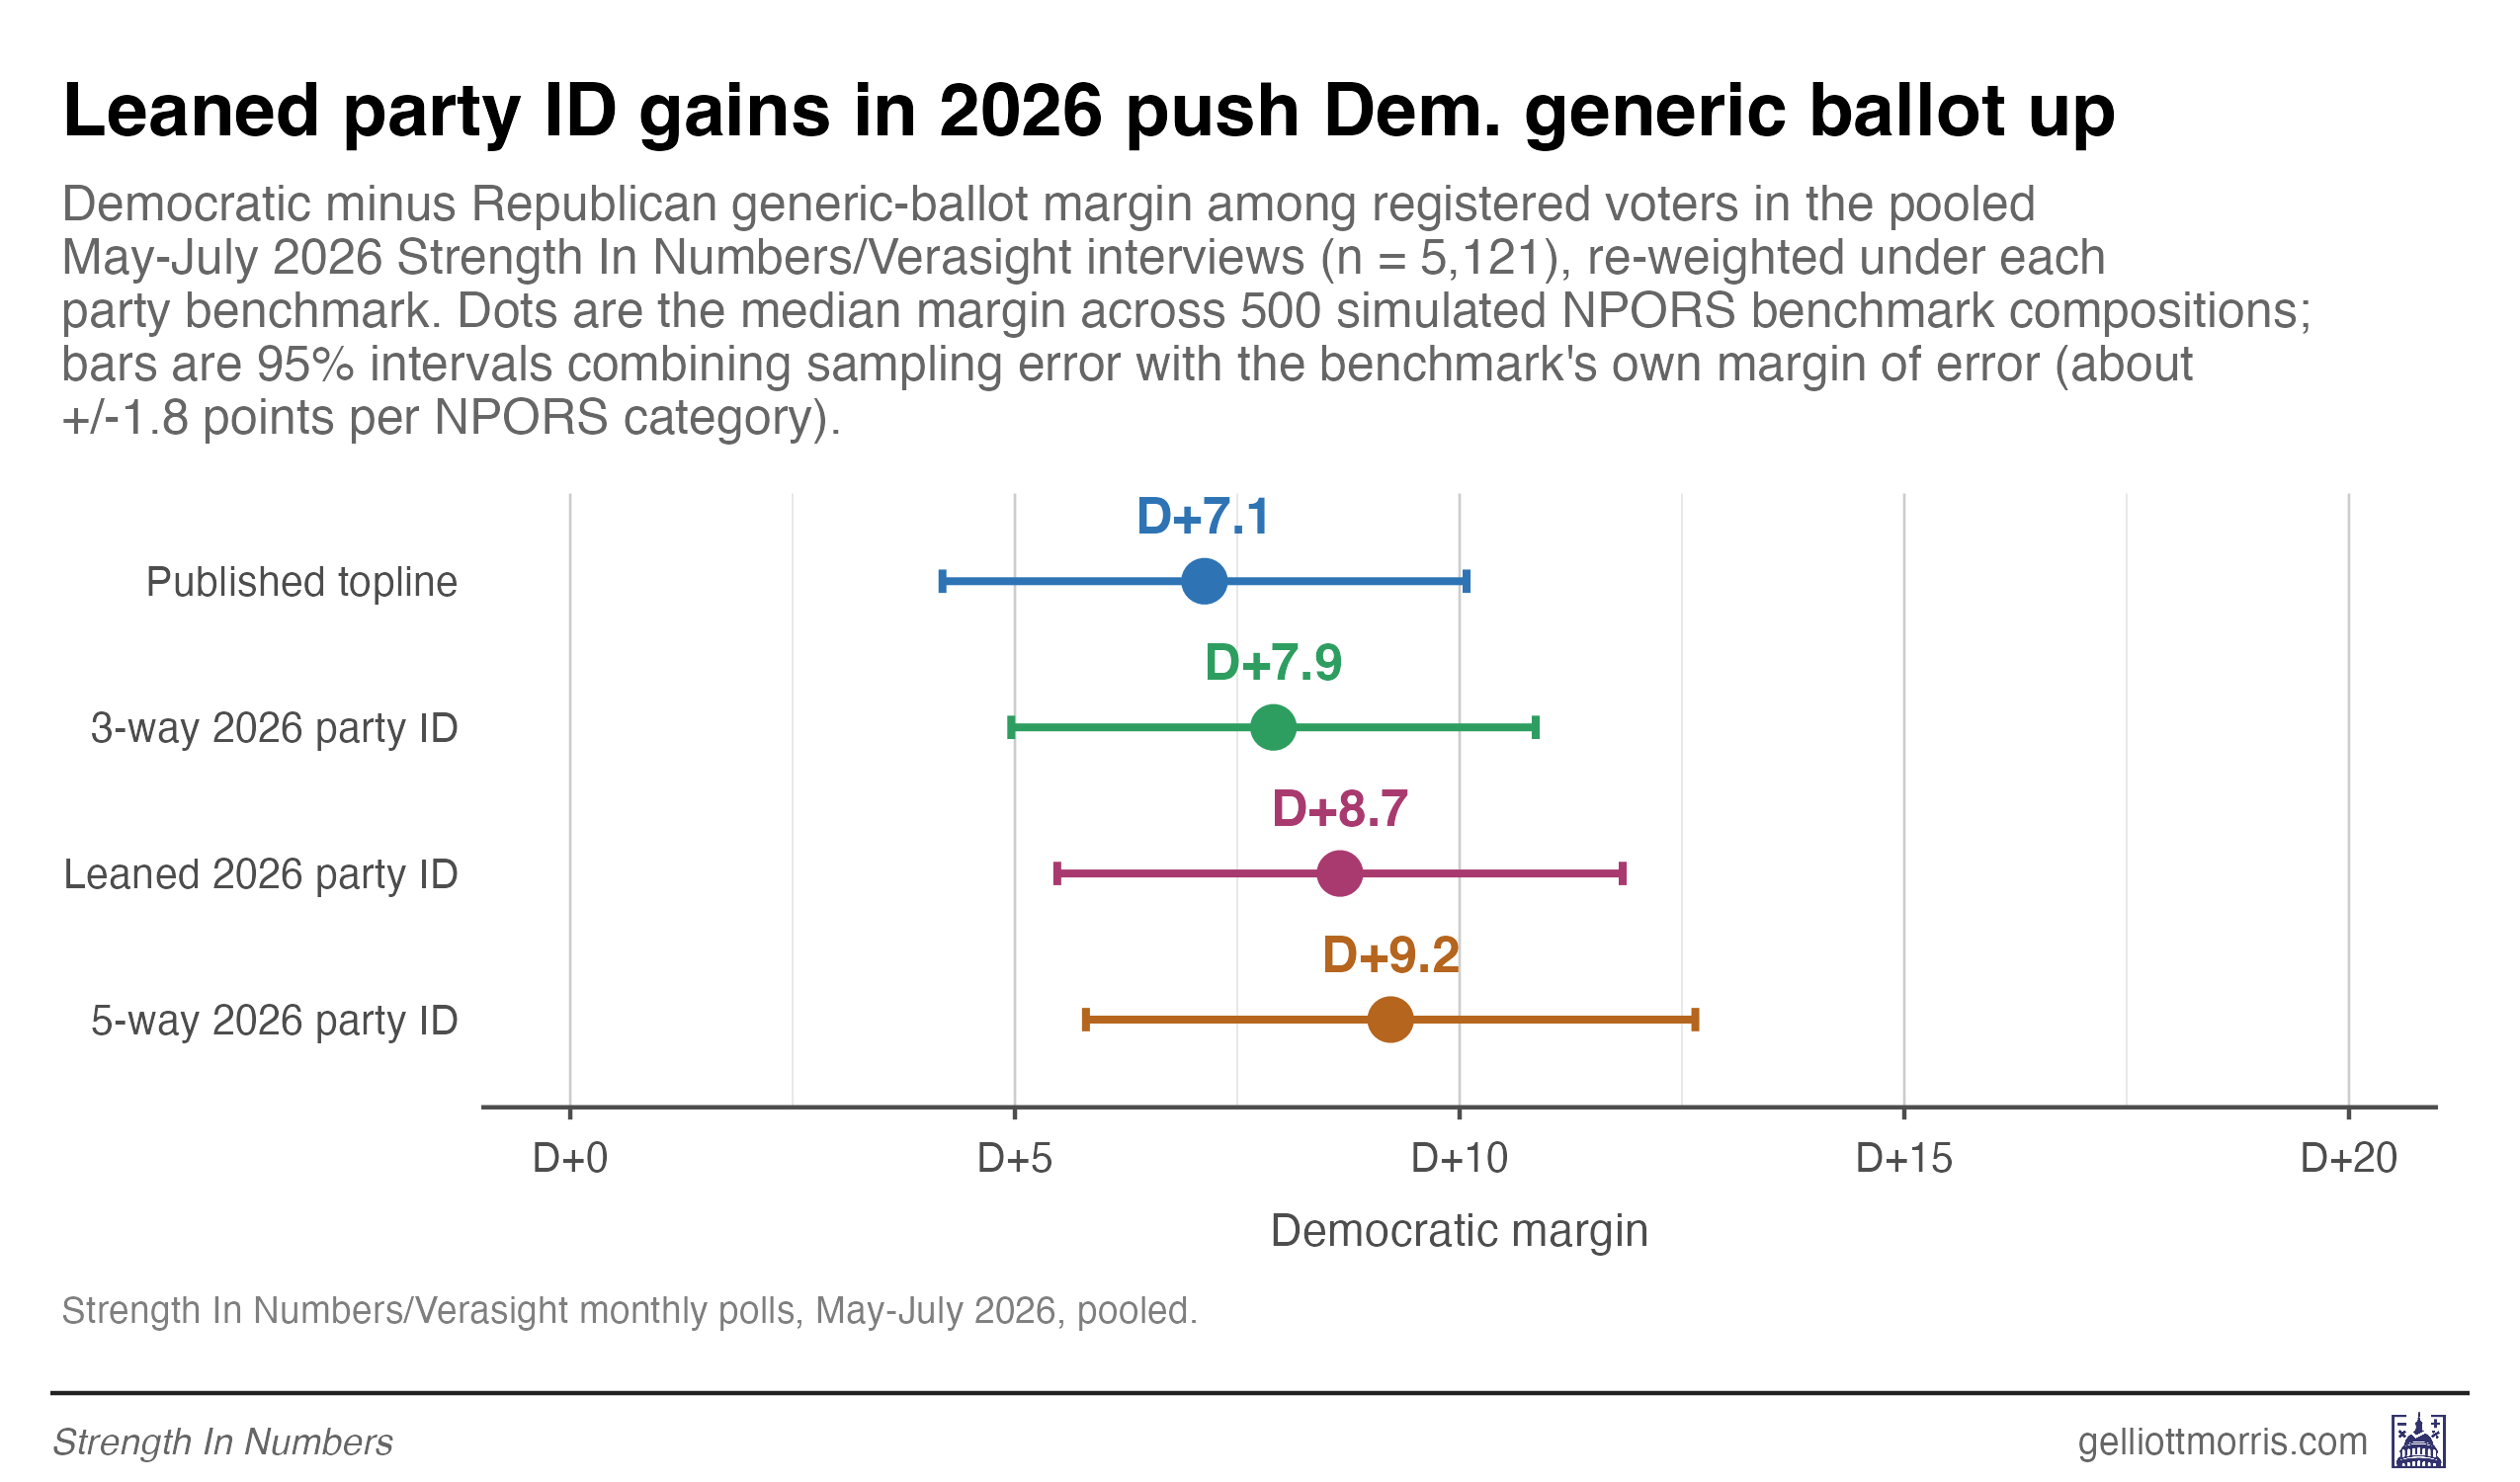
Here’s how I interpret this graph:
Baseline published result is D+7.1
NPORS shows an aggregate party ID margin of R+0.7 across 2023, 2024, and 2025 — the reference for our published result. Updating the 3-way party ID target alone to D+1 (fake poll A) lifts the generic ballot to D+7.9. The updated party ID targets are a no-brainer, so that’s a free +0.8 points for Democrats.
Taking independents who lean toward one party and putting them into their partisan group and weighting to that benchmark (47D, 43R, 10I) lifts Democrats’ margin further to +8.7.
If you balance your sample by 5-way party ID as well (pinning the leaner percent to Pew), the result rises again to D+9.2.
All told, the gap between our published number and the most aggressive party pin is about two points of margin.
For some added context, Trump’s July approval moves from 38%–59% to 37%–61% under the five-way pin, a net swing of two points against him.
To understand why the poll that’s weighted to 5-way party ID is so bullish on Democrats, it helps to understand how Pew’s NPORS party ID breakdown currently differs from the data Verasight sends Strength In Numbers. Under our current weighting approach, the July poll’s three-way split already matches NPORS to the decimal point — with about 30% Democrats, 31% Republicans, and 40% everything else.
But the political makeup of those independents varies a lot between the samples. According to Verasight’s July weighted estimates, 13% of U.S, adults are independents who lean toward Democrats, 10% are Republican leaners, and16% pure independents. Pew, by contrast, has far more leaners on both sides — 19% and 15% — and far fewer pure independents, at just 10%. Here’s a visual comparison:
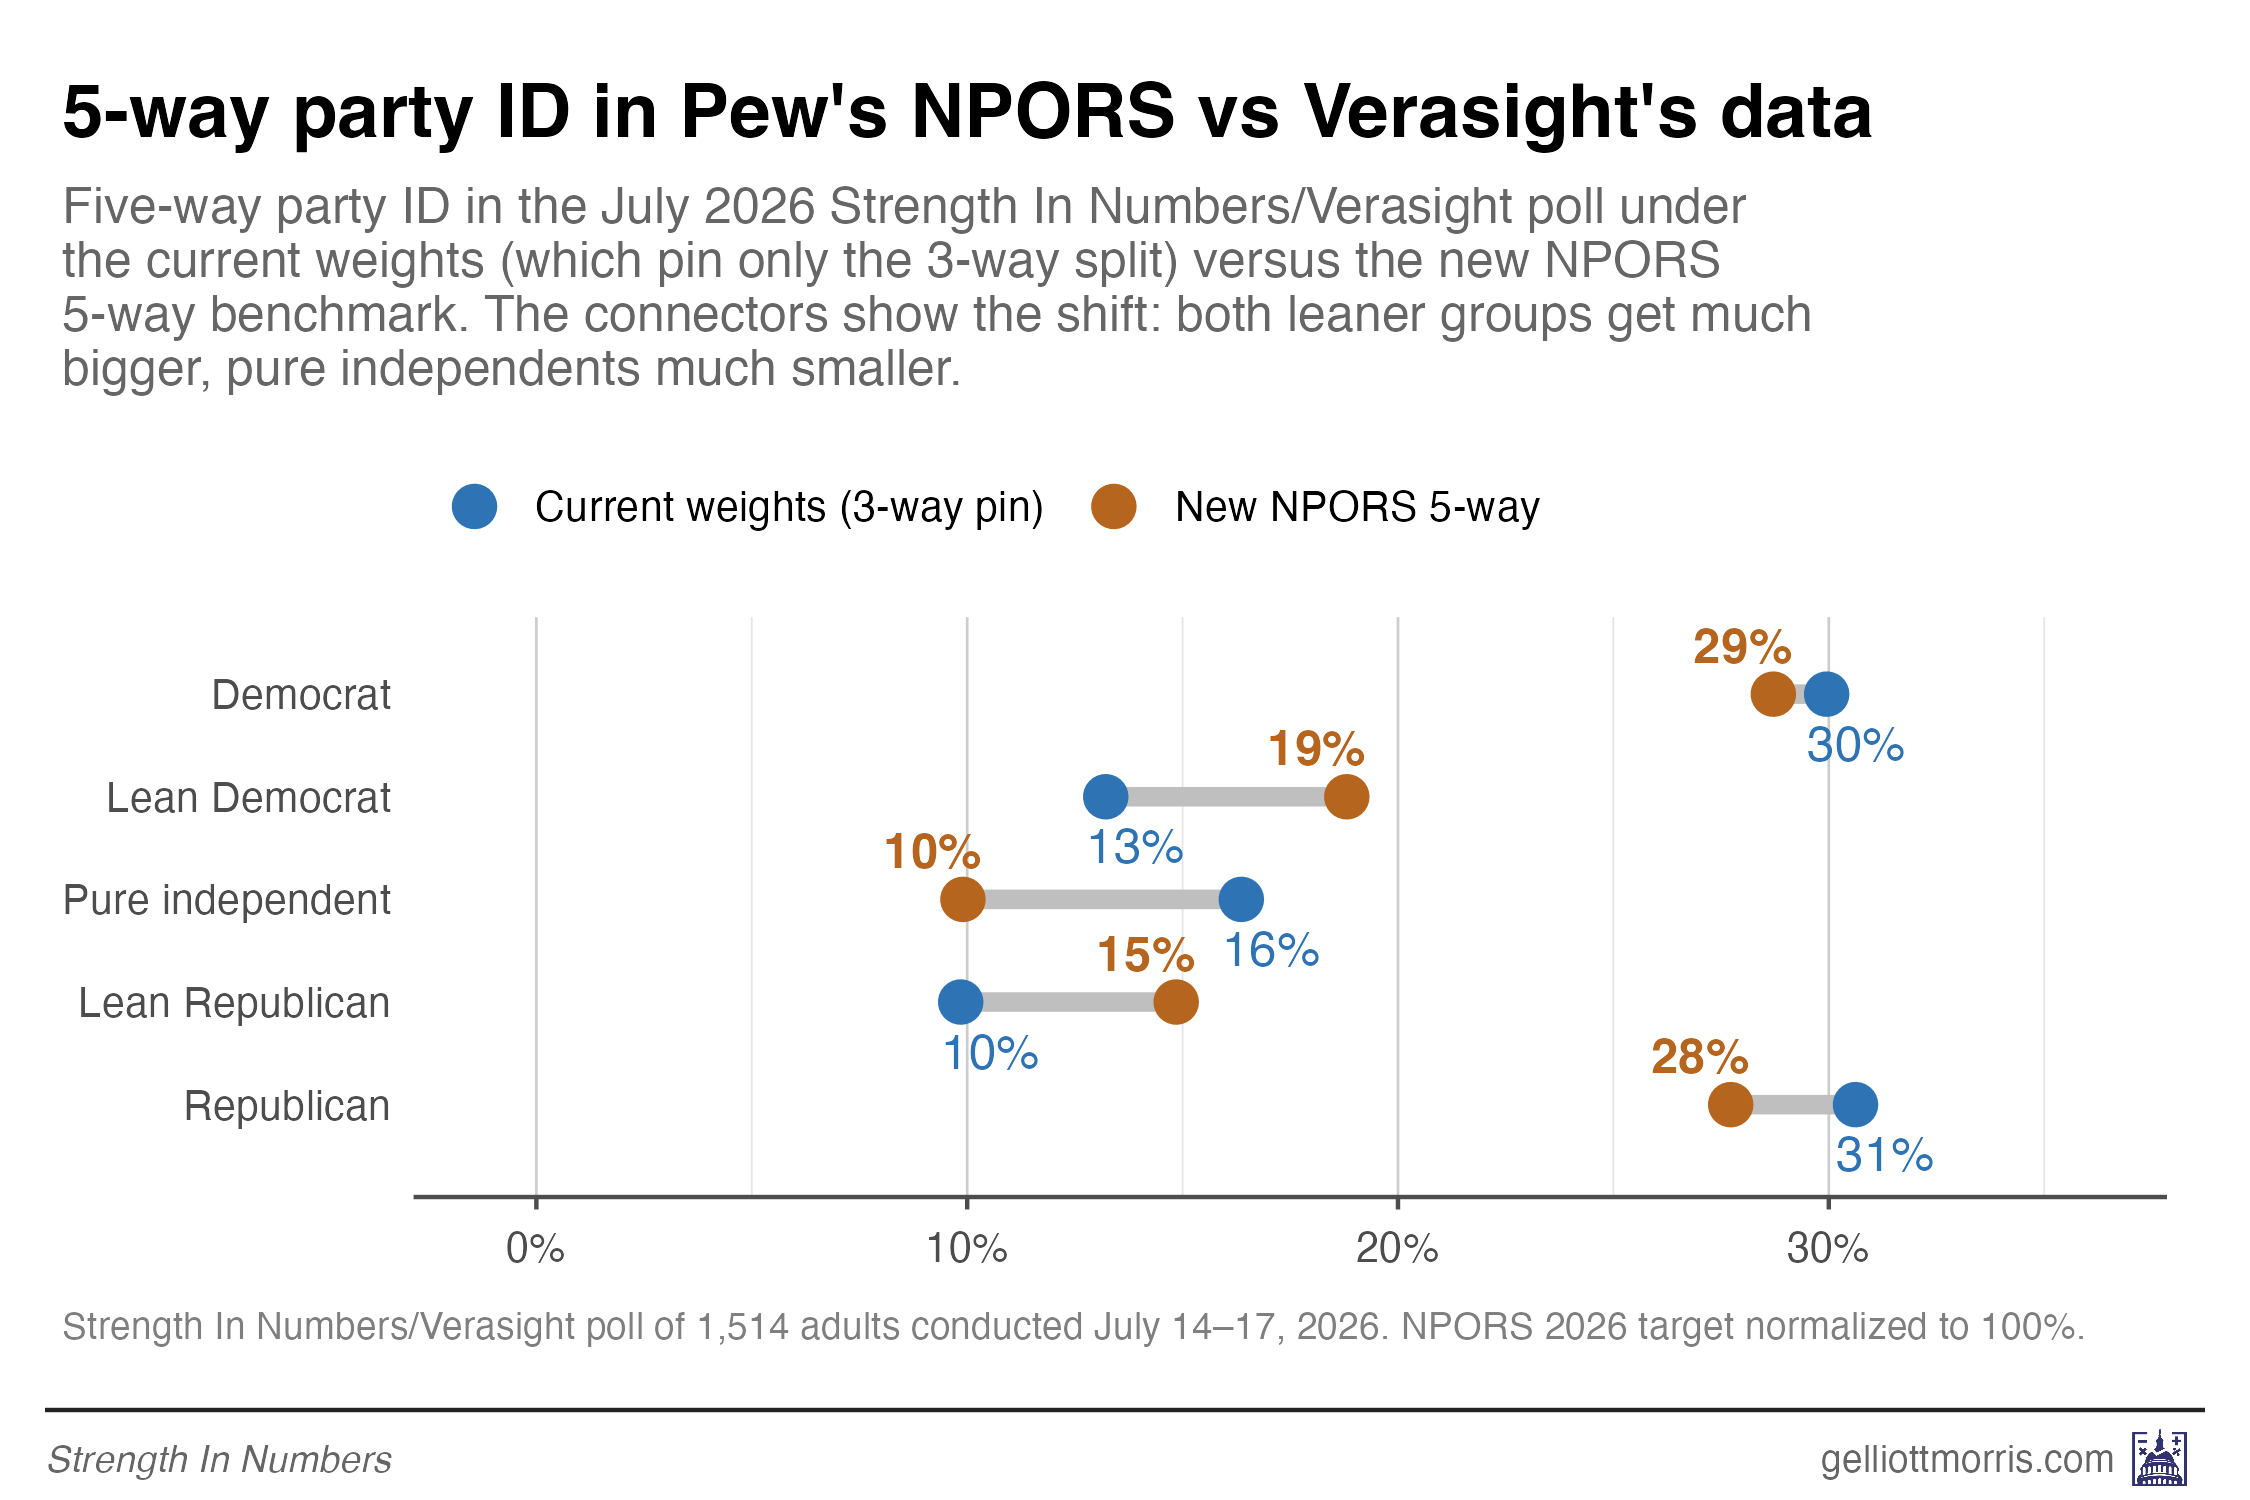
Weighting to the five-way benchmark upweights both leaner groups by roughly half and cuts the pure-independent share by a third. It also trims the party totals — about three points off the Republican share — because the 2026-only vintage comes along for the ride: a three-year average still carries 2024 and 2025, when Republicans were a bigger slice of adults. But the biggest change is the composition of the middle.
One question you might have, however, is why updating the party ID pin is only worth about ~2points on margin for Democrats, when Pew’s NPORS data shows the nation moving about 4 points left over the last year.
The reason is that the poll is also weighted by recalled 2024 vote, which provides another source of balancing by partisan attributes. So when the new party target pushes weight out of the Republican column and into the independent one, the weighting still has to produce a sample that voted Trump+1 in 2024. It makes up the difference by upweighting the Trump voters inside the newly enlarged independent bloc. The party pin gives; the 2024-vote pin takes most of it back.
We can prove it by deleting the 2024-vote pin and re-running fake poll A. Without that anchor, updating the party target to 2026 moves the pooled margin from D+7.1 to D+10.0 — a shift of nearly three points, right in line with the naive arithmetic. But it gets there by drifting the sample’s recalled 2024 vote from about Trump+1 to Harris+2, a 2024 electorate that technically never existed. That’s exactly the failure the vote pin exists to prevent. After the weighting model weights by both party ID and past vote, it’s left drifting up “just” to D+9.
However, the statistical cost is of all this weighting is real, if modest: the design effect of the weights (a measure of added variance from the underlying balancing model) rises from about 1.04 to about 1.15 in a typical wave, which trims the effective sample size of a 1,500-person poll by roughly 125 respondents — or, a widening of uncertainty intervals by about five percent.
And there’s the additional uncertainty from balancing by multiple groups simultaneously, as in the 5-way party ID pin. NPORS is a survey with its own margin of error; a proper margin of error for our survey should take into account that Pew’s estimate of 19% for “lean Democrat” really means somewhere between about 17% and 21% — and you can repeat that exercise for every slice of the target we’re weighting to.
As mentioned above, I account for this by randomly varying the party ID target I weight our Verasight data to by the amounts implied by Pew’s sample sizes for each party ID group. Each of 500 alternative NPORS distributions is fed into a computer program that re-weights the pooled poll to give a final margin of error that combines uncertainty from both surveys. This contributes a further 0.9 points of standard error to the five-way margin, about 0.7 to the leaned margin, and roughly 0.5 to either 3-way margin (which pin fewer categories with larger sample sizes). Adding the two in quadrature and doubling for a 95% interval gives a total margin of error of about ±2.9 points on the published and 3-way 2026 margins, ±3.2 on the leaned margin, and ±3.4 on the five-way margin.
The upshot is the more precise you are trying to be with your party ID weighting scheme, the more potential statistical error you are adding into your poll.
Does weighting by party ID make a poll more accurate? (Yes.)
Unfortunately without a crystal ball, we cannot know which weighting scheme will make our poll more accurate for 2026. But we can see which approach would have been most accurate in past elections.
To figure this out, I took the raw data from the 60,000-person Cooperative Election Study surveys from 2024 and 2020 and reweighted them the same way I described above: Each year’s poll was weighted to be representative by Census demographics, then given a weight according to its party ID in three ways — party pinned 3-way, leaned 3-way, and 5-way, using the NPORS distribution from each cycle.
The results are shown in the graphic below.
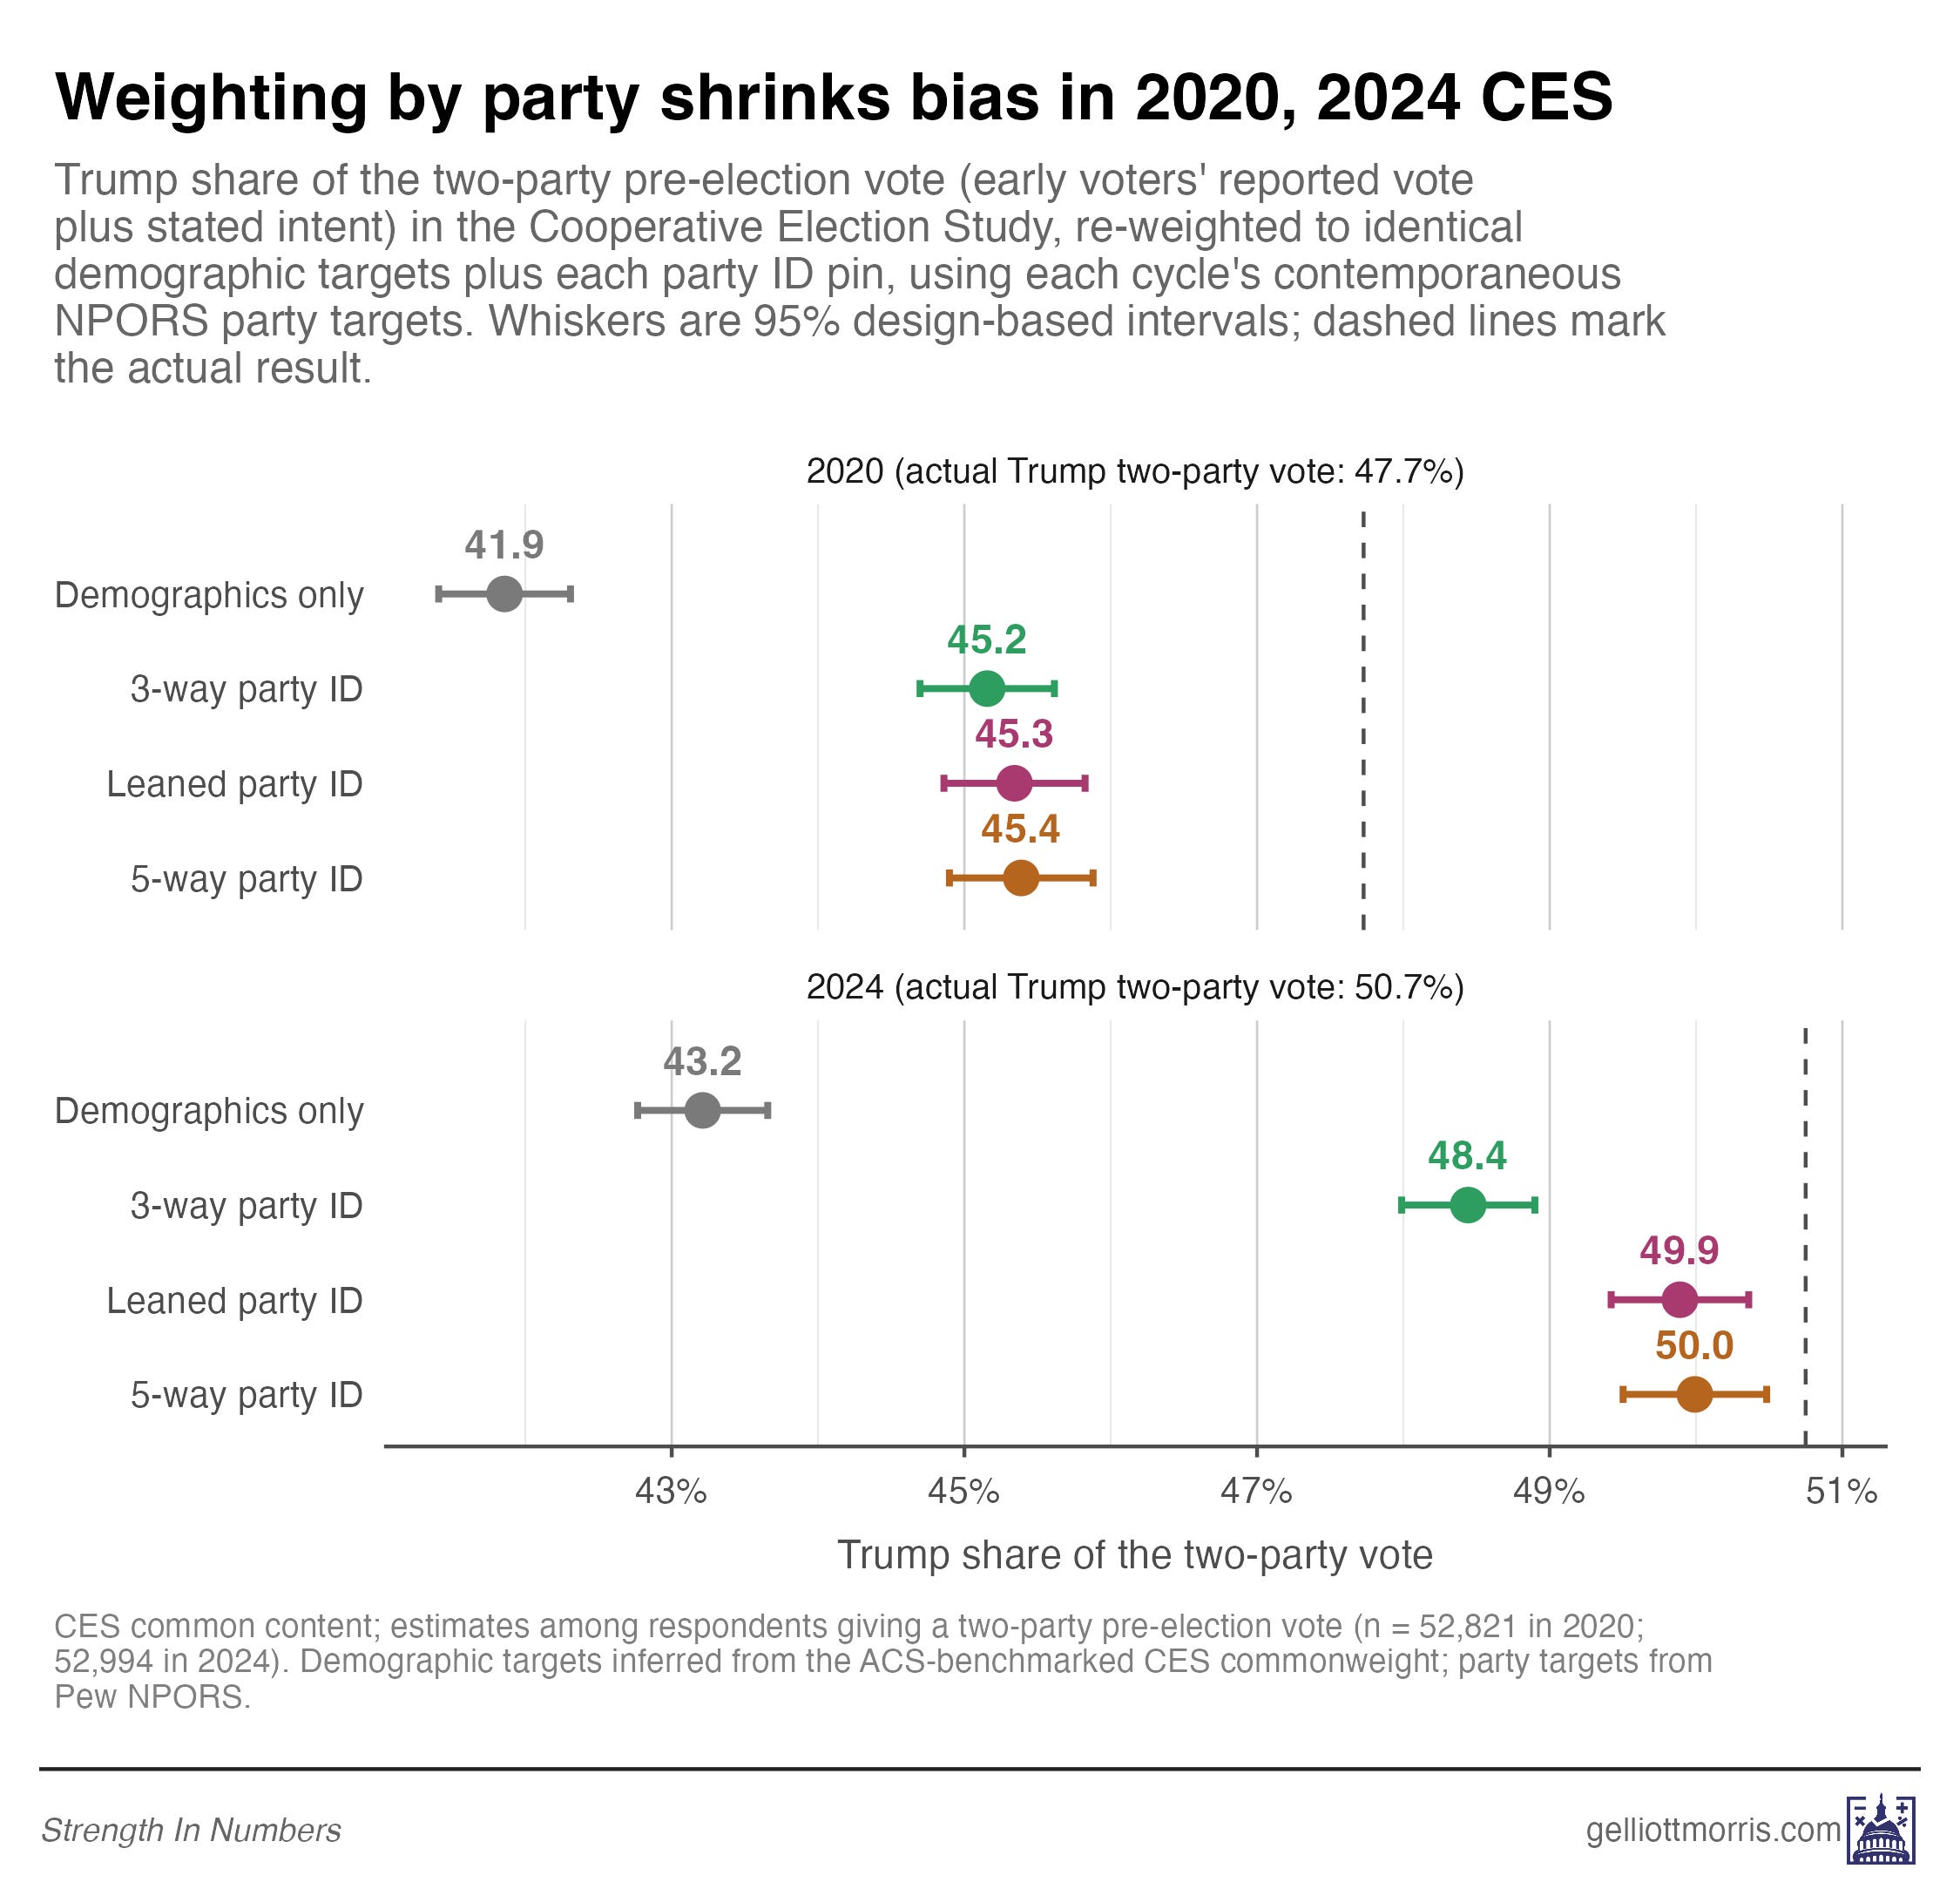
In deciphering the above, start with the bottom panel. Trump won 50.7% of the two-party vote, but when weighted to demographics alone, the CES gave him just 43.2%. That’s a whopping 7-point bias in vote share, which would make for one of the worst national pre-election poll misses since 1952.
But weight by party, the picture changes dramatically.
The 3-way party weight recovered most of the gap between the result and original estimate, putting Trump at 48.4% of the two-party vote. The leaned and five-way pins got within a point — 49.9% and 50.0% — and on post-election recalled vote (not shown) both were essentially exact.
Weighting by party was less efficacious in 2020, and unlike in 2024, weighting by leaned party was not additionally helpful in reducing bias; nothing fully fixed that year’s Democratic lean. Weighting by demographics alone put Trump at 41.9% against an actual 47.7%. The three-way party weight got him up to 45.2%, and the leaner pins added just two tenths of a point.
The conclusion from the historical data is that weighting by party is a must, but weighting by leaned party is not a proven solution to reduce bias. The only thing we know for a fact the extra weighting does is increase sample design effects and thus uncertainty. It makes sense that some pollsters would not want to make that tradeoff (especially if they were designing their methodologies before 2024!).
For good measure, I ran one final test on our own Strength In Numbers/Verasight July sample: I held out the 2024-vote benchmark from the weighting model and calibrated the survey by party in the three methods above. Those results are shown below:
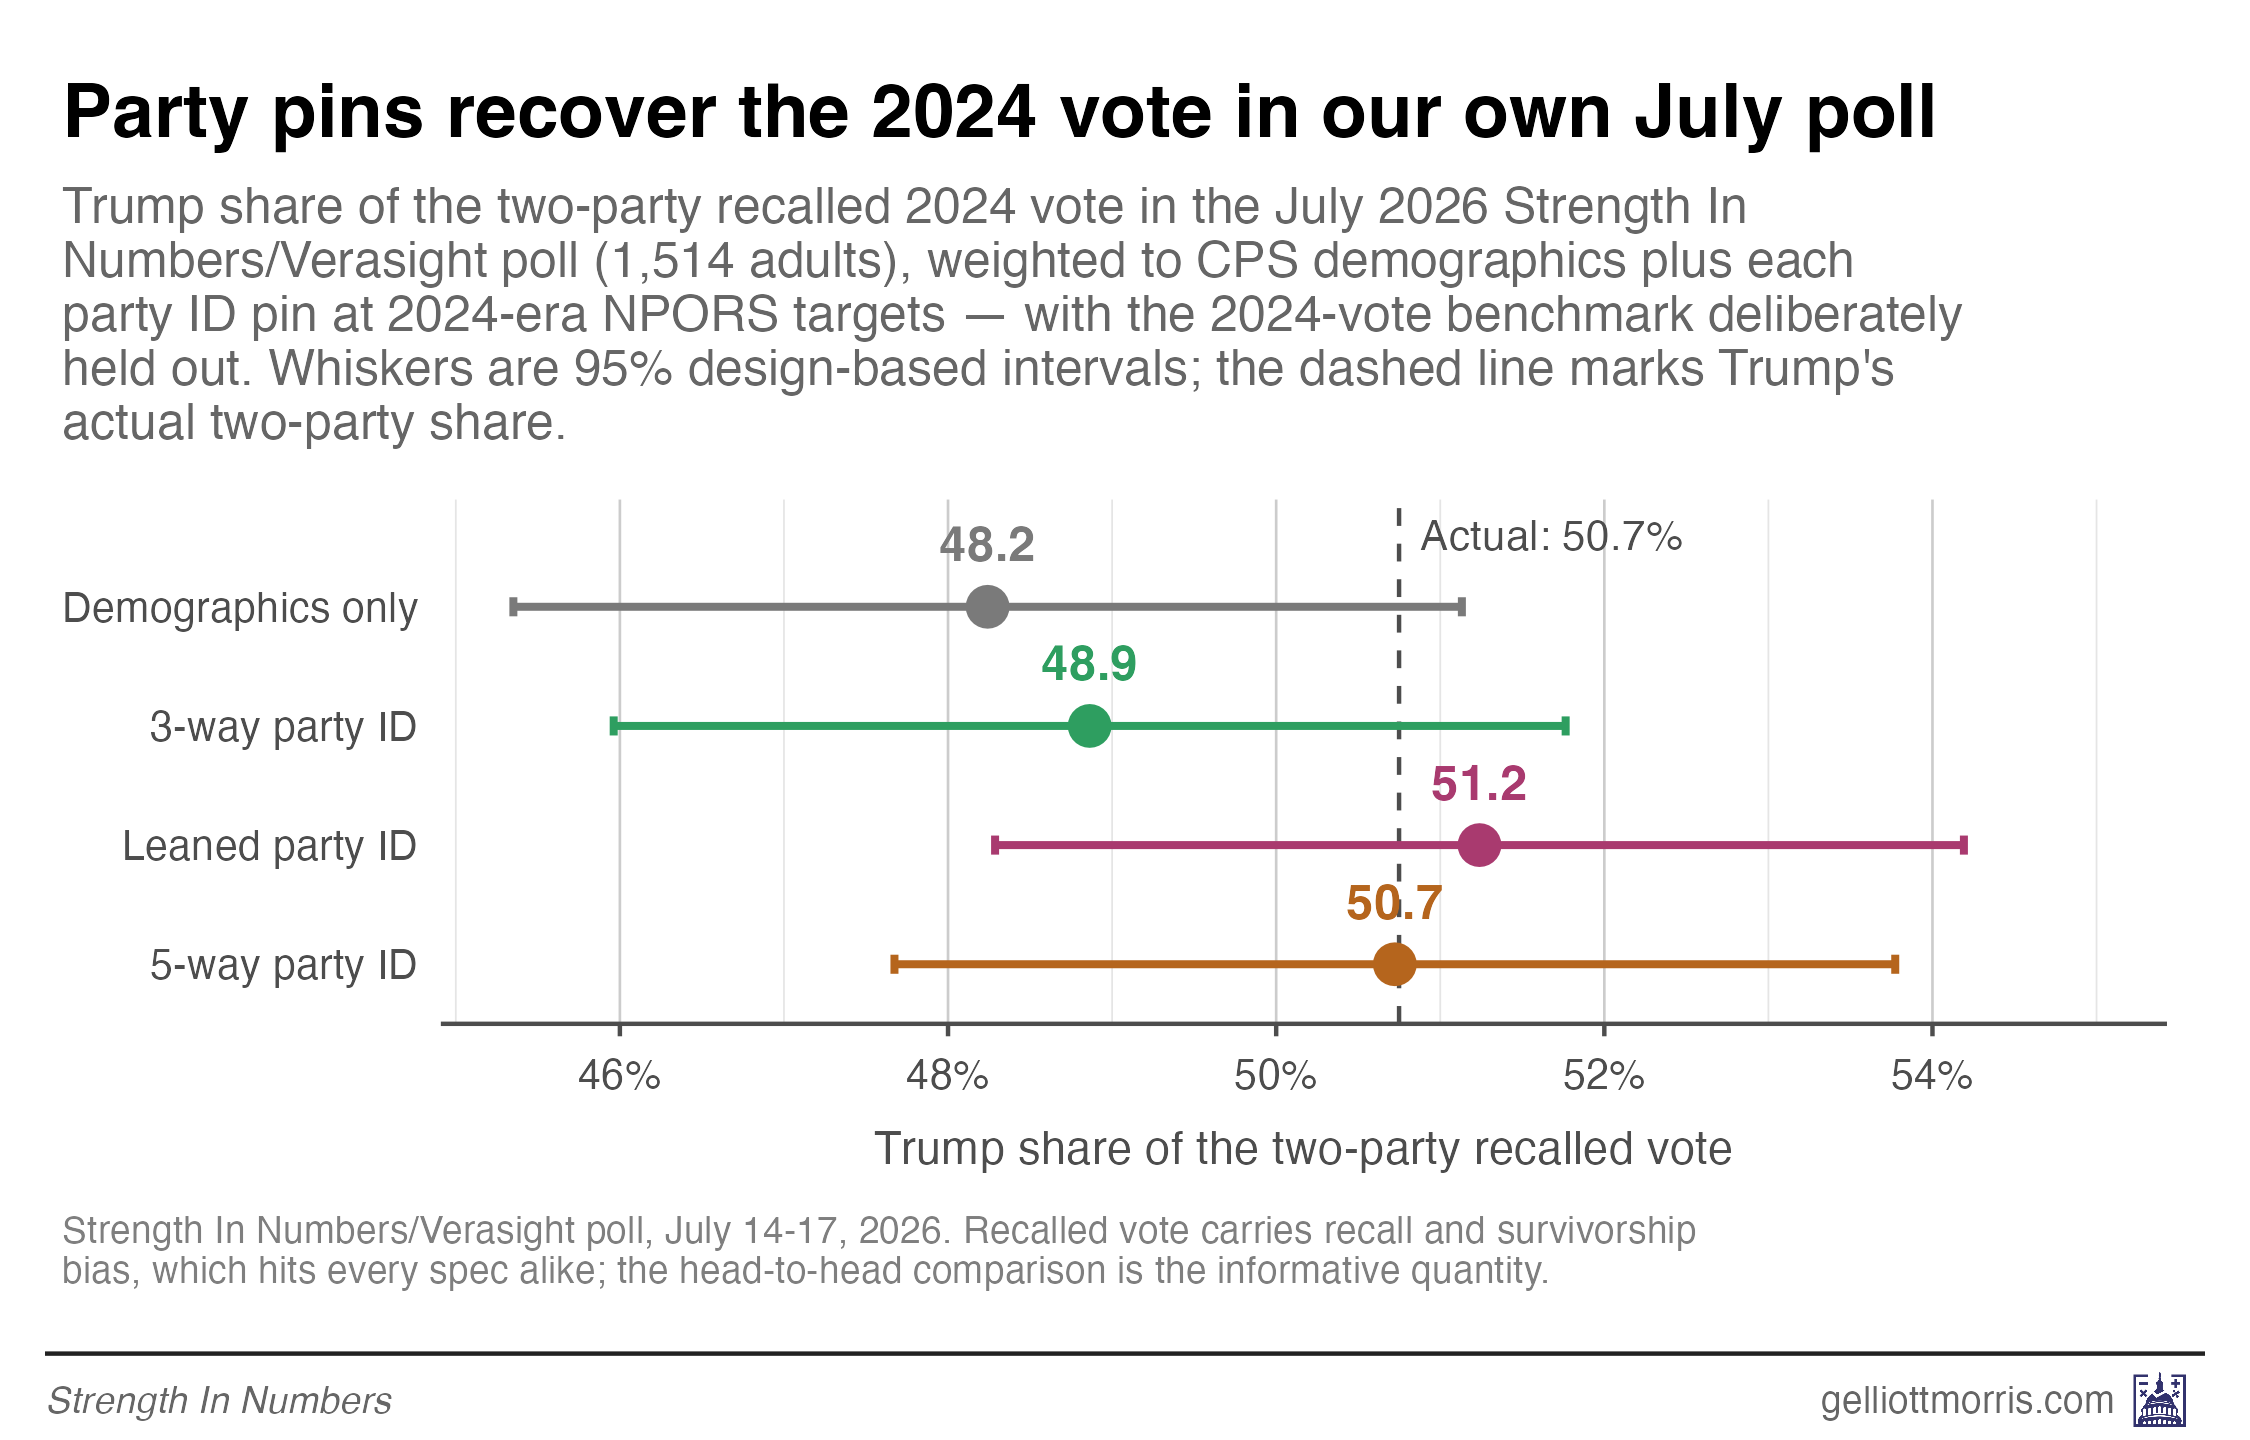
When weighted just to demographics, Verasight’s sample is off (though meaningfully less biased than the CES) when predicting the results of the 2024 election. The conclusion from this is that weighting by some political variable is necessary. Weighting by unleaned 3-way party ID does not reduce much bias, suggesting that the independents in the sample lean Democratic by past vote. The five-way party break with pre-election 2024 NPORS numbers recovered the result of the election almost perfectly, while the leaned three-way was off by less than a point.
Still, note that all weighting specifications came within the margin of error of 2024 recalled vote, and of each other.
Weighting by party is not black and white
So why not switch tomorrow? A few considerations.
First, pinning the leaners only makes the poll more accurate if the leaner benchmark is right. Unfortunately, while NPORS is a high-response rate survey developed by some of the smartest minds in polling, it is still only a survey. That means it’s subject to the same sampling and non-sampling error every other poll is. If the leaned party ID is off by 2 points, all polls that weight to it will also be off. Verasight uses a three-year running average of three-way party ID to minimize potential error in the benchmark, which I think is a sensible cautious approach.
And second, NPORS only comes out once a year. Even a perfectly calibrated current target gets stale over time. The 2026 NPORS was fielded from January to June 2026. By Election Day, the entire sample will be 5-months out of date, and the oldest interviews will be nearly a year old! That’s a lot of stale data exactly when polling accuracy matters most. The three-way mix is less likely to go wildly out of whack than the 5-way.
This analysis shows that weighting by some benchmark for party is a good idea. We have done that. The second-order questions (3-way leaned or 5-way split? what about 7-way?) are less important and unresolved.
Finally, there’s the editorial factor I started with: Verasight develops the methodology for the Strength In Numbers poll, not me. If they decide it’s best to update their approach, I’ll follow their lead.
Got a weighting or methods question you want the Data Lab to dig into? Leave it in the comments below!


You bury the headline here. Your existing poll only has a design effect of 1.04? That's amazing.
Could Verasight or you run the data privately with 5way and leaned methodologies as an empirical check on the accuracy of ongoing surveys? Are there other sources that could be utilized to refine the Pew data, perhaps by a weighted updating based on the Pew data, which then could correct that data by 'fresher' polls that ask the same or analogous party ID questions? (As I'm not a statistician, these questions may be irrelevant or impossible to do; if so, ignore).