


This is my weekly Sunday roundup of new political data published over the last seven days. It is free to read, but if you want to support independent data-driven political journalism, become a paying subscriber and get additional data journalism and premium analysis at least once weekly.
Readers, one programming note before the main contents. The August wave of our monthly Strength In Numbers/Verasight poll comes out this week! It contains questions on how much savings people have, what party people think cares most about them, and how Democrats are viewing their party’s efforts fighting Trump, and whether they want it to make ideological compromises to win elections.
As a fun little pre-release bonus for readers, I’ve updated the Trump approval maps below with the August data.
1. Trump’s approval rating in every neighborhood: now even more underwater
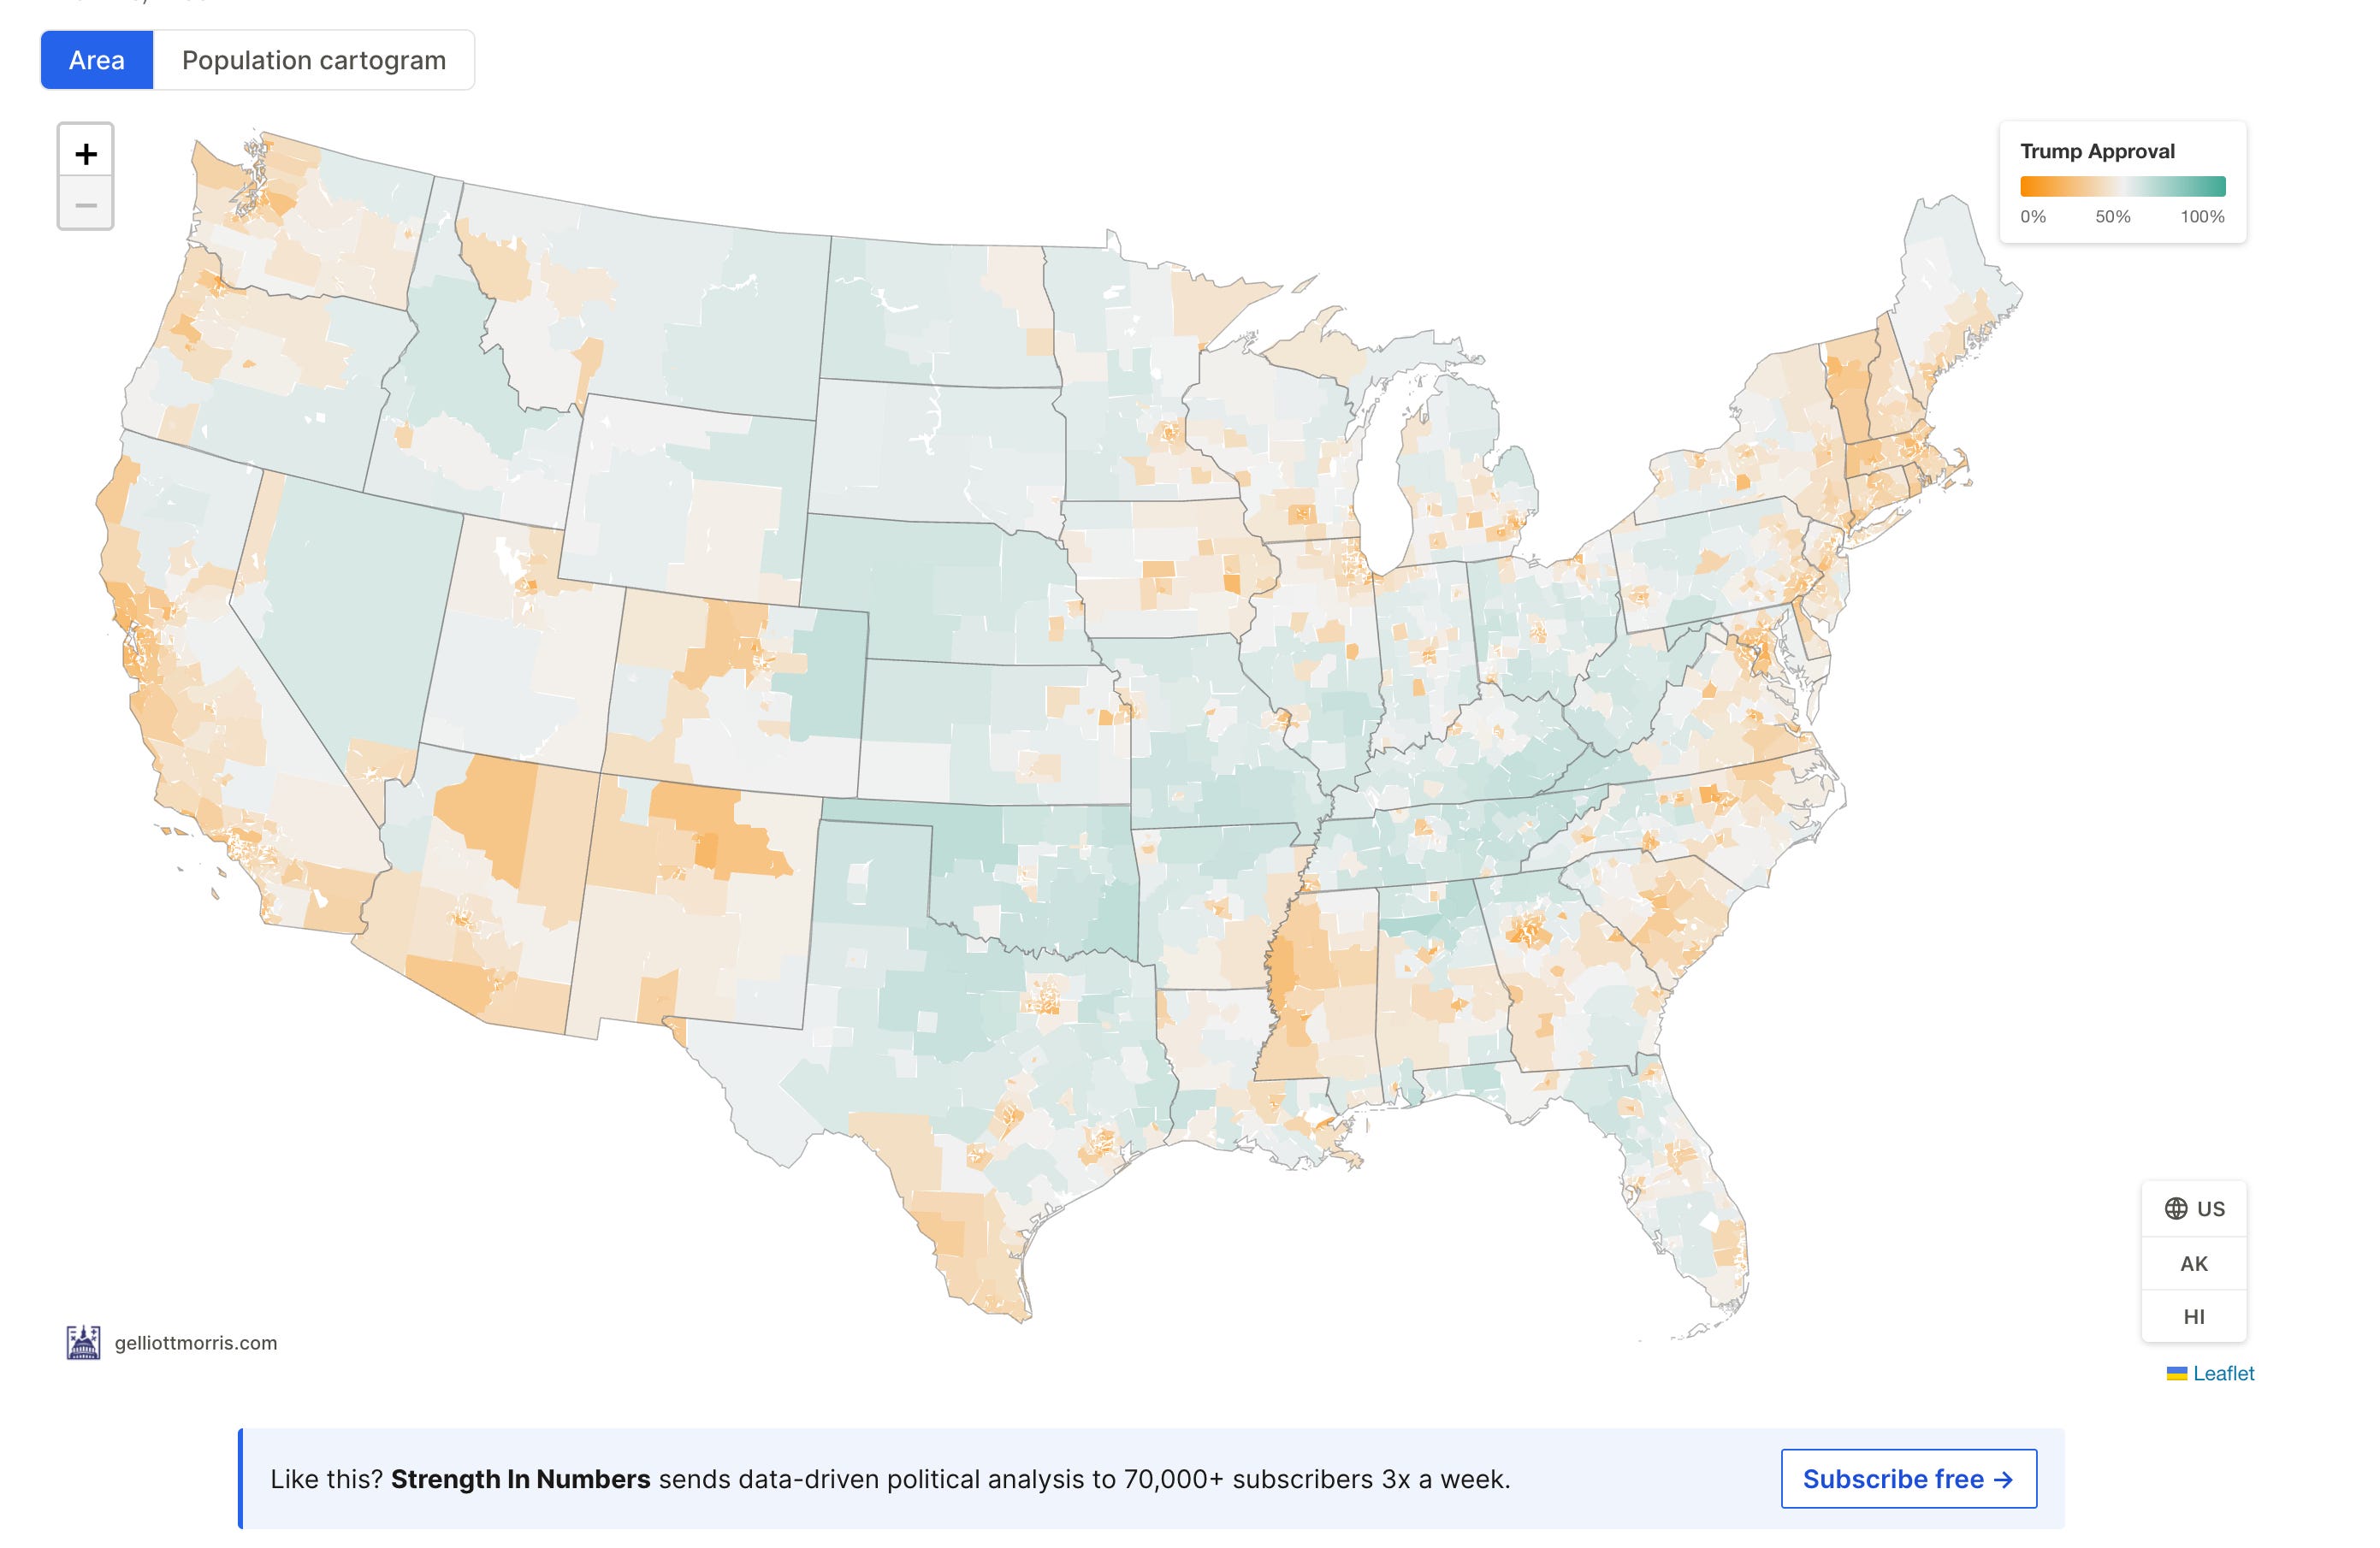
In January, I built a very detailed map of Trump’s job approval, broken out by Census “Public Use Microdata Area” — or PUMAs for short. PUMAs are geographic units of roughly 100,000 people on average, which offers a finer resolution than counties in most places (sorry, Wyoming; you actually have more counties than PUMAs).
The model that generates these estimates combines more than 24,000 interviews from the last 18 months of Strength In Numbers/Verasight polling. We place respondents to our poll in individual zip codes across the country, and then predict Trump’s popularity in each using demographic and political data about who lives there.
I have now refreshed this model with the latest numbers. If you thought things looked bad before, you’re in for a surprise. As of now there is only one demographic group in the country that on net supports the president, and then turns into a negative net approval rating in the vast majority of PUMAs.
Here’s the area-level view, which looks decently okay because of the huge stretches of the Mountain West, the Great Plains, Appalachia, and the Deep South that have no people living in them. Green is net-positive approval, geographically speaking.
But switch it to a population cartogram instead, where every PUMA is sized by how many people actually live there, and the population groks easier. Almost every dense population center turns solid orange, with tens to hundreds of PUMAs in each.
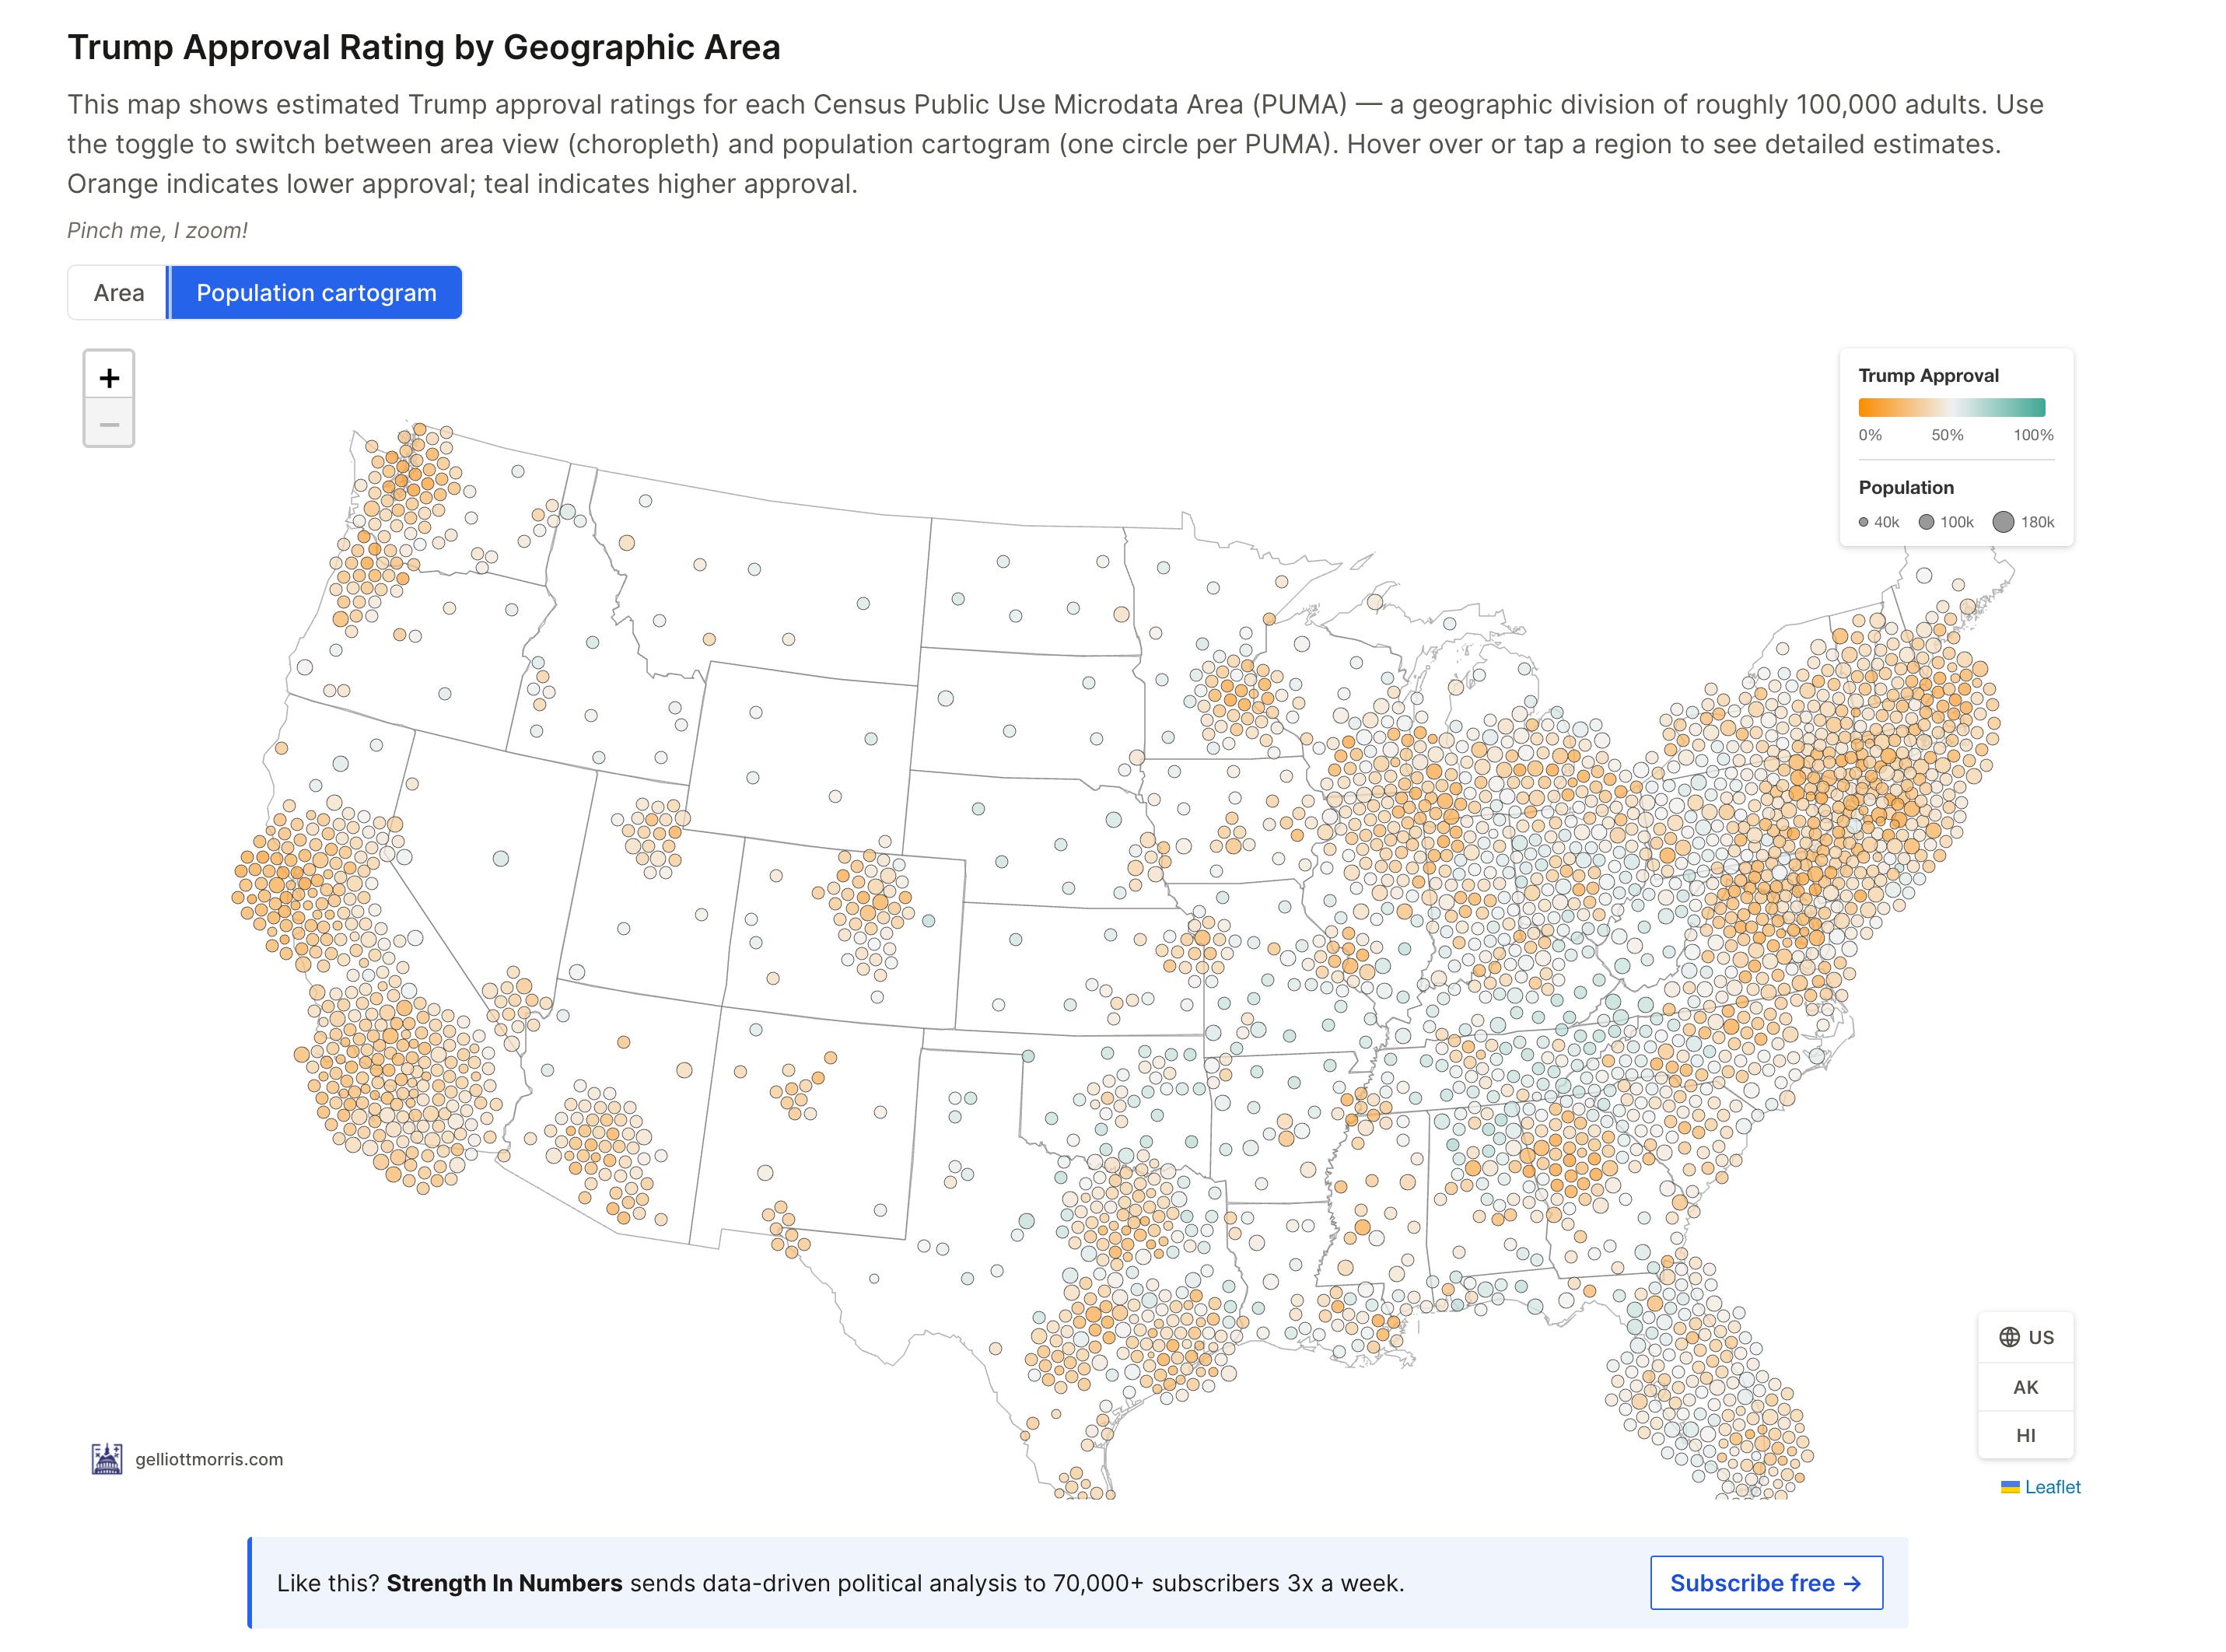
This map is so orange because land doesn’t vote, people do. Most of the people in this country currently disapprove of the president. That means most PUMAs are going to at least be light orange.
FiftyPlusOne’s polling average had Trump underwater by 24 points at publication — 36.1% approve to 59.9% disapprove. Disapproval isn’t just a cities-and-suburbs story anymore; it’s creeping into genuinely rural, red-leaning PUMAs too,
Zoom into your own area and see where you land.
And if you want more state- and district-level MRP estimates for policy, check out my new polling company Wave Polling and Research, which uses the underlying model technology behind these maps to make projections of policy support and other opinions on dozens of topics, from hundreds of thousands of interviews in public and private survey data. We are currently looking for partners to expand our data collection to weekly cadence on new topics.
2. What Strength In Numbers published last week
On Tuesday, I took a fresh look at whether Abdul El-Sayed can actually win Michigan’s Senate race, arguing pundits are far more confident than the evidence warrants about which kinds of progressives underperform:

Also Tuesday, over in the Data Lab (free to read), I dug into why it is so hard to know the age composition of the Democratic primary electorate in Wisconsin — but data suggests it’s somewhere in the neighborhood of 9%.

For Thursday’s podcast, I talked with FiftyPlusOne’s head of research, Mary Radcliffe, about a wave of fabricated and undisclosed partisan polls hitting the industry this cycle. I doubt this is the last time we will have to talk about this topic this year.

And Friday’s Chart of the Week checked a Republican pollster’s claim that surveys are systematically overestimating Democrats again this year. Maybe they are, but predicting polling bias from the last cycle’s miss is typically a fool's errand.

If you’re a frequent reader of Strength In Numbers, I’m confident you will get a lot of value out of a paid subscription. You’ll get access to all of my Tuesday Deep Dives, monthly polling crosstabs, our private community of election nerds on Discord, and more.
3. Even more numbers!
Bright Line Watch: expert ratings of U.S. democracy ticked up this summer, the best of Trump’s second term, though still below the low point of Biden’s presidency. A Partial Democratic Rebound?
Bradley Wascher lays out the Senate math: Democrats need something like a D+9 national environment to flip the majority — which a year ago would have seemed impossible but now looks possible, in fact is ay even odds in our forecast. Democrats Seek Majority in Most Republican Senate Class
YouGov: 66% of Americans now say “arrogant” describes Trump a lot, and the share calling him a strong leader has sagged from 49% just after his 2024 election to 36% today. How do Americans describe Donald Trump?
A Reuters/Ipsos poll found 63% of Americans think it’s inappropriate that Trump and his family have profited from crypto ventures since he returned to office — including about three in ten of his own Republicans. Most Americans believe Trump has inappropriately profited since returning to power
The new Economist/YouGov poll has Democrats up 7 on the generic ballot overall — and up 23 points among the most enthusiastic registered voters. Republican support for Trump has fallen as Democrats hold a big lead among enthusiastic midterms voters
Another banger fron my colleagues at FiftyPlusOne — rural voters have swung toward Democrats since Trump’s inauguration, leaving the GOP’s current rural advantage just shy of its 14-point edge in the 2018 wave. Rural and suburban voters haven’t looked this Democratic since 2018
Are betting markets and bad polls making it harder to tell who’s actually winning? Reid Epstein digs into the confusion, using Haley Stevens’s near-miss in Michigan as exhibit A. Why Polling Chaos Could Create Big Problems for American Politics
And that’s it for this week! Thanks for reading. Strength In Numbers will be back in your inbox on Tuesday.
Got more for next week? Email your links or add them to the comments below! Comments are now UNLOCKED on the Sunday roundup.
Well, your results saved Natalie a lot of printing time!
Ron Brownstein says 90% of voters choose midterm candidates by whether they approve of the incumbent President. Your approval numbers by state may predict several of the Senate race outcomes, if that premise holds up. The Economist/YouGov approval ratings by state are a little higher, but similar. From Trump's approval polling, looks like six seats could flip to Dems, and maybe even 3 more.