

Democrats expand lead in U.S. House polls this week
Recent polls have shown a big shift toward the Democrats in the House generic ballot. If historical patterns of out-party gains continue in 2026, Democrats could see a larger "blue wave" than in 2018.

After this November’s off-year elections, I argued that the Democrats’ sweep from Georgia to New Jersey wasn’t the result just of Democratic-leaning turnout, but the product of real swings to the left among key voting groups. Two such groups were Latinos and voters who care most about the economy — the latter of which went from backing Trump by over 60 points in 2024 to backing Democratic candidates for governor by roughly 30 points in 2025. Latino-heavy precincts in New Jersey moved left by 50 points.
This week, polls confirmed the Democrats’ rosy position with voters, and even showed a sizable shift toward the party compared to previous data. In one notable survey from Marist College, sponsored by NPR/PBS News, Democrats held a 14-point lead over Republicans in the U.S. House “generic ballot” test (the “generic ballot” is a poll question that asks voters who they would vote for in their local congressional district if the 2026 elections were held today). NPR ran with the headline “Democrats have biggest advantage for control of Congress in 8 years.”
The Marist poll is an outlier, but not the only poll to show a trend toward Democrats this week. Today’s Chart of the Week: Democrats post their best week yet in generic ballot polls for the 2026 midterms.
To stay up to date with all the data on the 2026 midterm elections, and get updates about my plans for more polling and forecasting, be sure to sign up to get Strength In Numbers in your inbox:
And consider a paid subscription to get premium analysis weekly and support all the data work I’m doing here on Substack.
A very good week of generic ballot polls for Democrats
First, consider the toplines. Since Nov. 13, six national pollsters have released House generic ballot surveys. All of them show Democrats ahead, with margins ranging from D+3 to D+14 and an average of about D+6. That’s a noticeably bluer environment than what we were looking at even a month ago, when Democrats’ edge in most surveys was in the low single digits or non-existent (more on that later).
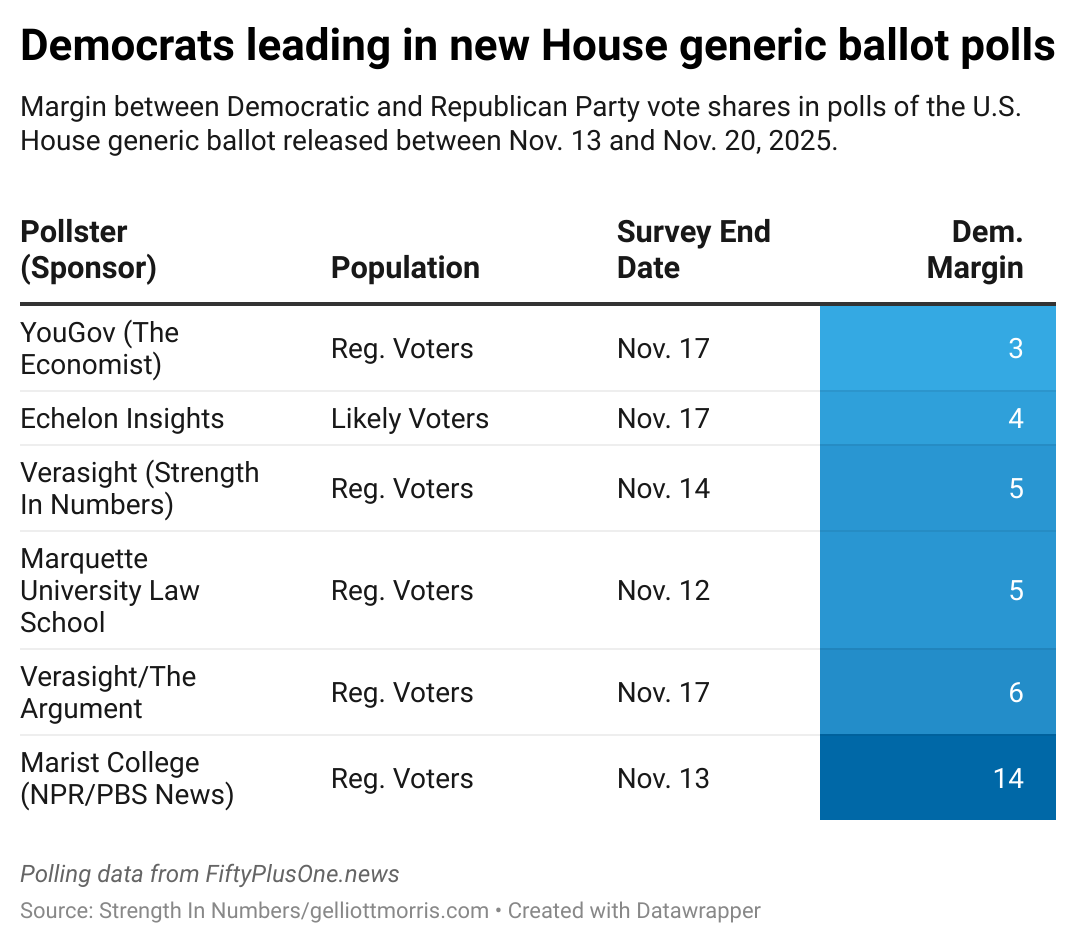
Two things are worth flagging here. First, these aren’t just “friendly” outfits — the list includes everyone from non-partisan firms like YouGov and Verasight to media pollsters, including Marist and Marquette, to Republican consultant shops like Echelon Insights. The data here are from high-quality firms with solid track records of accurately measuring public sentiment.
Second, the results are much better for Democrats than polls conducted before the November elections. In their survey write-up, The Argument notes that Democrats posted their strongest generic ballot average yet this cycle. In fact, we can compare most of the new surveys this week to earlier polls conducted by the same firms. (The only exceptions are Marist and Marquette, which did not field comparable surveys in October.)
Comparing polls before and after the election
In the chart below, I line up surveys from the pollsters that were in the field both before and after Election Day (specifically, in the month before Nov. 4 or the two weeks after). I also add additional pollsters that released data after the election but before this week (e.g., polls that don’t appear in the above table).
Among seven pollsters that asked the generic ballot both in late October/early November and again in the two weeks after Nov. 4, Democrats’ margin improved by an average of 1.9 percentage points.
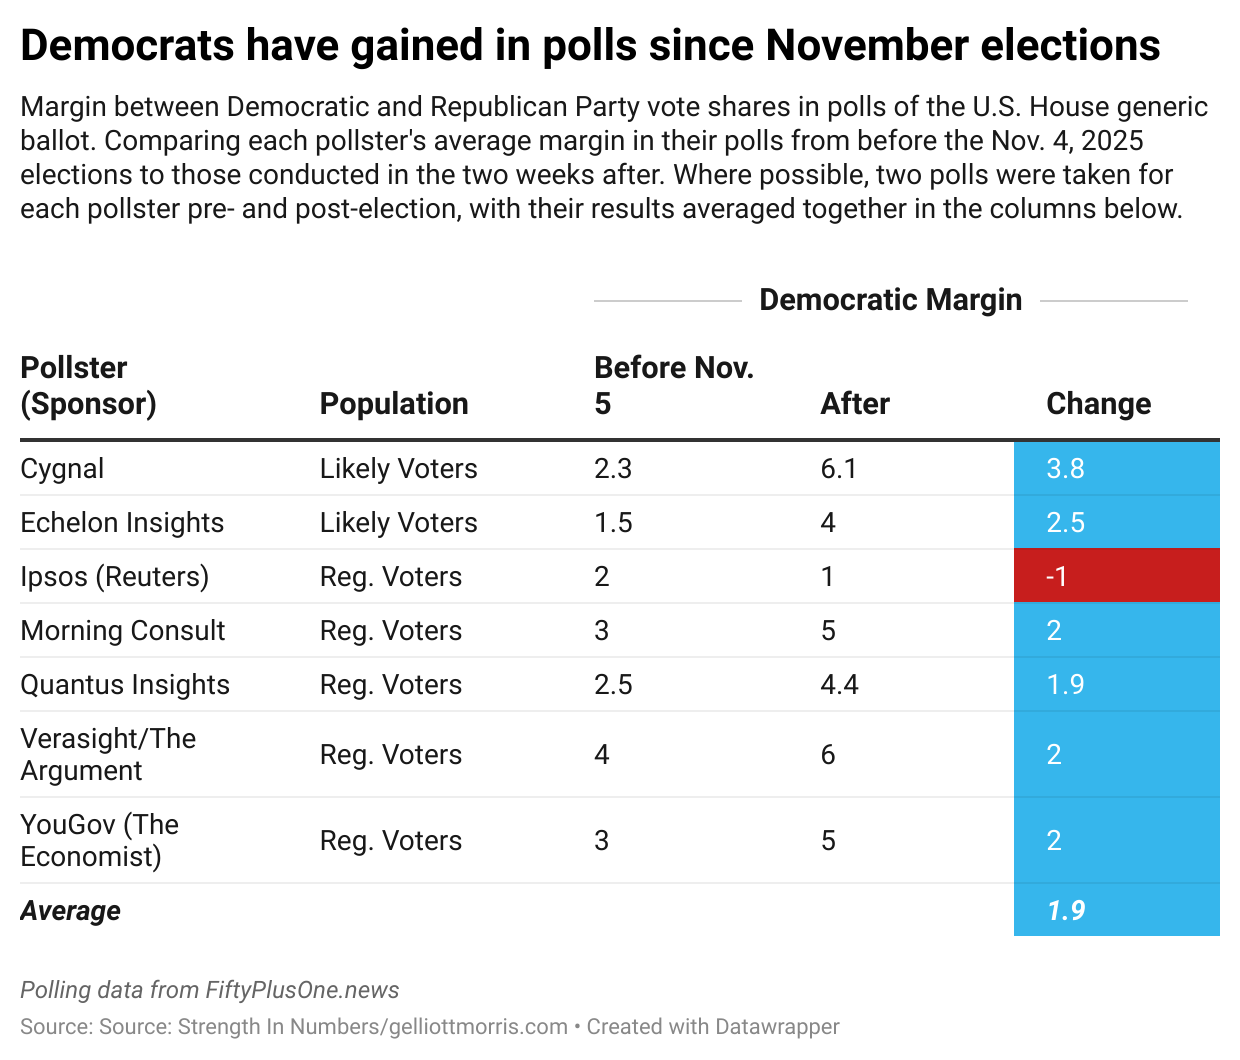
Some of the shifts are pretty striking. Cygnal’s polling (among likely voters) moved from D+2.3 to D+6.1, a nearly four-point gain. Echelon Insights went from D+1.5 to D+4 on average between its two pre-election polls and one post-election survey.1 And the Verasight/The Argument survey nudged from D+4 to D+6. Only Ipsos shows a small move in the other direction, from D+2 to D+1 — which is fine; you should rarely expect every pollster to move in lockstep.
In other words, we are not in a scenario where one single outlier poll is dragging the average around. We are seeing a broad, pro-Democratic shift in the U.S. House vote across a bunch of different pollsters, using different methods and samples of voters.
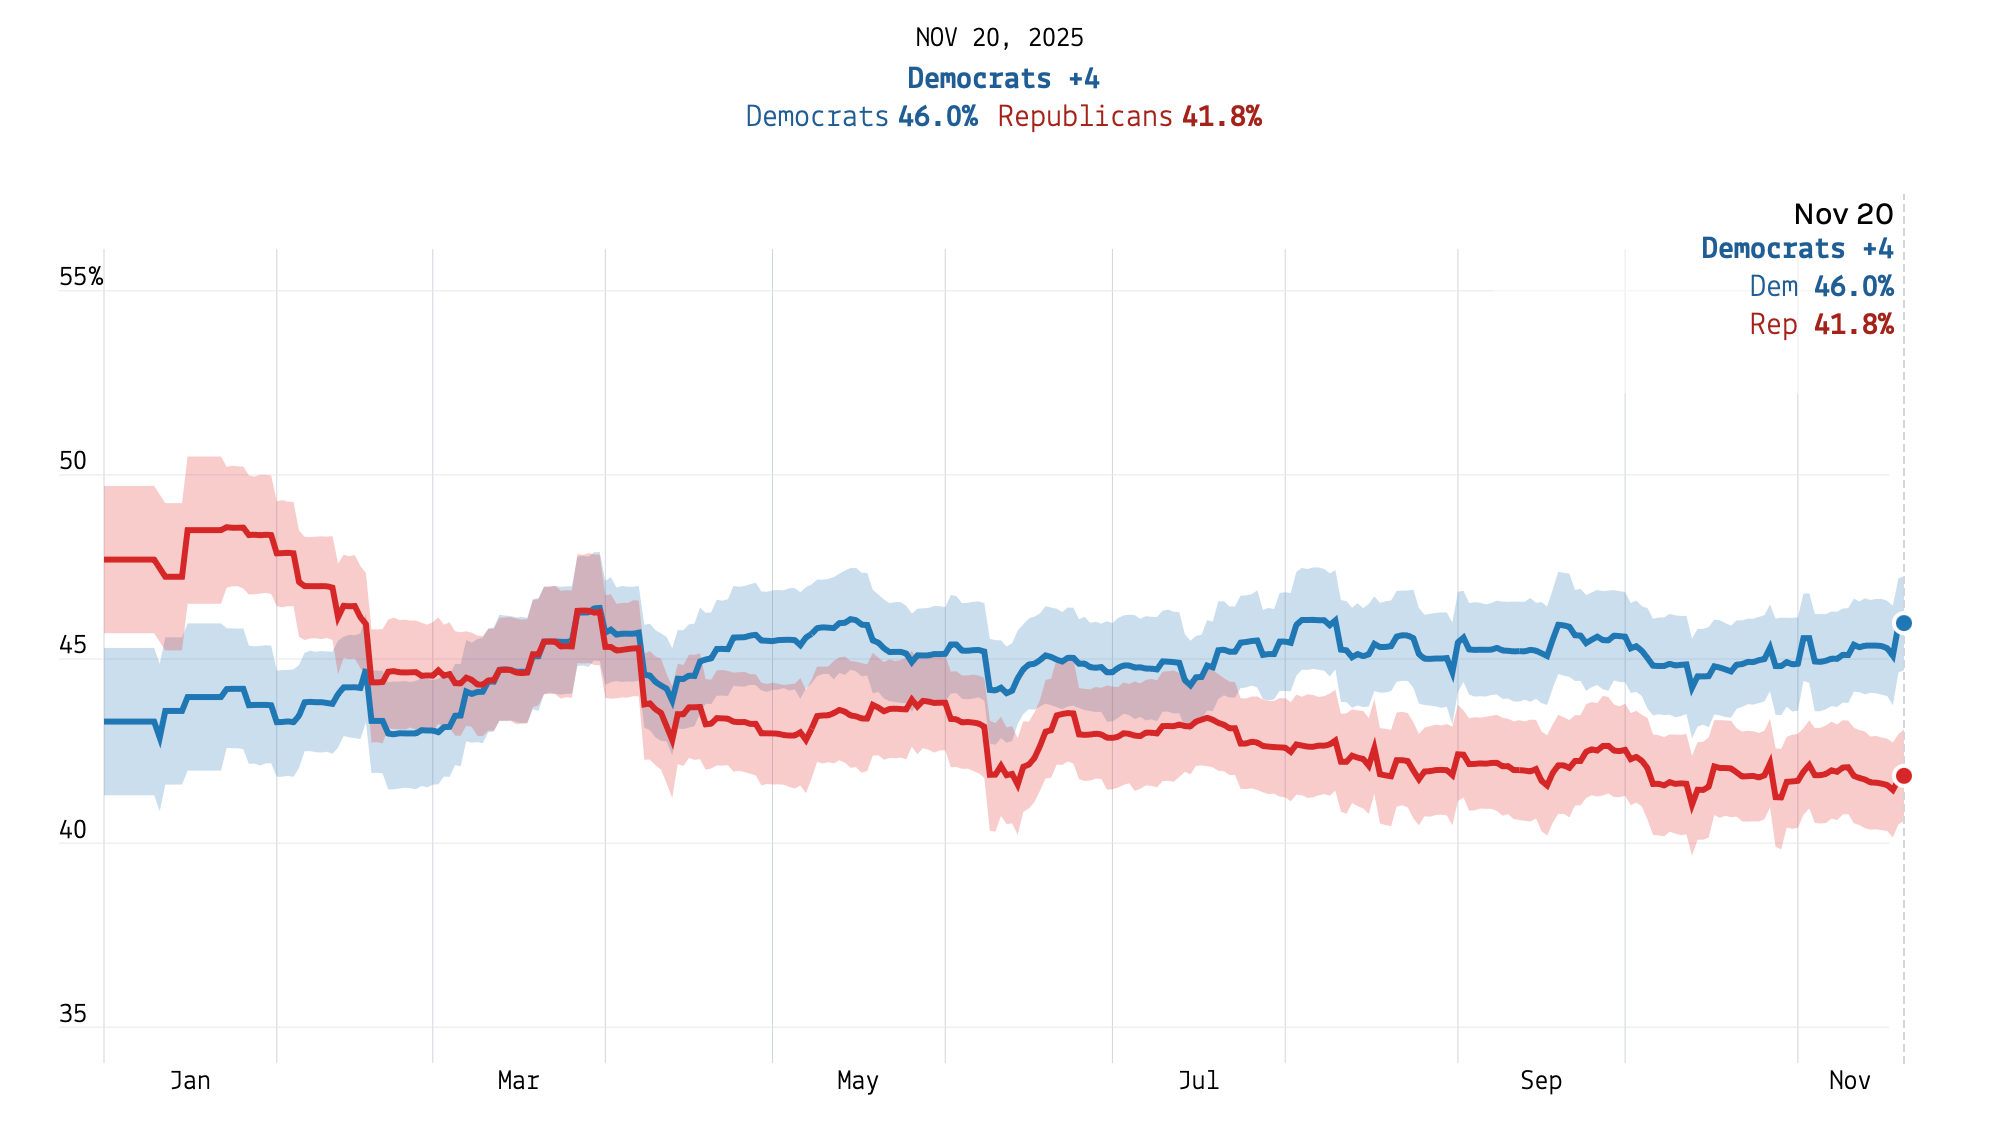
Because polls are noisy, I’m usually hesitant to lean too hard on any single week of data. That’s why at Strength In Numbers’ sister site FiftyPlusOne.news, we run a model-based polling average that adjusts for pollster “house effects,” survey mode, and poll/ster partisanship, then smooths results over time. The polling average I calculate there has Democrats up 4.2 points this week, 46% to 41.8%. That’s a new high for the party this year — and an exact mirror of the Republican Party’s lead at the start of Trump’s term:
Remember, this is not just the raw mean of whatever comes in the door. The model is explicitly skeptical of sharp, one-off movements; it only shifts when multiple polls point in the same direction. So the fact that we’re now above D+4 — with Democrats increasing their margin by 1.6 points vs pre-election polls — suggests that at least some of the Democrats’ post-November momentum is real, not just noisy data.
What to make of it
So where does that leave us?
The November elections really did signal a meaningful shift in the national mood. Whereas some commentators characterized the elections as local contests plagued by weak Republican candidates, the voters who punished Republicans over affordability and Trump’s second-term agenda don’t exist only in the election returns; they appear in national opinion polls, too.
The “Trump realignment” among young and Latino voters looks increasingly fragile. The exits in Virginia and New Jersey already suggested that Trump’s gains with these groups were built on economic discontent, not durable ideological change. The new polls are consistent with that story. As the economic narrative has turned against Republicans, these voters have drifted back toward Democrats.
A D+4 generic ballot in November 2025 is not a guarantee of anything. District maps still favor Republicans, and we’re nearly a year out from the midterms. Economic data, world events, and candidate scandals can all move opinions again. A court has temporarily taken the Republican gerrymander in Texas off the table, but the Supreme Court could reinstate it.
Normal patterns of midterm backlash should push Democratic numbers up. Historically, the party in control of the White House tends to lose ground in generic ballot polls as the midterms approach. From the previous November to Election Day, the out-party typically gains about 4 points in the generic ballot. That would put Democrats at D+8.2, higher than their vote margin in the 2018 “blue wave” elections.
Taken with the election results, the recent wave of generic ballot polls makes one thing clear: Democrats are in the driver’s seat for 2026.
Echelon Insights pollster Patrick Ruffini explained that some of the shift in his data was due to changes he made to his survey methodology after the Nov. 4 results. I will write more about this for a post at FiftyPlusOne in the coming weeks.
We don't have to wait until next November - the special election in TN-07 on December 2 could be a shocker in a Trump +20 district.
Curious if you are able to localize patterns and see if the shift holds true with the same trajectory for Republican run states?