

Is Trump “doing what he promised”? | Weekly roundup for October 12, 2025
And what does that even mean? Also this week: Shutdown polls; Left-wing populism; Low favorability ratings for all U.S. leaders; Judges' concerns about Trump; + more!

Dear readers,
I don’t normally devote the lead slot in this weekly roundup just to disagreeing with someone’s analysis, but I’m going to make an exception this week. U.S. Press Secretary Karoline Leavitt recently shared a clip by CNN’s Chief Data Reporter Harry Enten claiming Trump is “doing what he promised” and “might as well be called Steady Eddie” in the eyes of the public. In other words, Enten is arguing that public opinion about Trump has not changed since 2024, and later implies he could win again if a hypothetical do-over happened today (I have written about this suggestion in the past).
On Thursday, I posted a short note about why I think Enten’s analysis is wrong/misleading. Given this is getting some traction (The White House put out a press release featuring the clip), I feel I should formulate my thoughts in full.
After the lead note, stick around for plenty of links to other data-driven politics stories published in the last week. On deck at Strength In Numbers this week: An essay for premium subscribers on how independents feel about the Republican Party’s policy focus. I’m also thinking about the effects of social media on polarization and attention, and the interaction of the 2 (I’ve recently deleted all the apps off my phone).
Is Trump “doing what he promised”?
Here’s the TV segment in question. Below, I’ve extracted the three most relevant quotes and written a summary of each of them:
Trump’s favorability rating has been stable since October 2024:
Favorable view of Donald Trump. You know, you go back to October of 2024, 44 percent of the American public viewed him favorably. Now, despite everything, look at this, 43 percent, which is well within the margin of error of that 44 percent. And here’s the thing to keep in mind. This was good enough to get Trump reelected back in 2024. And Donald Trump is basically at the same point here right now
Voting intention for U.S. House elections is unchanged since October 2024:
Look at this, the race for Congress, Dems versus Republican margin. You look at “The New York Times” poll, it was tied a year ago at this point. Now it’s Democrats plus two, within the margin of error. Look at Yahoo/YouGov. It was plus three Democrats at this point a year ago. Now it’s plus four. Maybe the Democrats have gained a little bit, but in reality, Kate, what we’re really seeing is that the American public is pretty much steady. They are basically where they were a year ago at this point. Maybe Democrats can take control of the House where the polling is right now, but maybe not, because the bottom line is, we’ve seen numbers fairly similar to what we have right now. We had it a year ago, and it was not good enough for Democrats to take control.
Most Americans think Trump is “doing what he promised” (and the implication is that he’s popular enough to win a hypothetical redo of 2024):
52 percent, the majority of Americans say that Donald Trump is doing what he promised, compared to 48 percent who said no. So, what essentially is going on here is the voters expected all of this from Donald Trump, the majority did, and that is why his favorable rating, simply put, has not really moved all that much compared to where it was a year ago. Trump is basically doing what the American people thought that he was going to do. Indeed, if you look at the numbers, Trump has basically the steadiest favorable rating this much through a presidency of any president on record. And it’s basically where he was a year ago. Good enough to get him reelected.
There are two things going wrong with this segment. The first is cherry-picking: As far as I can tell, Enten’s results are almost entirely driven by which polls he’s selecting, the questions he’s using, and the timeline used for his comparison.
Take the first claim on favorability polling. While it’s true that Trump’s favorability rating — a poll question which asks Americans how favorably they feel toward the president — is similar to October 2024 levels, there has been a pronounced decrease in this number since November, and since Trump took office in January.
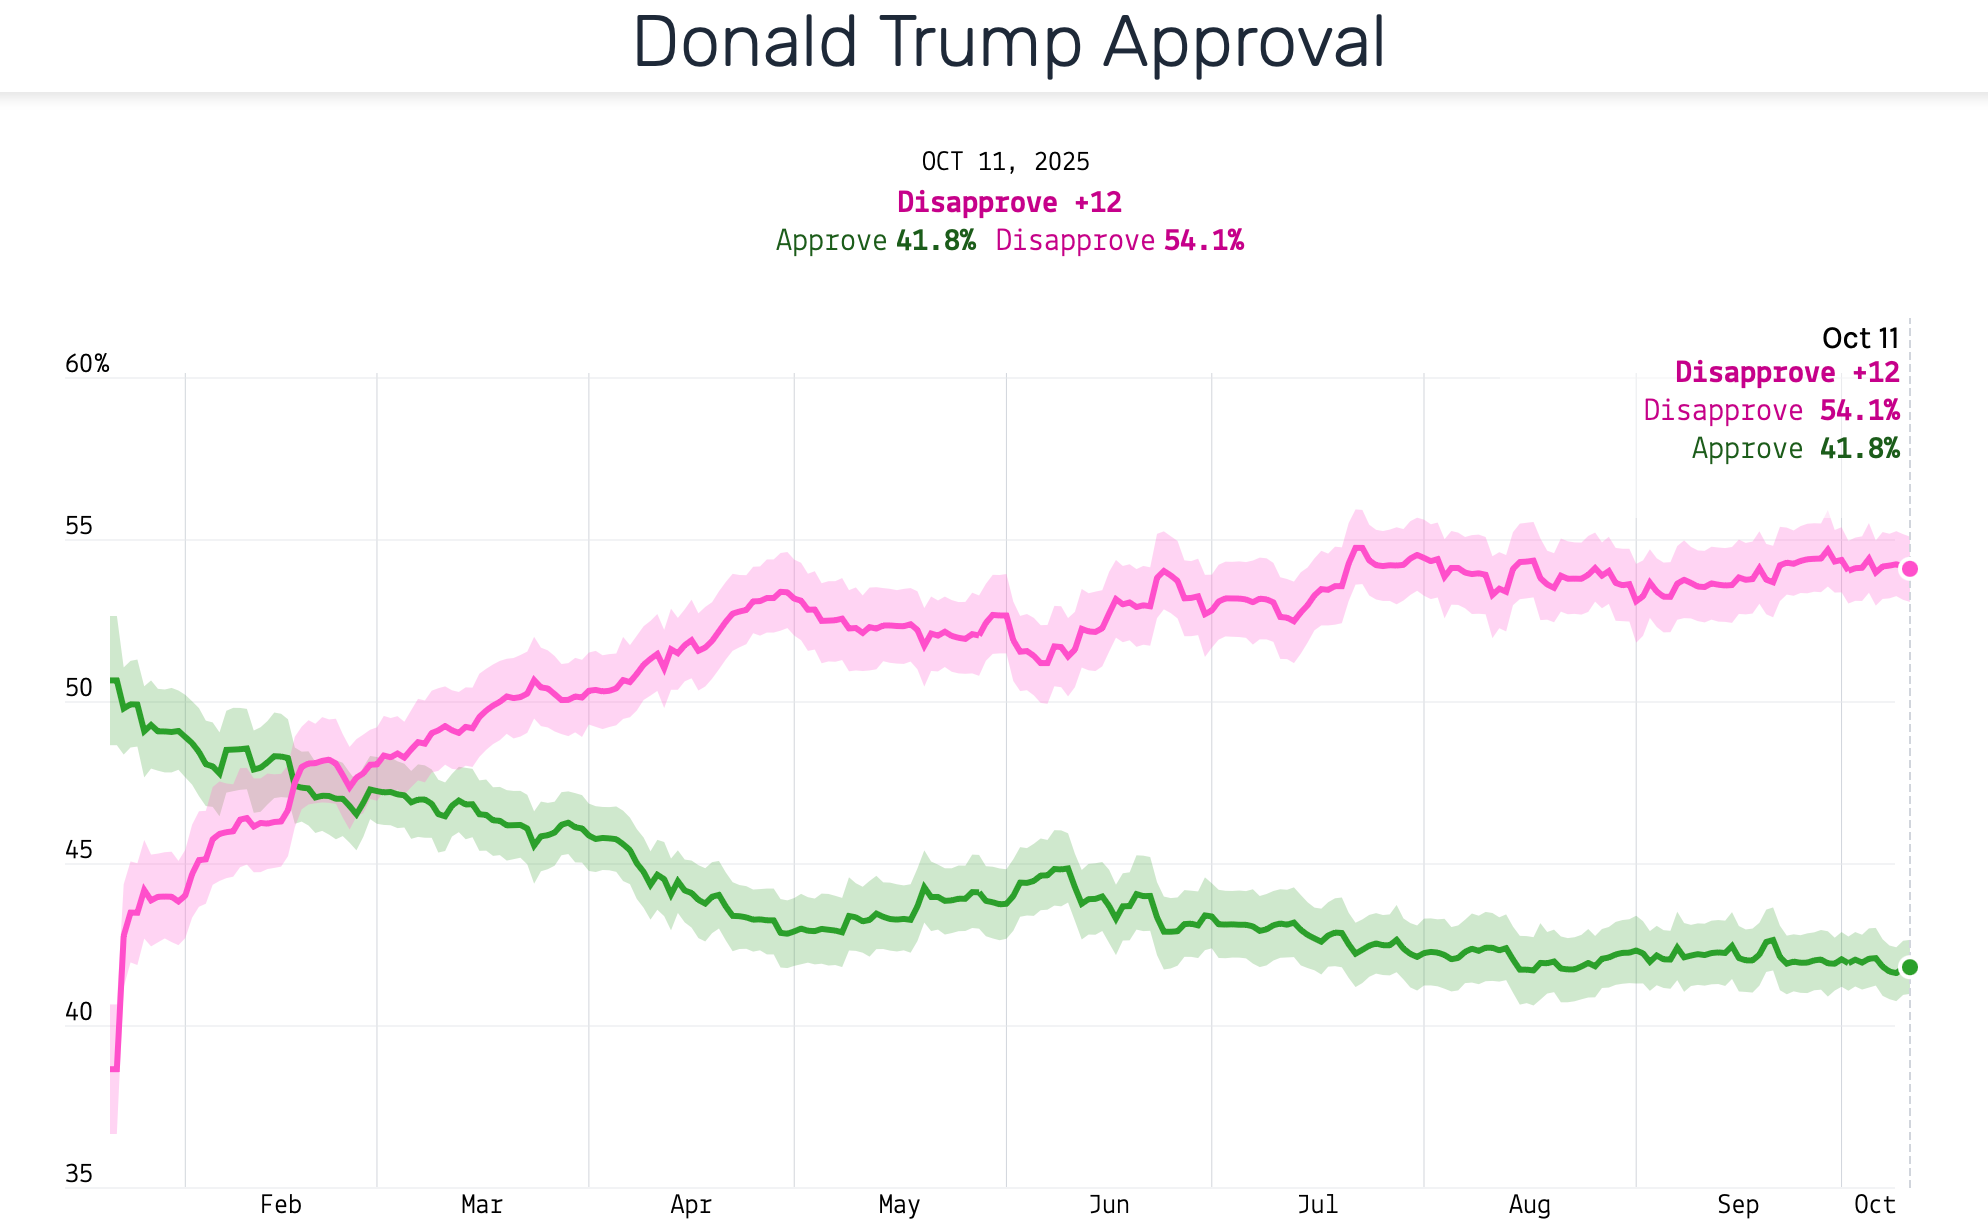
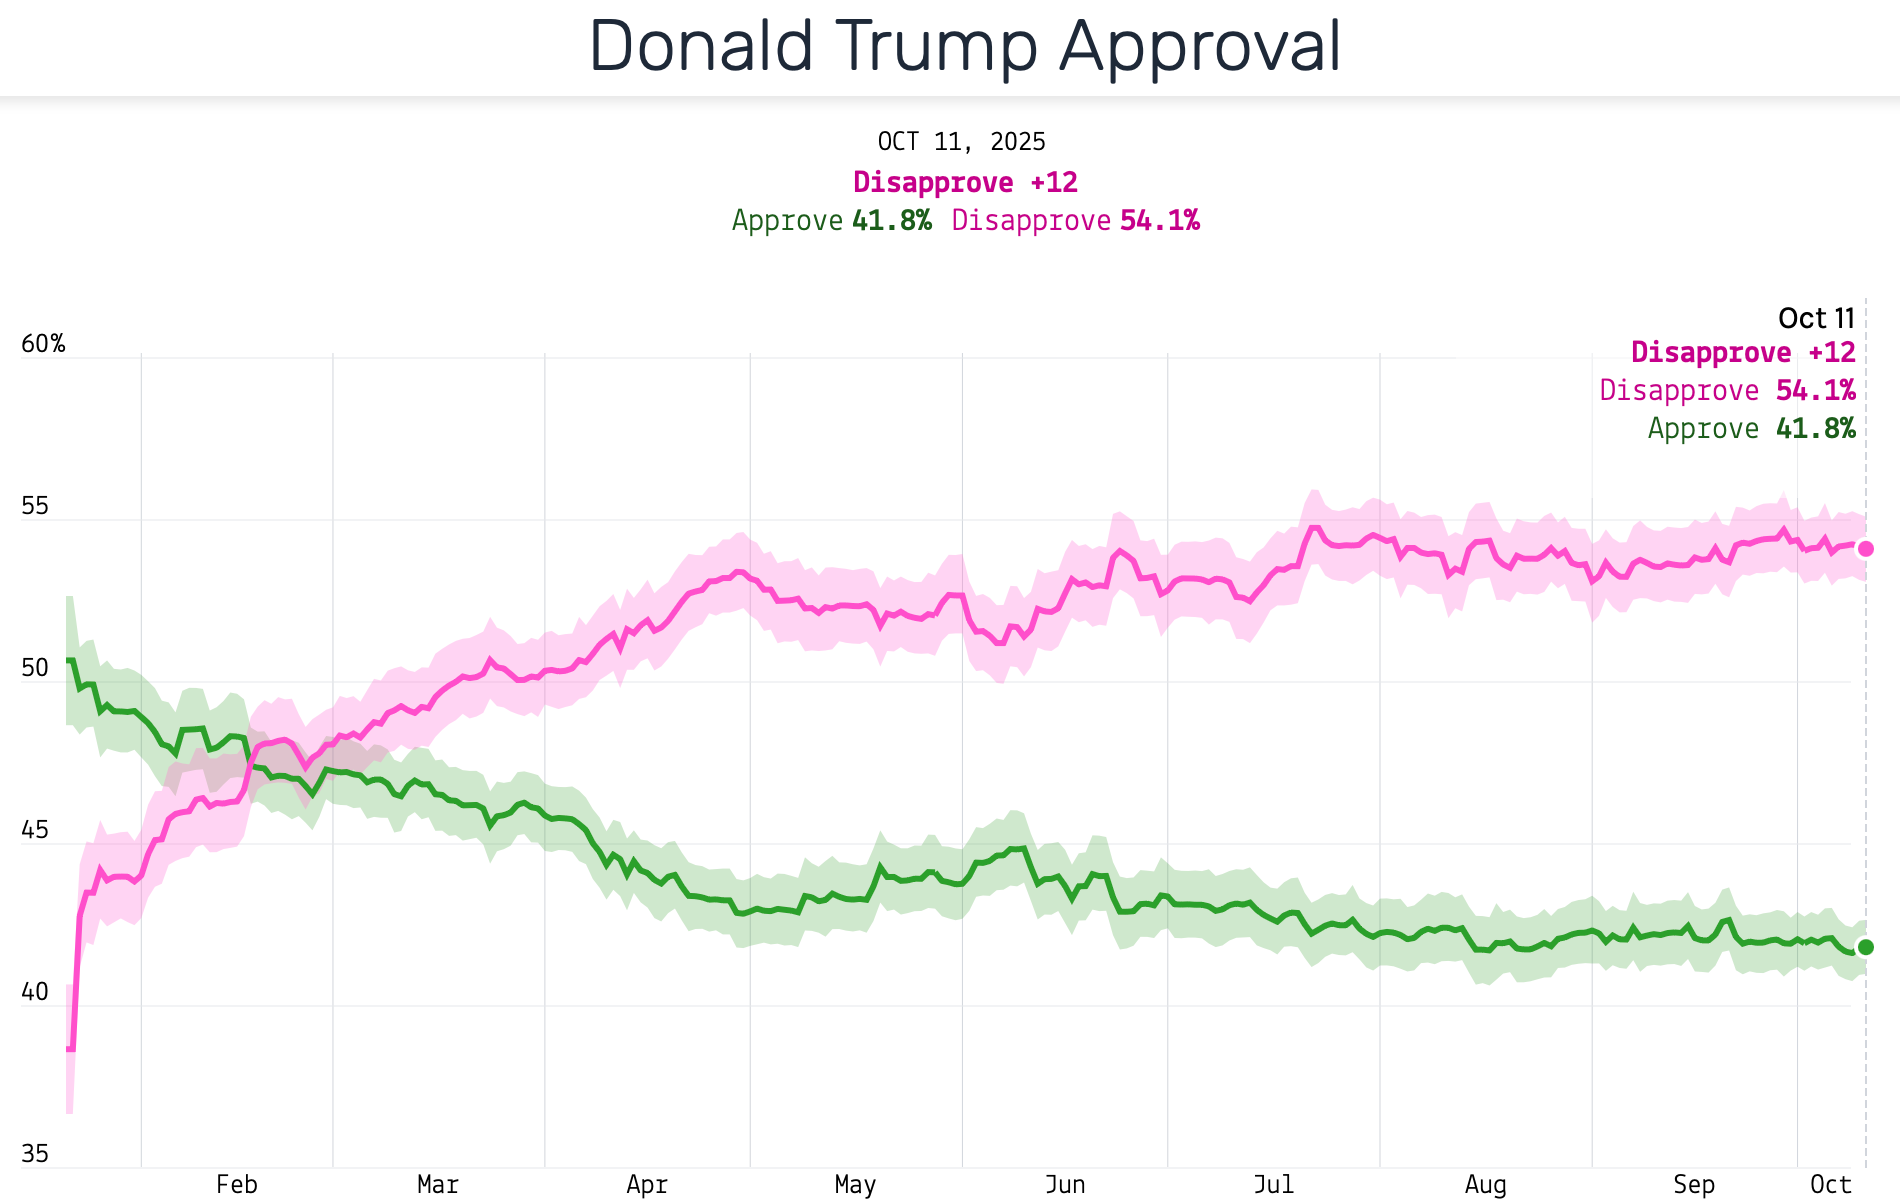
And of course, the president’s job approval rating — a number which is more predictive than favorability of things we care about, like midterm and presidential election outcomes — is significantly worse than it was at the start of Trump’s term. Here’s our average at FiftyPlusOne.news, Strength In Numbers’s new sister site for publishing polls and averages:
This story is repeated for Enten’s analysis of the generic ballot. He says Democrats are up just 2 percentage points in the generic ballot today, which is allegedly the same as their lead in the polls ahead of the 2024 elections. “The American public is pretty much steady,” Enten says. He empirical evidence for this is 4 polls from 2 pollsters.
Let’s look at more than just 2 polls, though. I can’t access the old FiveThirtyEight polling average, but according to an average of many additional polls from RealClearPolitics (which I only recommend when other data isn’t available), Republicans led by roughly one point in House popular vote polls heading into Election Day 2024. This makes for a 4-point swing toward Democrats since the polls in October 2024, Enten’s point of comparison — and a 5-point swing since Election Day (Republicans won the House by 2 points).
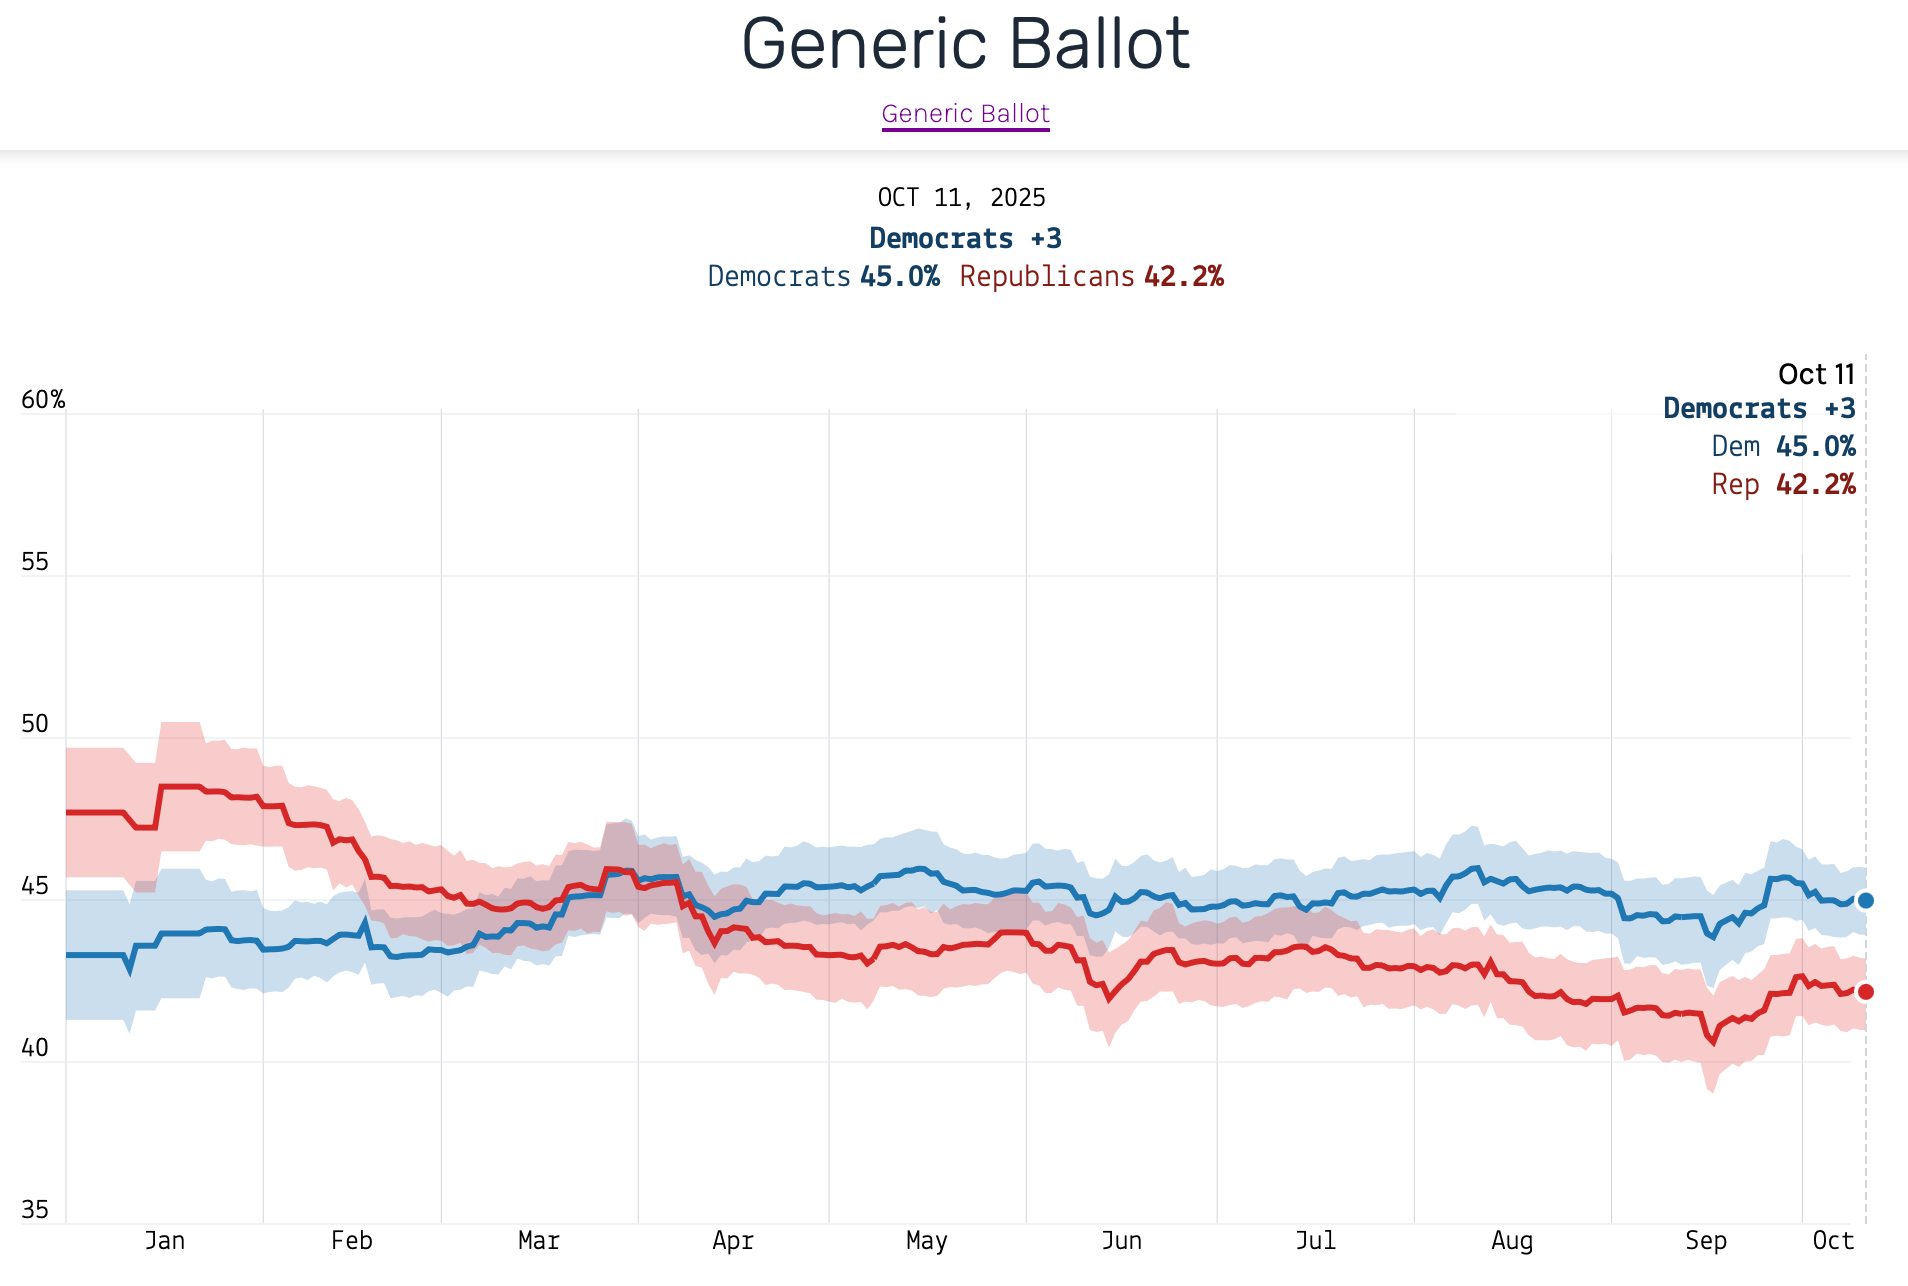
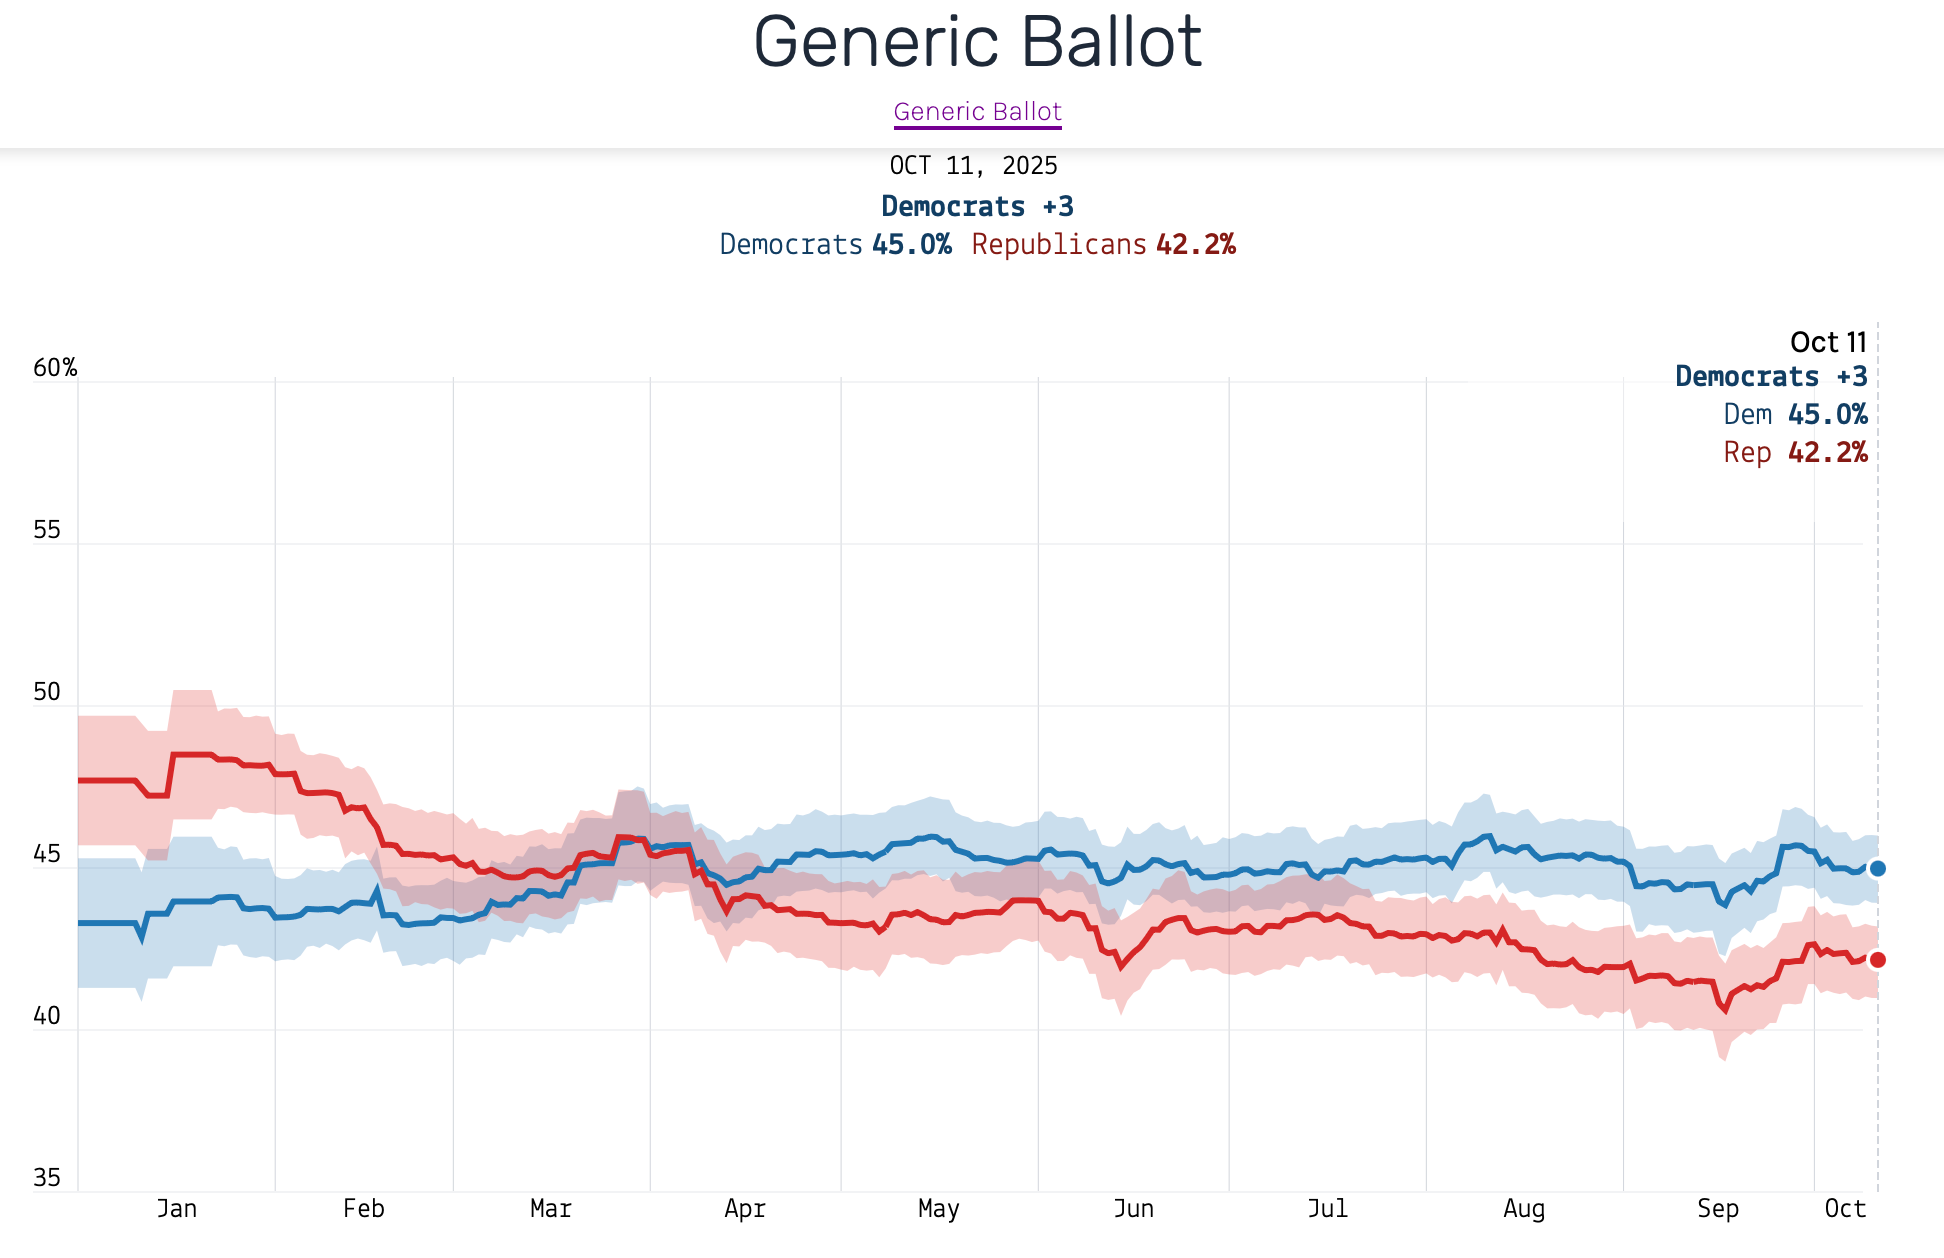
But then, consider that our average of polls at 50+1 shows a 7-point swing away from Republicans on the generic ballot since the start of Trump’s term, when the GOP was up 3 vs Democrats:
After looking at the polling averages for Trump’s approval and the generic ballot, I think the segment suffers from its lack of a holistic view of the data.
Now for the “doing what he promised” thing. This finding is from a CBS News/YouGov poll conducted from October 1–3, 2025. Yes, 52% of Americans say they think Trump is “doing what he promised.” But Enten implies that this is somehow a rosy figure for “Steady Eddiie” Trump.
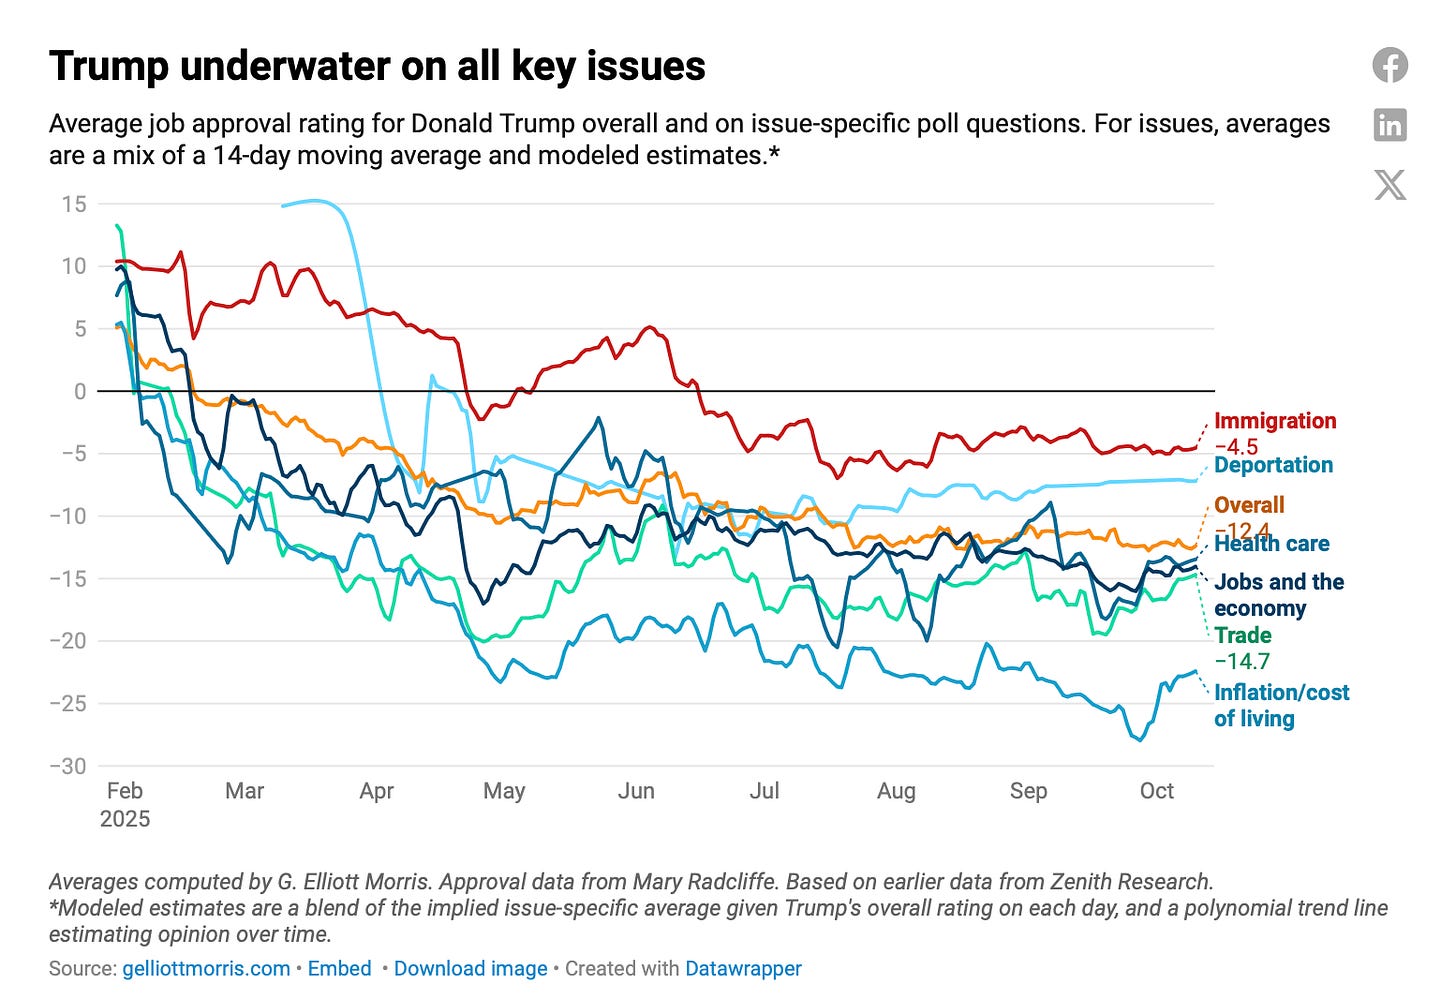
I have two issues with that interpretation. First, contrary to the implication from Enten, many people think Trump is “doing what he promised,” and they do not like it. We know this is true because in the same YouGov poll he’s citing, 58% of adults said they disapproved of the job Trump is doing as president. Additionally, 51% said that Trump’s actions on the economy are making them financially worse off, and the president is perceived as being on the wrong side of most major policy issues — including inflation, which is the reason he won the election!
Looking through this whole report, the single number Enten cites in his segment is basically the most pro-Trump number in the poll.
The second problem with this part of the segment is the presentation that this figure is good for Trump since it’s over 52%. But since the directional informational content of the question is low (you can agree that Trump’s doing what he promised in both a bad and good way), the implied 50% benchmark is nonsensical. Would it be better for Trump if 100% of people said they thought he was doing what he promised? Is it also maybe bad that 48% think he’s breaking his promises? This is important context to share with viewers about the question.
Polling journalism on TV
I’ve also been viewing this segment in the broader context of Enten’s (increasingly frequent) appearances on CNN to do these poll reports. Data on TV is good! Put more data on TV! But my impression of his appearances is that they are mostly rather hyperbolic. On any given day, according to Enten, the sky is either falling for Trump or he’s destroying the competition.
From my short experience with television news, I can say there is a broader tendency in the industry to sensationalize findings to keep viewers engaged. And that’s just baked into the business model. TV is funded by ads, and you only sell ads if people are watching your program. You really have to sell the numbers to all the grandmas watching cable news, or they’re going to change the channel.
But the problem with public opinion is that, most of the time, changes are slow and the story is pretty obvious, and often boring. A segment that says Trump has been slowly losing ground since the start of his presidency, and Republicans are probably heading for a midterm loss, is not going to hold an audience for long. That’s why we get more high-octane coverage of these trends.
A boring, accurate segment is also not as controversial, which is better for clicks from social media. Neither is it all that appealing to Republican, especially compared to a segment implying voters are happy with Trump. And that’s why Karoline Leavitt tweeted it out.
What you missed at Strength In Numbers
Subscribers to Strength In Numbers received five articles over the last seven days. That’s more data-driven politics content than you’ll get almost anywhere else!
Last week’s roundup of shutdown polls:

A long essay on why most polls exaggerate support for political violence:

My announcement of our new polling website at FiftyPlusOne.news, and discussion of what it means for Strength In Numbers (there will be no disruption to editorial operations, the polling average charts just move to a new URL):

My Friday Chart of the Week on how voters view Trump deploying the National Guard domestically:

A podcast interview with my friend Chaz Nuttycombe discussing the state of play in Virginia’s 2025 elections:

Every day is a good day to become a paid supporter of Strength In Numbers. You get extra premium posts at least once a week (and, lately, more like 2-3x a week), an early look at any data products I’m developing, access to a private Discord server just for paid members, and more. Paying members also support all the work that goes on behind the scenes to put together the SIN/Verasight poll, my state and congressional district MRP models, and all the other analyses that power my journalism.
Even more numbers!
A collection of links from the last week:
Christian Paz for Vox: “Are Trump’s voters turning against him?” (Full disclosure: I gave Paz an interview for this piece.)
Short-term inflation expectations are rising
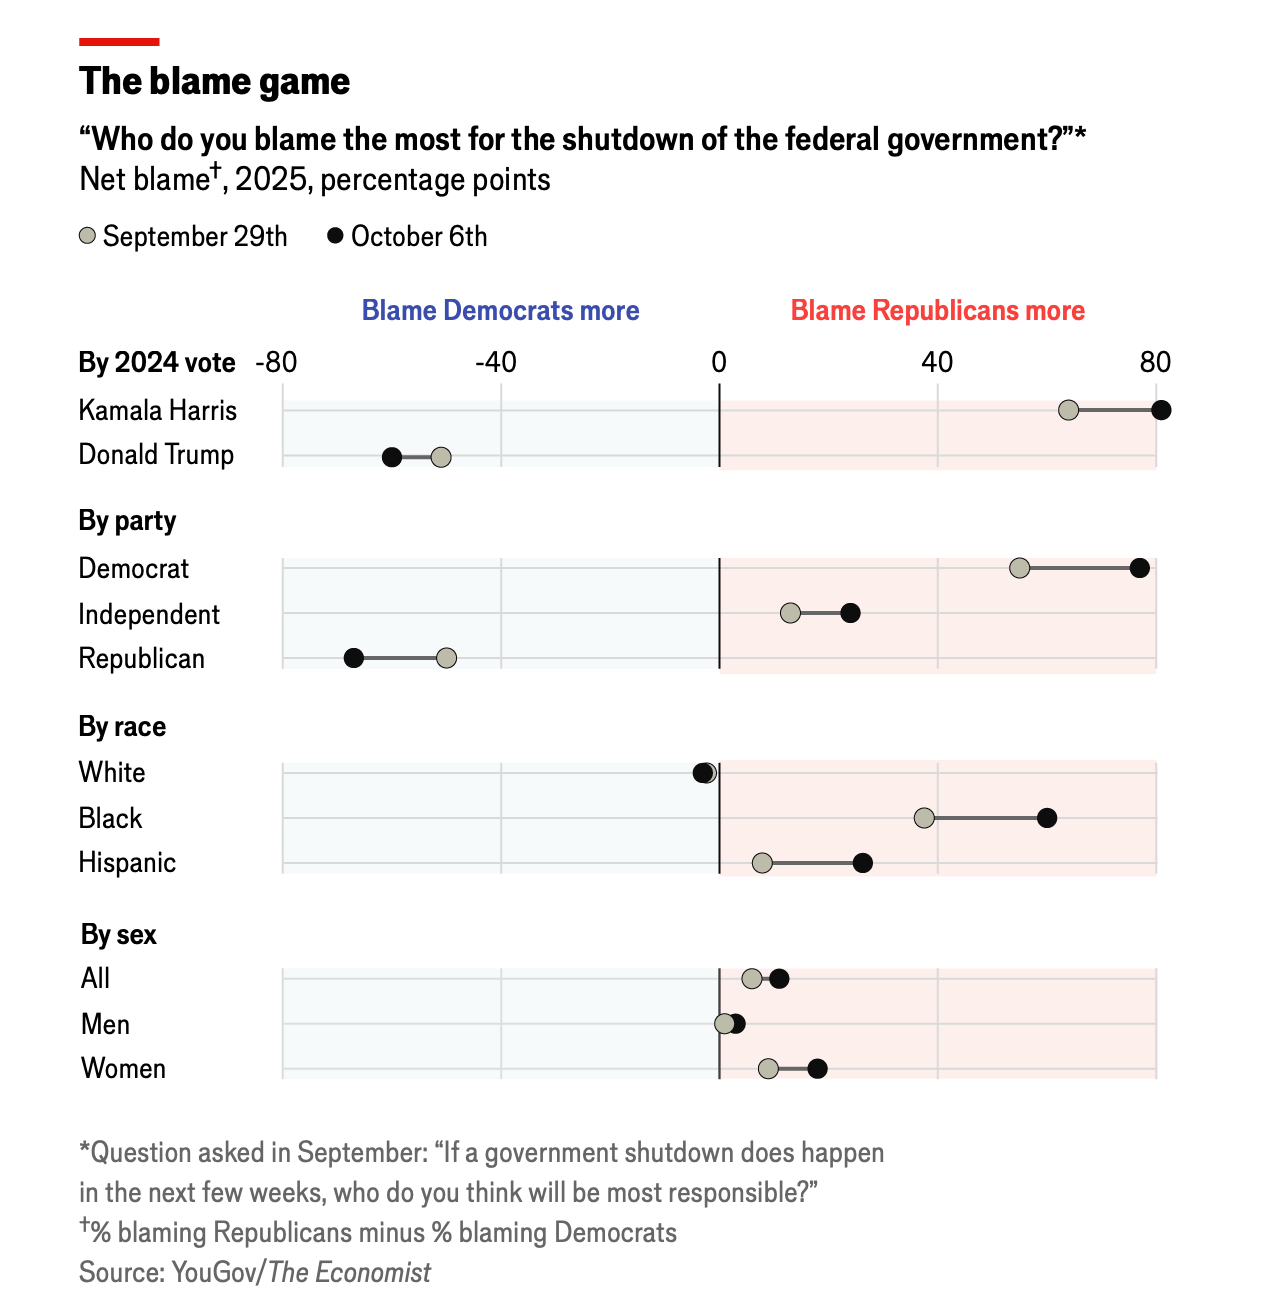
Reuters/Ipsos uses a new polling question on the shutdown, finds voters blame everyone in Washington for the funding lapse (even if they blame Republicans more)
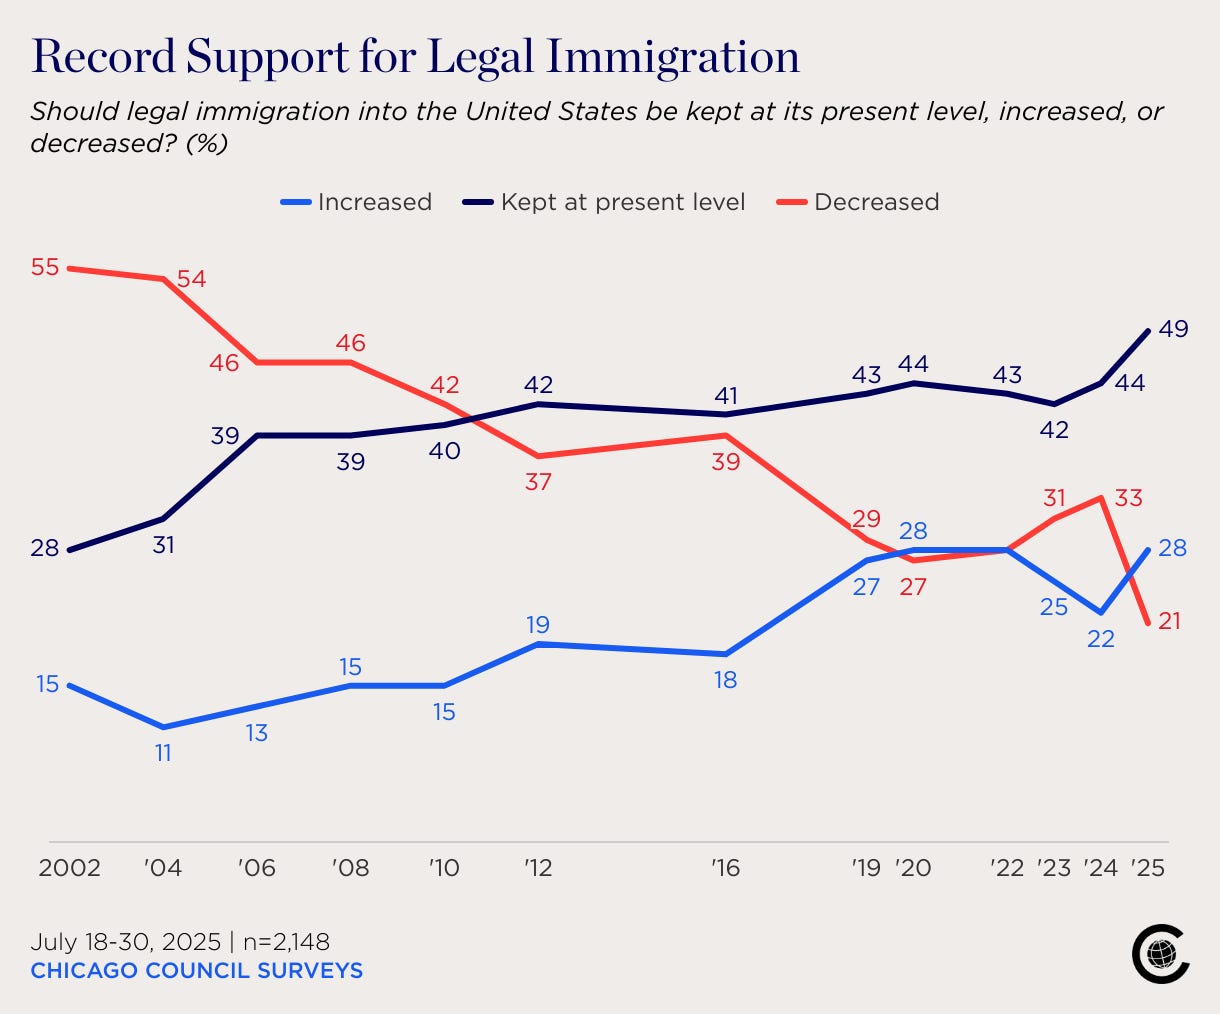
The Chicago Council finds an all-time low in the percentage of U.S. adults who want to decrease the level of immigration into the United States. This is the latest in a series of surveys finding a thermostatic move left on immigration:
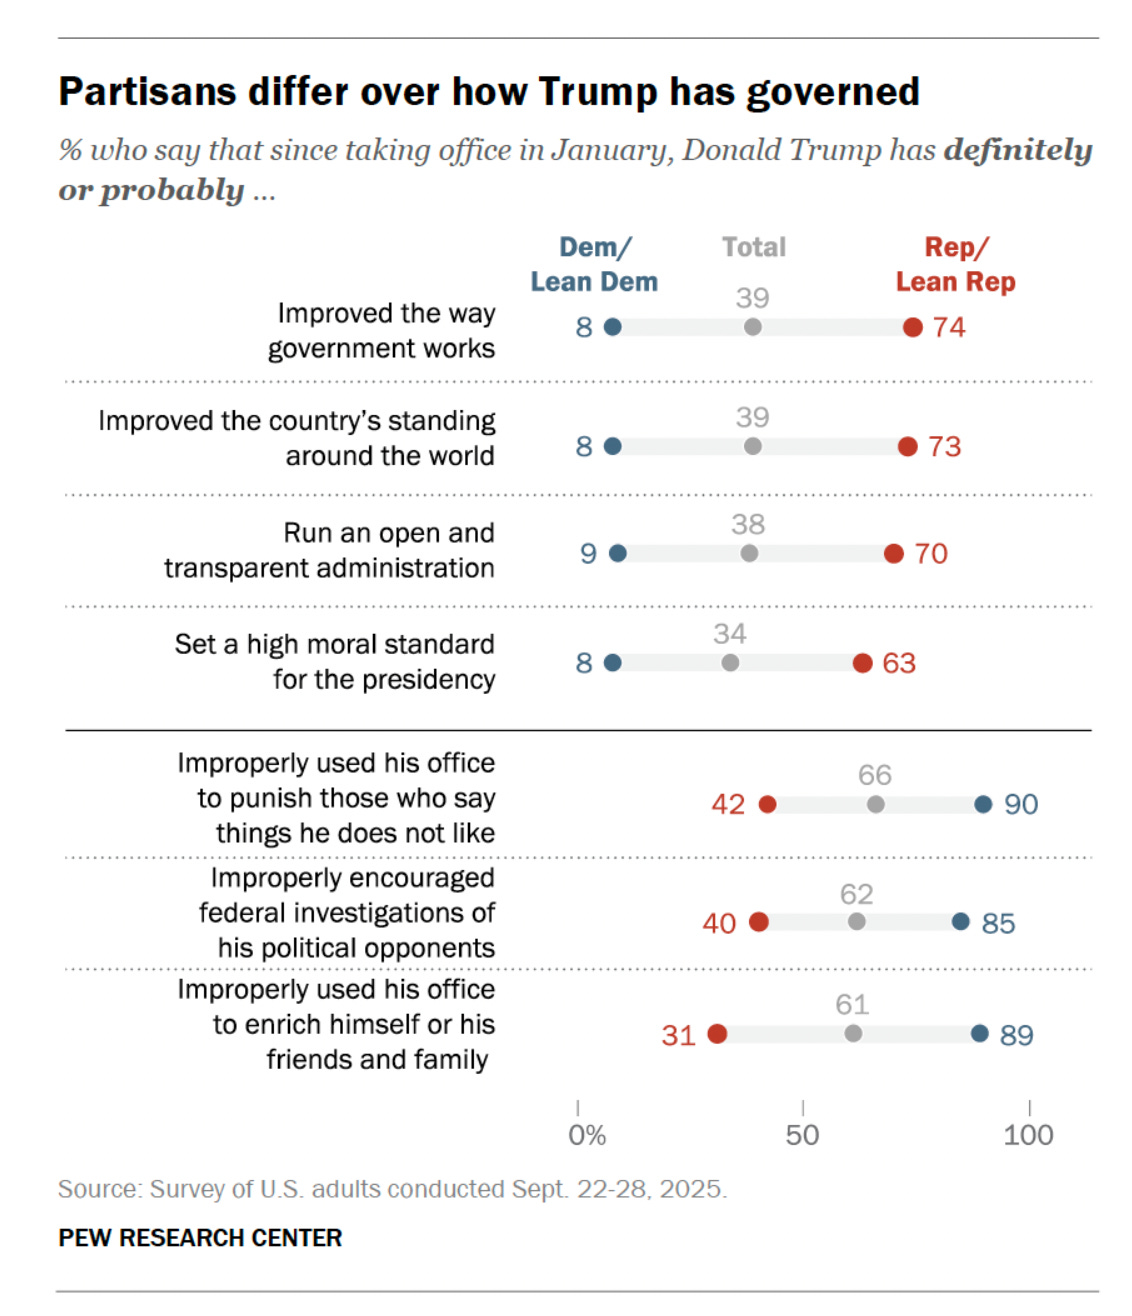
New data from the Pew Research Center finds majorities of adults think Trump is exceeding his powers as president, including 31-42% of Republicans (depending on the question):

Pew also finds that voters have a net unfavorable view of Trump, JD Vance, and party leaders for the U.S. House, and Senate.
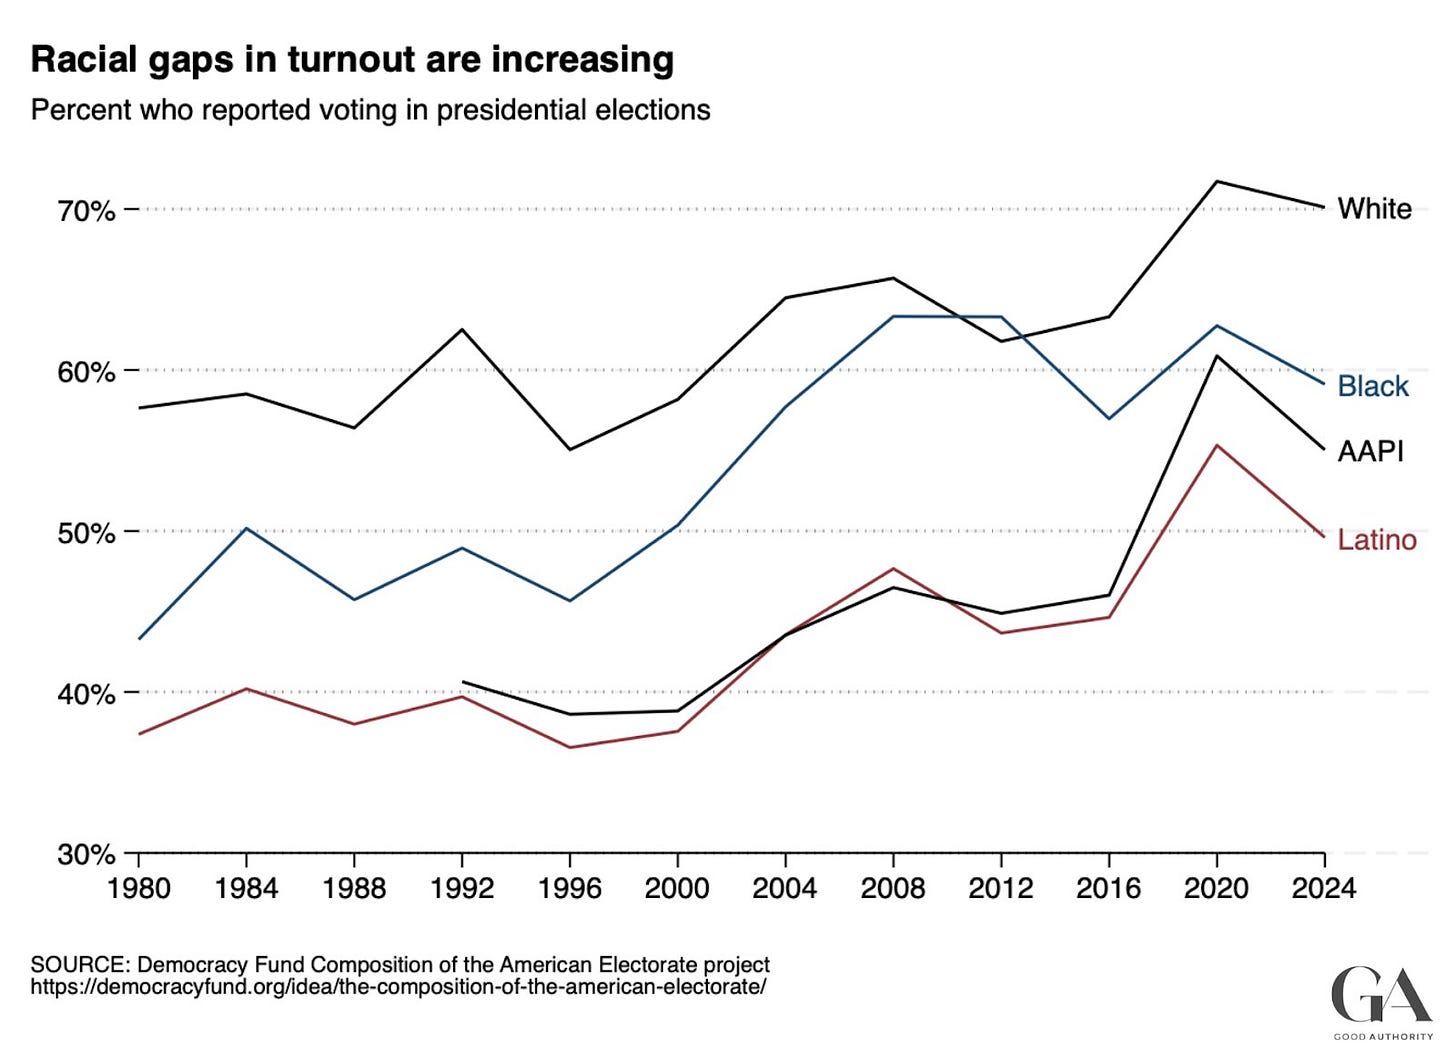
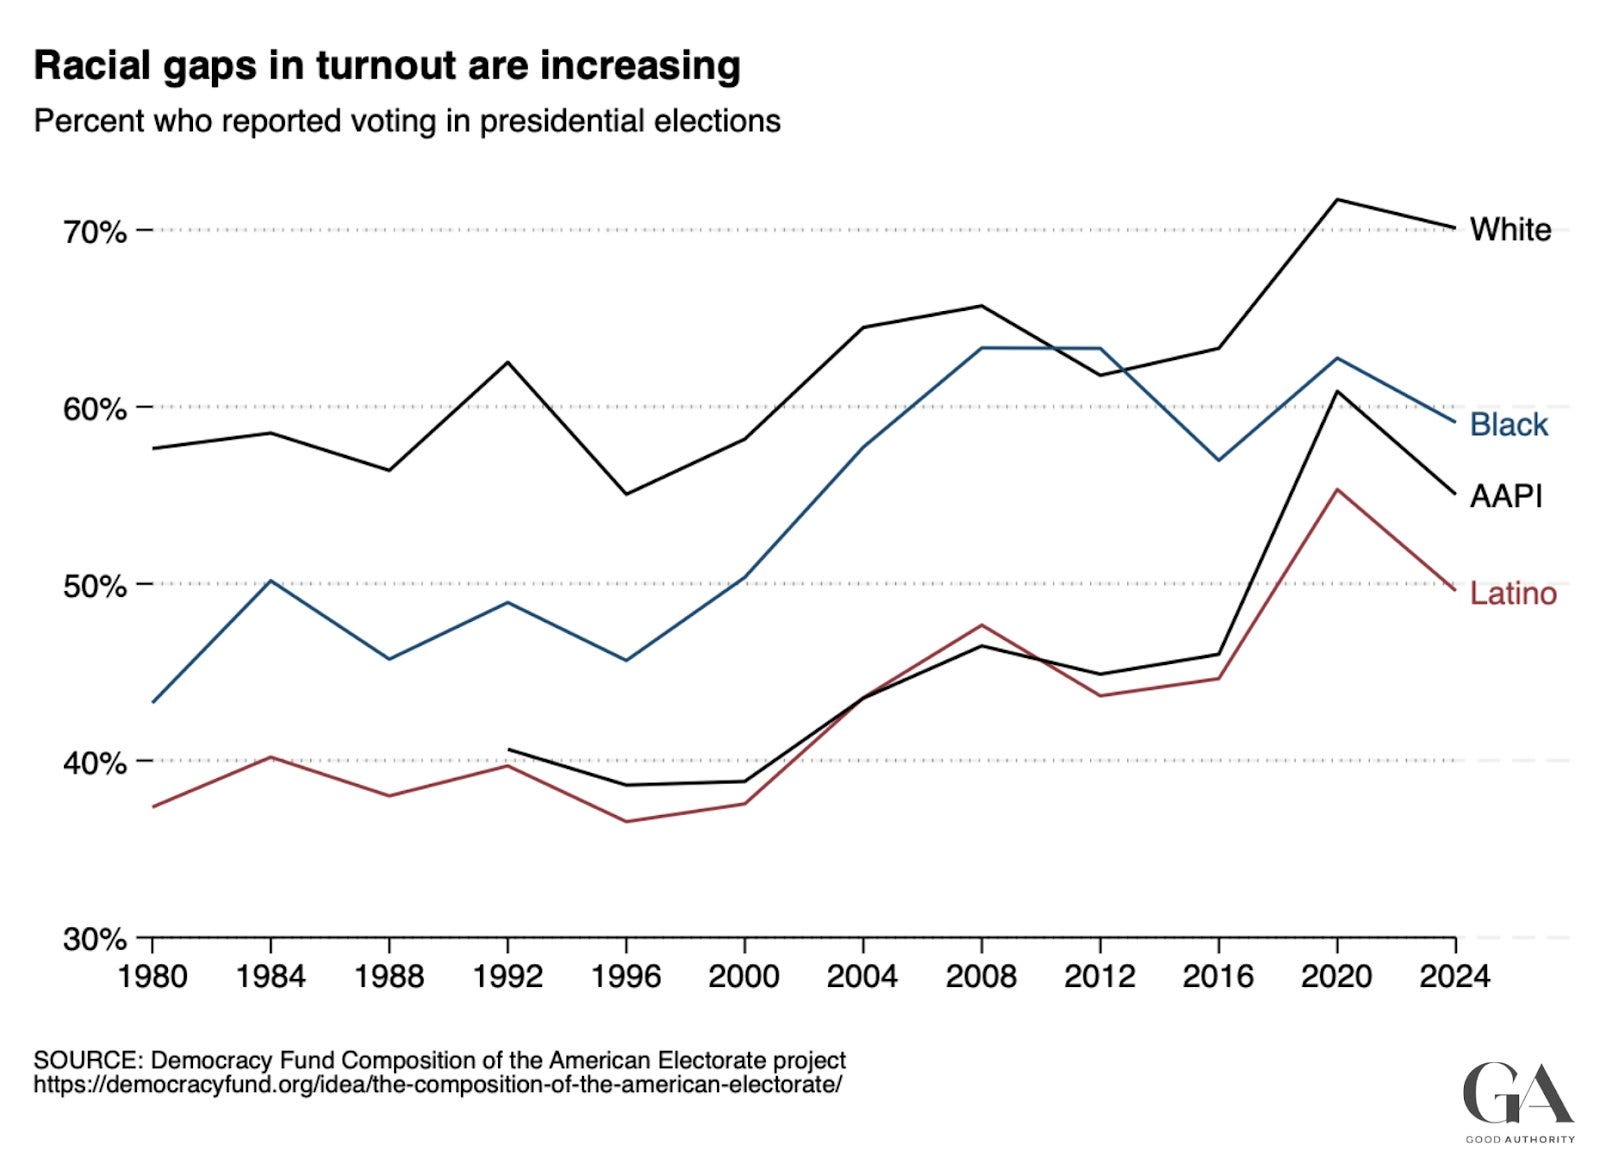
Political scientists Robert Griffin, Chris Warshaw, Devin Caughey, and Bernard Fraga look at voter file and other data and come up with new estimates of turnout among key demographic subgroups. They find that racial difference in turnout grew in 2024:
Also at Good Authority: “The Populism Horseshoe”
The Economist shows that the percentage of Americans overall, and political independents, who blame Republicans more for the shutdown has risen over the last 2 weeks:

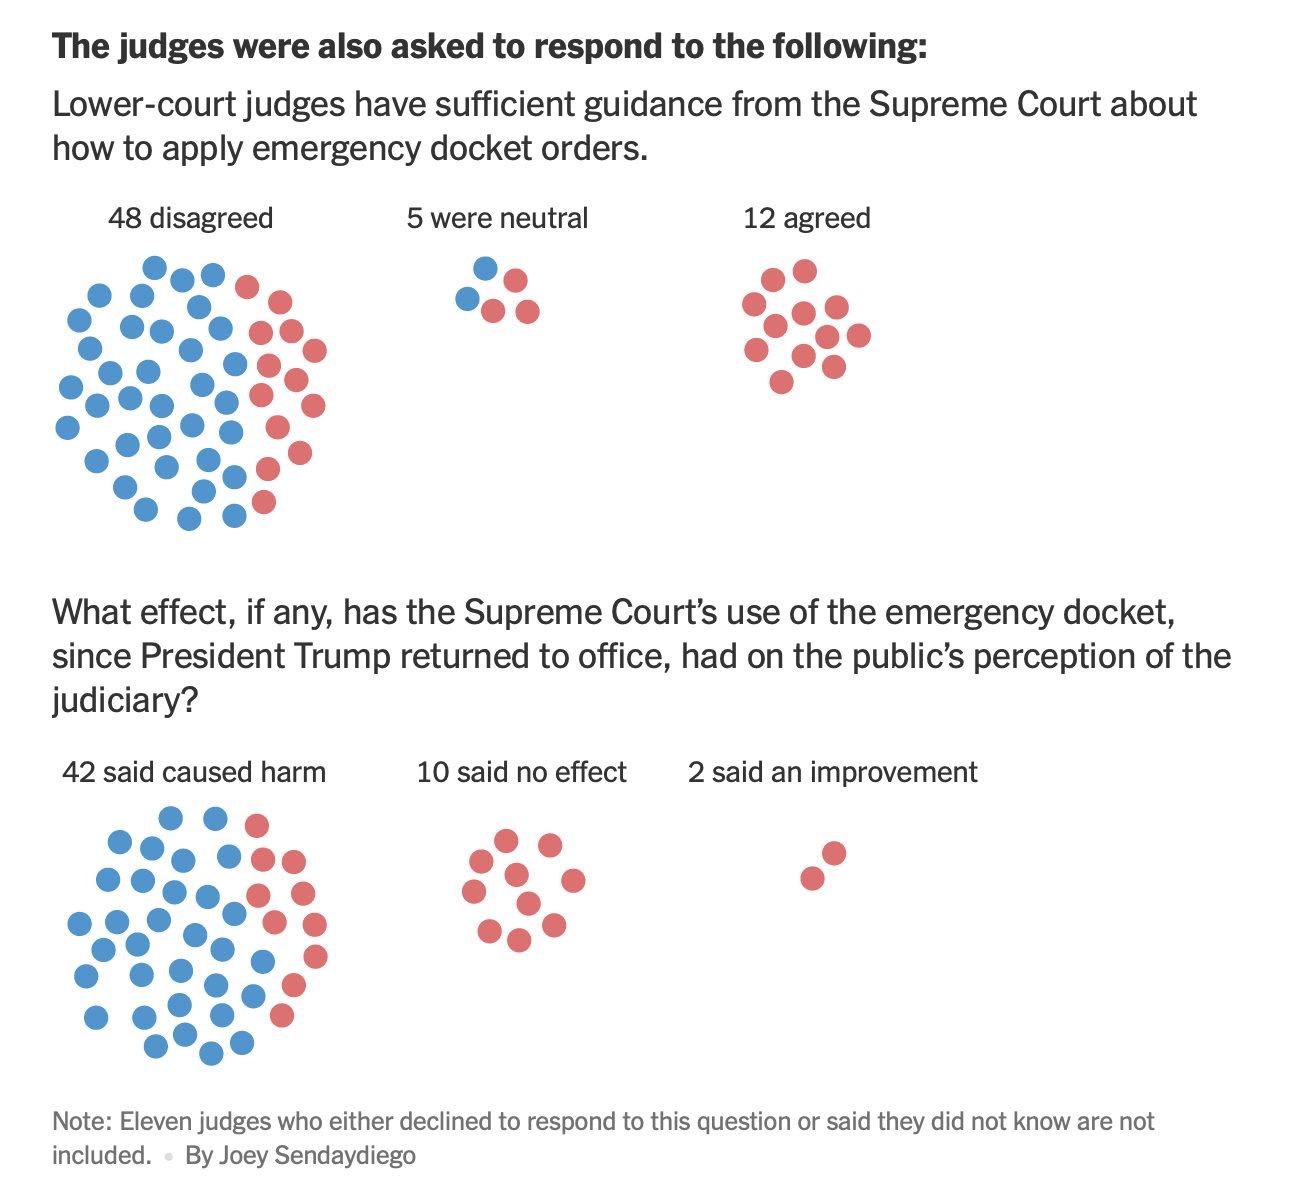
Finally, The New York Times sent a questionnaire to hundreds of federal judges asking about the effect of the Supreme Court’s actions during Trump’s second term. The survey reveals deep worries about SCOTUS’s use of the emergency docket:


Share any other links that caught your eye in the comments below.
Polling update
This week, the Strength In Numbers polling averages moved to a new webpage at fiftyplusone.news, a website purely for poll-tracking that I’ve set up with my friends. I’m including screenshots from our new site here to drive traffic and awareness:
Trump approval:

House generic ballot average:

Some other charts on the data portal will remain there until we can replicate them on the new site:
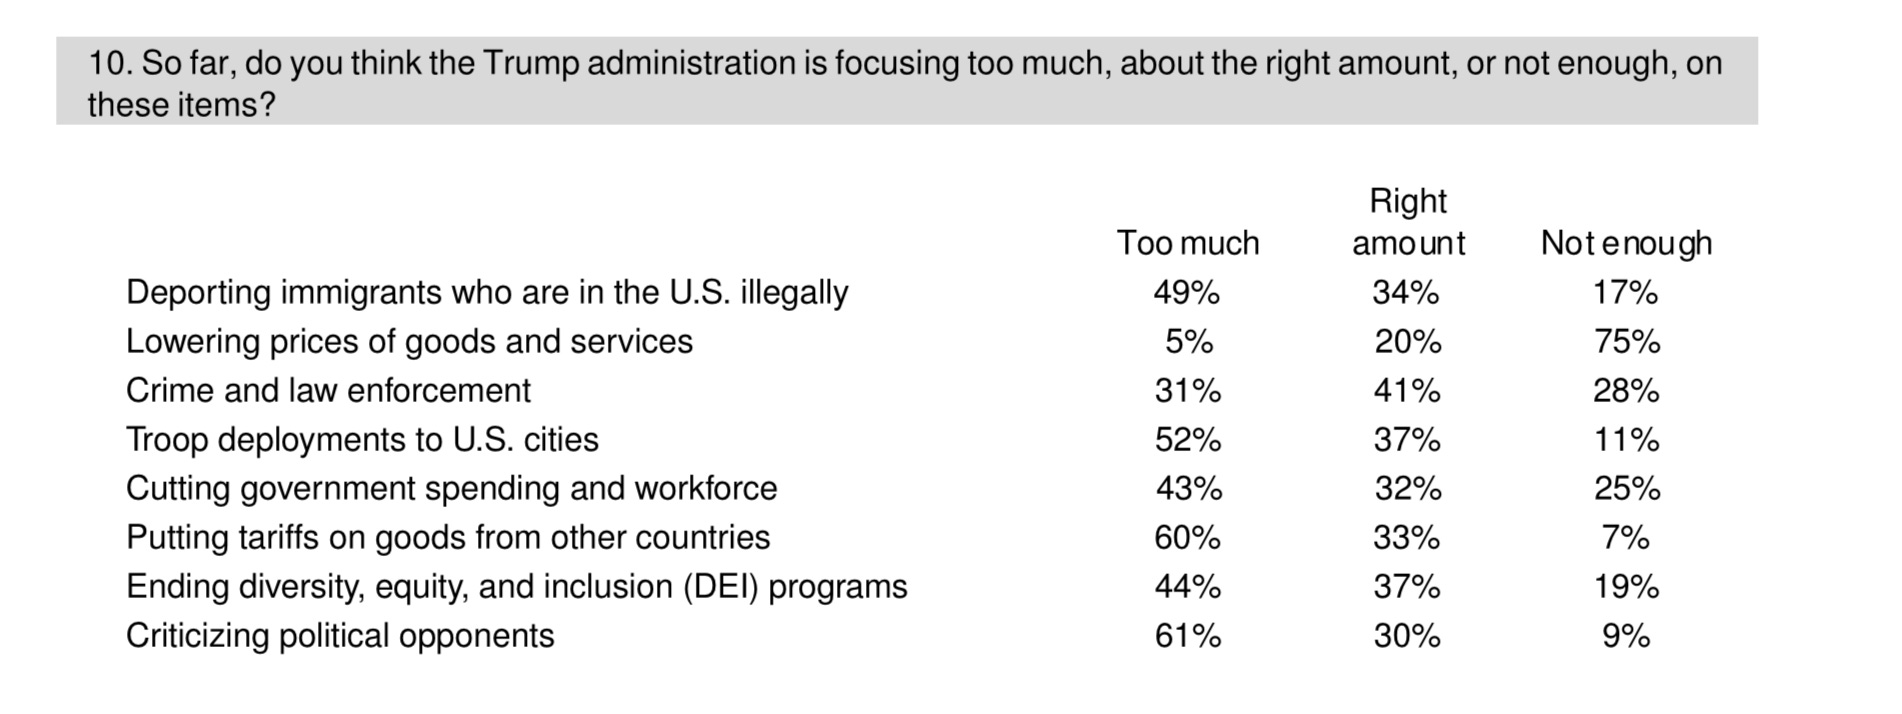
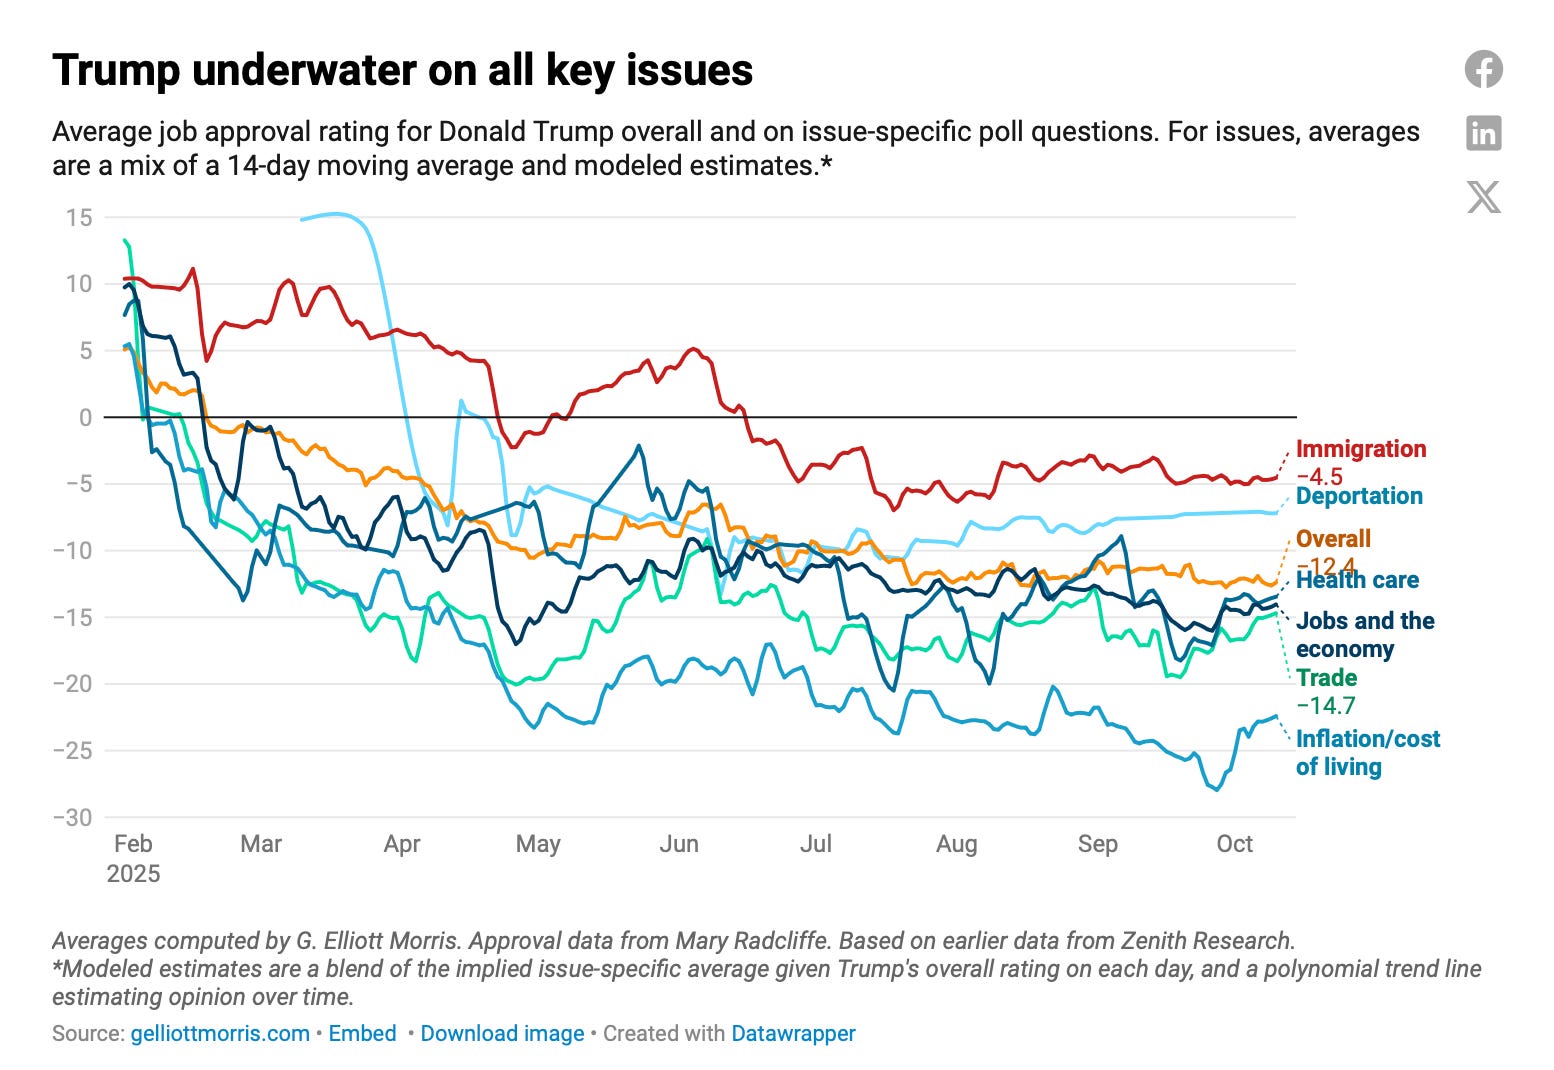
Trump issue approval:
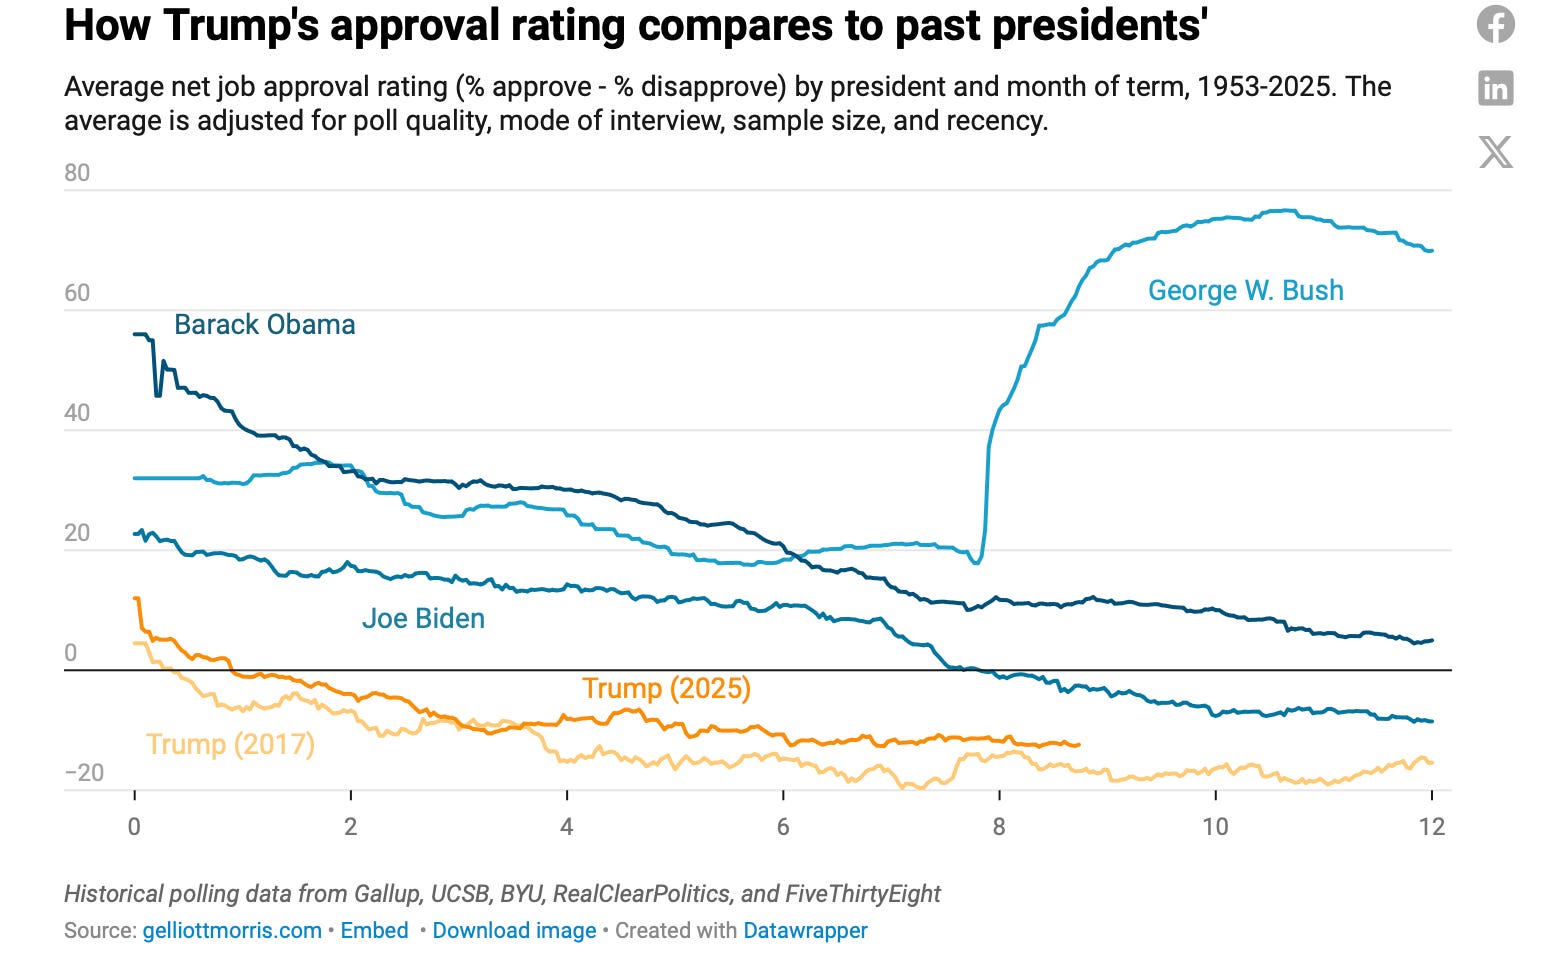
Trump compared to past presidents:

That’s it for your major political data stories this week.
Got more for next week? Email your links or add to the comments below!
Have a nice week,
Elliott
And here is some follow-up data from the CBS News/YouGov polling team:
"30% of those who say Trump's doing the "same things he promised in the campaign" disapprove of his job handling
Also notable: that "things he promised" topline has been falling, from 70% at the start of his term to around half now
Largest drop has been with independents (-24 pts since Feb)"
https://bsky.app/profile/kabirkhanna.bsky.social/post/3m2z2fsdgas2c
Looking at the crosstabs on that CBS poll from last week, it also seems as though the "doing what he promised" question is kind of a partisan mirror - D 29/71, I 47/53, R 82/18. Given that I'd assume more than 30% of Democrats truly are not surprised by what he's done, I wonder if this question is vague enough that it just becomes "Yes = good for Trump, No = bad for Trump" and it breaks out that way.
If you assume people are giving answers that reflect thoughtful opinion and not partisan bias, the through-lines on these crosstabs get funny. On the economic better/worse/same question, Democrats are 3/83/14, which put together with the prior answer suggests that Democrats feel Trump has made them worse-off economically... and that has surprised them, since they expected him to do the opposite? Similarly, 47% of Republicans said his policies have kept things the same for them economically - a situation they hated Biden and Harris for putting them in - but they voted for him thinking he'd keep them stuck in it?
It seems to me that the "did what I expected" question doesn't carry much meaning for respondents, who treat it as just a good/bad on Trump without engaging. Meanwhile the "made my economic situation better/worse" question has some implications to it - surely, 47% of Republicans did not believe in November 2024 that Trump wouldn't improve their economic situation at all, so what does it mean that it's the best they can say for him now?