

One year of Strength In Numbers!
Short reflections on the business so far and an update on what's to come this year

Hello readers,
As of today, May 11, 2026, it’s been one year since I launched Strength In Numbers to be the new home for my data-driven writing, political analysis, election forecasting, and independent polling.
When I started this publication last year, my email list numbered just 6,000 readers (though many of those addresses were collected in an earlier, then-dormant version of this newsletter, and I was not hopeful they’d stick around). Along with the personal strife caused by the fallout over Disney shutting down FiveThirtyEight, I was pretty pessimistic about things, with little hope that this would be enough to pay my family’s bills and work as a new career for me.
Oh, how I was wrong. In this piece, I recap the first year of what you all have helped build here at Strength In Numbers, and share a few updates on what’s coming in the next one.
Reflections on the first year
First, consider the numbers. Thanks to the generous support and engagement of this community, the last year exceeded even my most optimistic projections for this publication. In terms of metrics, SIN today reaches 68,000 inboxes on a semi-daily basis, and even more via news aggregators and social media traffic (which is dwindling, but still pretty strong on Reddit and Bluesky). Growth is a steady 3-6% each month. Since last May, SIN has not had a negative week in terms of total audience, paying readers, or revenue.
Even better than the quant metrics, I think qualitatively what we’re working on is some really cool and necessary political data journalism. Our monthly poll with Verasight is now cited frequently alongside other “traditional” media surveys (actually, newsletters are more “traditional” than cable television!), and I’m building a suite of interactive data projects that help readers understand polls, election forecasts, demographics, and so on.
SIN has also been early and right on the big stories. I caught Trump’s slide into deep unpopularity earlier than most outlets, documented how latent opinion on immigration and ICE turned hard against the administration months before the conventional wisdom caught up, and overall, we made a serious empirical case that the public wasn’t on board with the current administration’s most aggressive moves. Remember that early in Trump’s term, the media was still writing about how Trump had a “mandate,” and his election was evidence of a permanent “realignment” in American politics away from the Democratic Party.
And from a data products standpoint, this publication is heavily differentiated from what you will find elsewhere in political journalism right now (in business speak, we say SIN has a “good moat”). The MRP model for public opinion on tariffs from last August is still some of the most technically ambitious work I’ve published, and the kind of thing that was also hard to get buy-in for in a newsroom environment. The geographic opinion modeling is now a regular feature of coverage, and I’ll be expanding it soon (more on that below). I’ve also been doing this job for so long that I have data and code for pretty much every story hoarded away somewhere on my computer, which means SIN often reacts faster than other outlets to the big stories on elections and democracy.
Finally, the podcast with David has also genuinely surprised me in two ways. First, more people than I expected listen weekly — about 2,000. Second, I expected it to be a chore. It’s become one of the most fun parts of my week. We did our first live show in April, and nearly 100 people signed up for that too. I’m biased, but in terms of content quality, quantity, and diversity, I think what we’re doing here at SIN is pretty close to the Pareto-optimal for an independent political media startup today.
All of this is to say — across multiple metrics, Strength In Numbers is now a healthy business that (again, I’m biased, but IMO) punches far above its weight. I am grateful to all the members of this community, who make it possible for me to focus my attention on this journalism and push the envelope of what’s possible in the media today (you may have heard, it’s pretty ugly out there).
And I owe a particular debt to the paid subscribers who have turned this corner of the internet into a sustainable career for me. Every paid sub makes a big difference to the bottom line and makes more work possible. And that’s not a marketing line, that’s the actual math of how SIN works: for example, data storage and computer server costs are sustained by a couple of dozen paying subs monthly; a bespoke poll costs about 30 annual subscriptions; a week of my time “costs” about 30, etc.
If you’ve ever clicked the upgrade button, gifted a subscription to a colleague, or forwarded a post to a friend: truly, thank you. You directly helped make this possible, and own a portion of its success!
New products and programming notes
So with that look back, here’s a look forward. There’s a lot of business news to announce, and I didn’t want to send three different posts to your inbox in one day.
Below are two important flags about new and upcoming data projects I’ve been working on, and an important note about my schedule this summer.
First, I’m launching a new data product called Strength In Numbers Pro
I’ve been working on a new polling data platform for a few months that I’m happy to share publicly today. It’s a self-serve data portal for political professionals that distills polling data to the state, congressional district, and local geographic level using a dynamic MRP model, and it’s available starting today at pro.gelliottmorris.com.
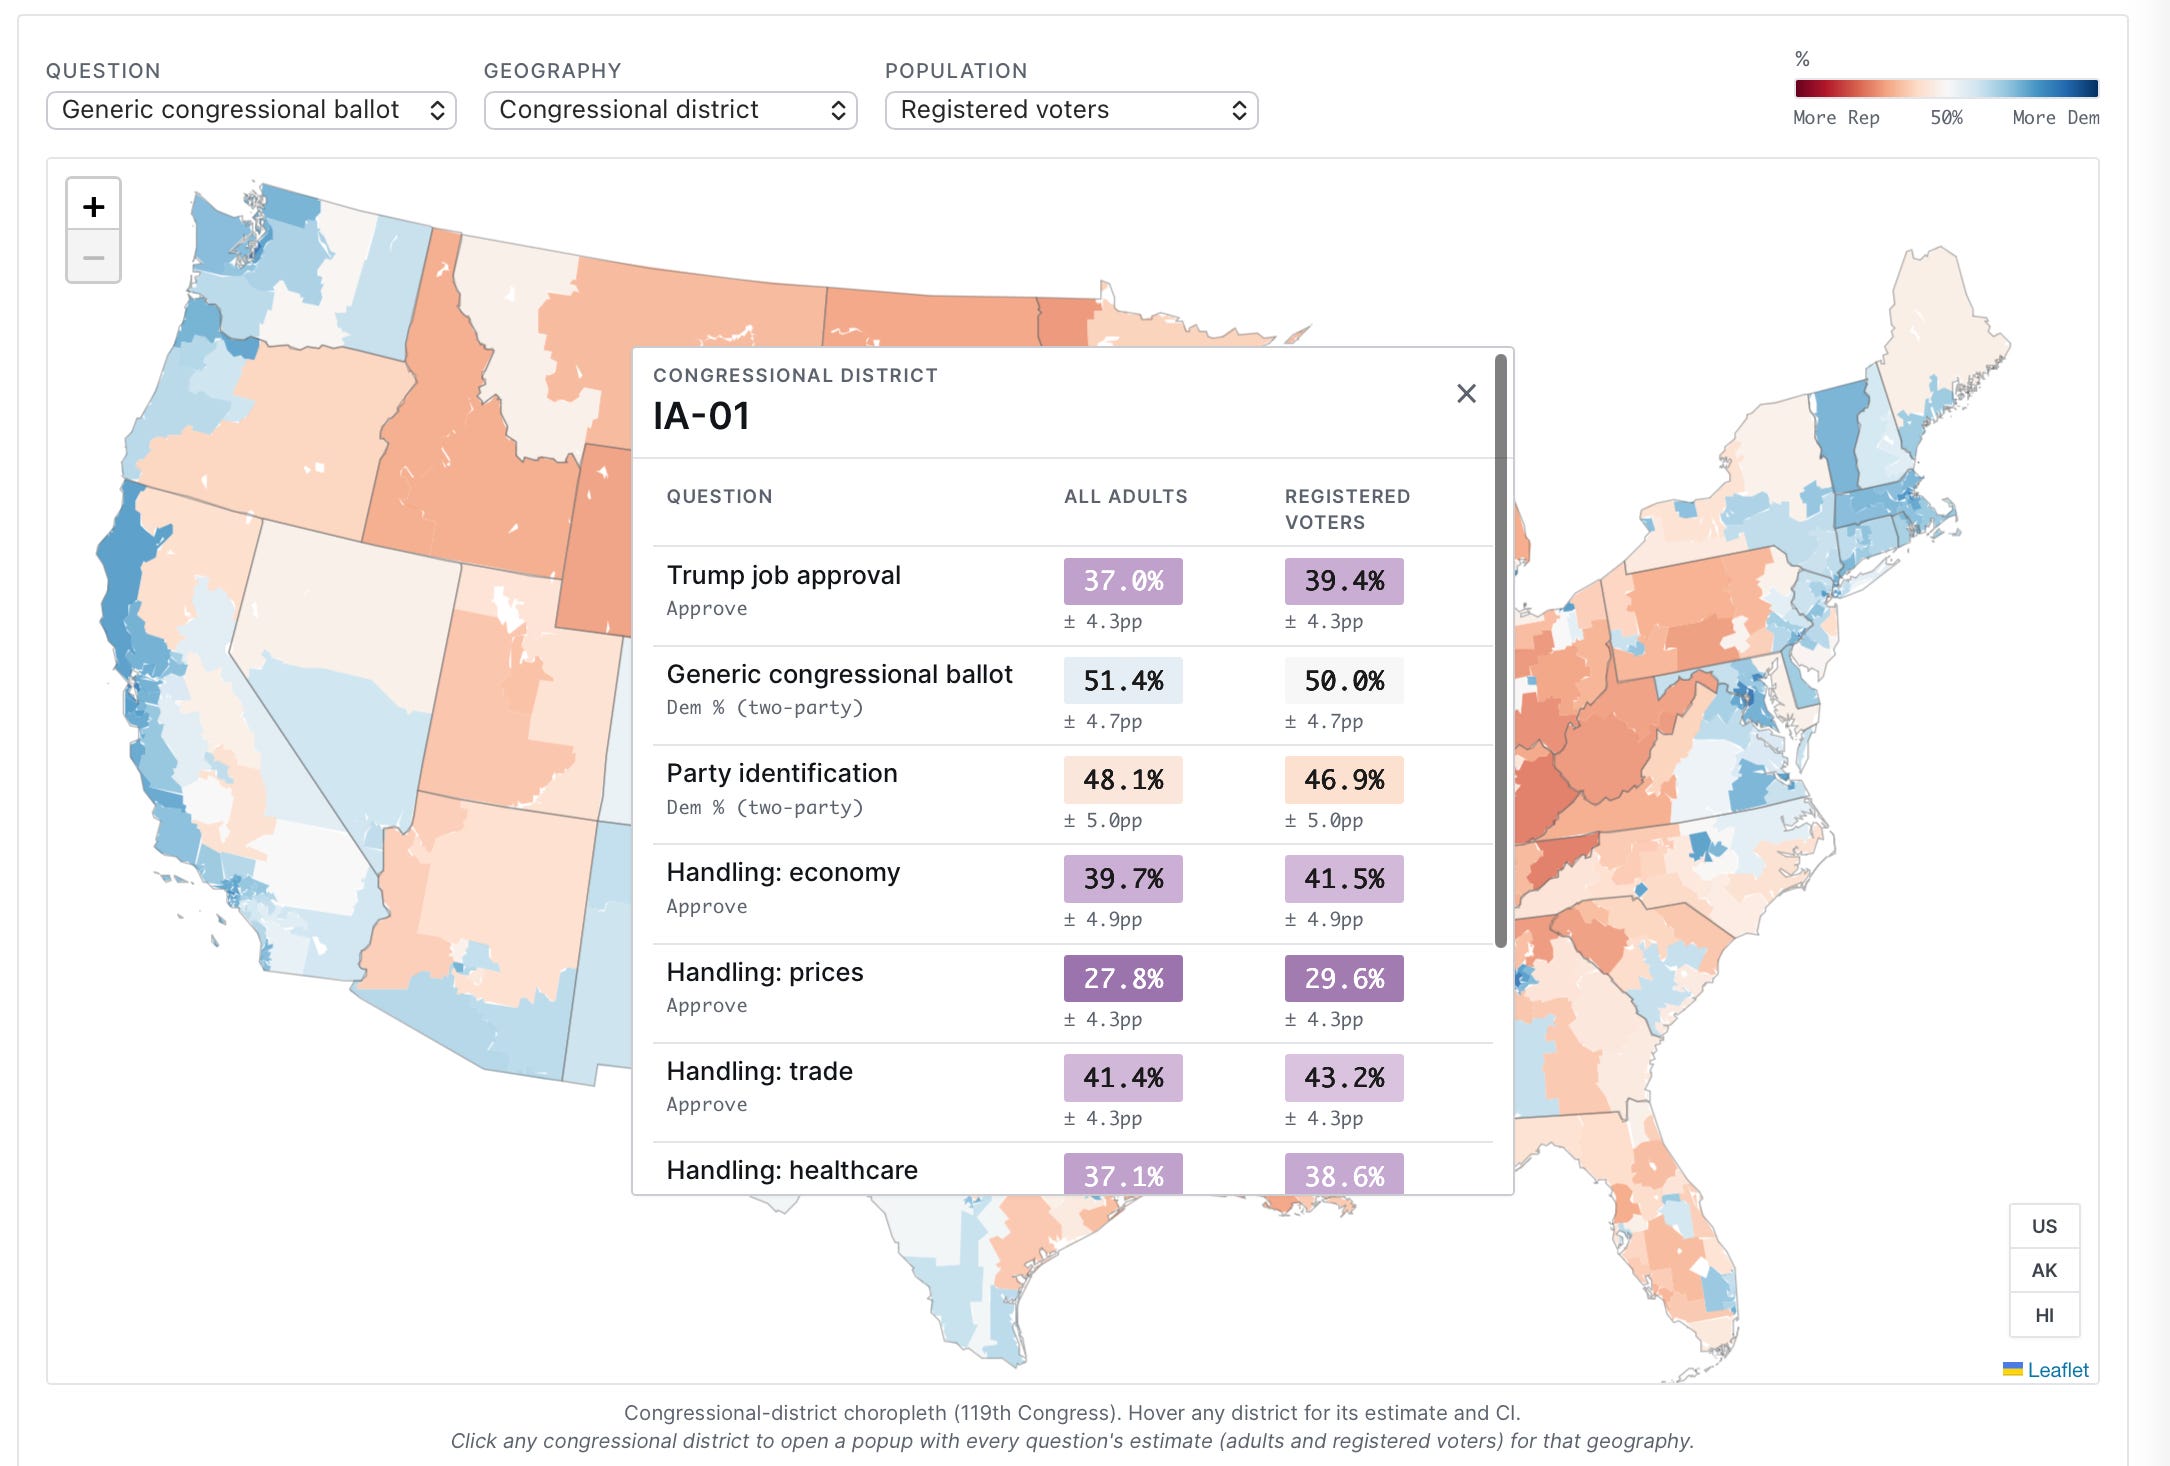
SIN Pro is targeted at politics professionals working in data services, campaigns, independent expenditure groups, foundations, corporate political risk teams, advocacy organizations, and really anyone else who needs public opinion data for a wide variety of questions and geographies on demand. If you need up-to-date polling data in a certain state, county, or congressional district, this should be your first stop.
I built SIN Pro with the same methodological rigor and transparency that I bring to everything else here at SIN. The modeling pipeline is fully detailed for subscribers and inspired by both academic research and a decade of my practical experience in polling and forecasting, and built using high-quality data (polls of real people, not AI). There are no black boxes, no vibes, and no proprietary “secret sauce” that covers up errors other pollsters and analysis shops run into. SIN Pro uses the data methods I’d want to see if I were on the other side of the table, paying for the numbers. (Currently, SIN Pro is powered by the same raw data behind our monthly collaboration with Verasight, but for redundancy and diversification of sample, I’m adding more providers to that pipeline soon.)
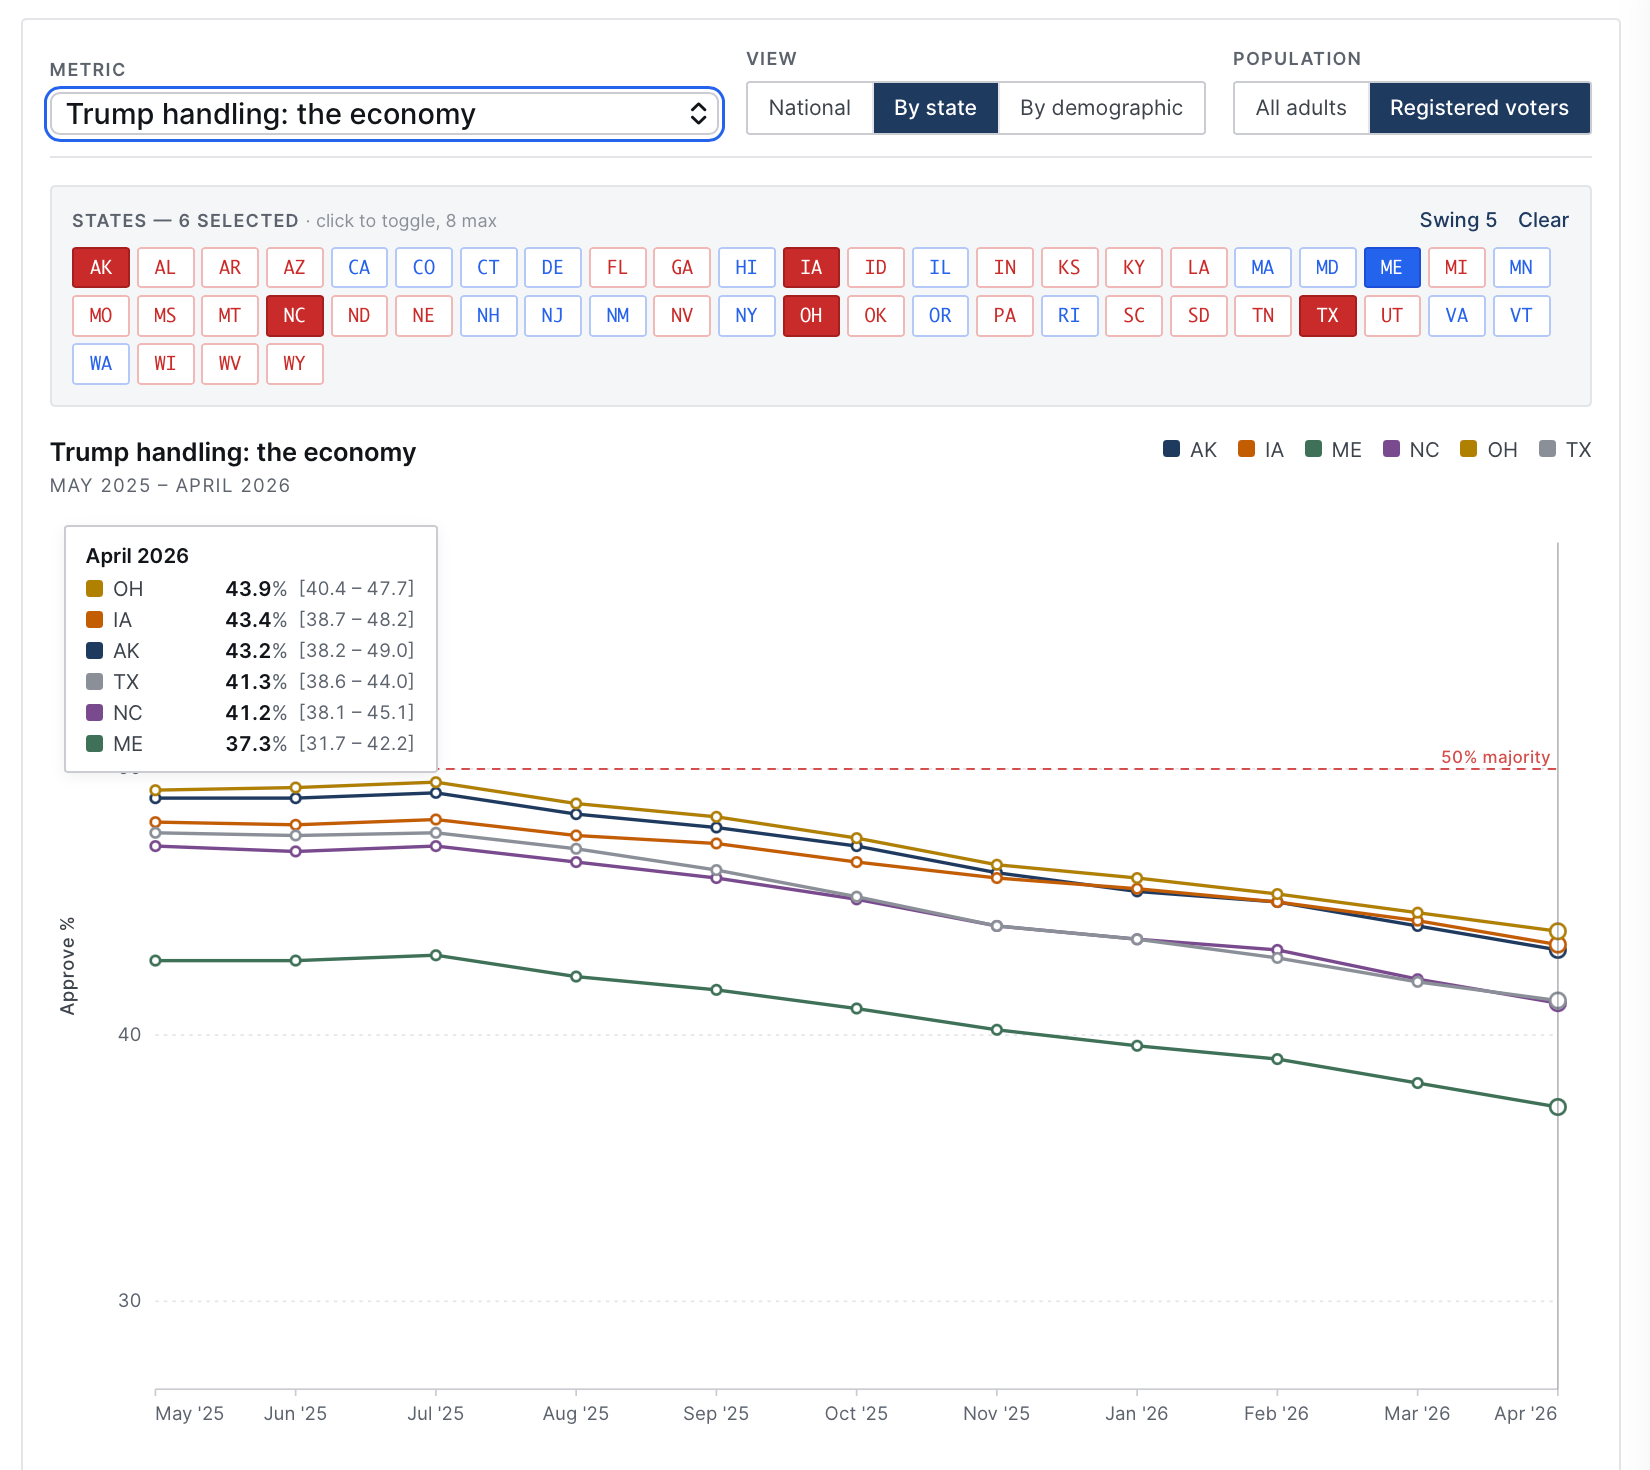
Pro is a natural extension of the editorial work I do here every day. Strength In Numbers the newsletter is for any reader who wants to better understand U.S. politics using data and hard math. Strength In Numbers Pro is for the people who also want access to that data or deeper consultant-level insights about the state of politics right now. If you work in politics professionally, take a look. We have trend lines of stuff like Trump approval, the generic ballot, party ID, party trust to handle voters’ most important problem, and more at the state and demographic level, and distill it all down to the county level. You can download all these estimates for whatever you need.
The hard pitch to clients is the following: Due to the sophistication of the modeling effort behind the scenes, this is both cheaper and more accurate than trying to do a traditional poll of a small geographic area. The national and state-level trendlines are also more accurate than for most other pollsters, too (other firms jump around a lot more due to weighting problems and non-sampling error). Again, the idea is if you are working on a project about public opinion at the state, CD, or local level, SIN Pro should be your first (and maybe last!) stop; either we can answer your question directly, or give you data to help improve your project at the start (say, identifying the cities that are most anxious about the impacts of Trump’s tariffs).
Initial pricing is $50/month or $500/year, which is what some other political analysis publications charge for delivering a lot less. If you would like to try it out, head on over to pro.gelliottmorris.com. Prorated refunds are available for your first 30 days.
Second, the timeline on my midterm elections forecast
Over at FiftyPlusOne.news, we’re probably on track to publish our 2026 House and Senate forecasting models in early June. The model itself is actually mostly done; the harder problems are (1) solving all the edge cases that appear in the infrastructure that runs things automatically with new inputs, and (2) that the House maps won’t stop moving! Mid-decade redistricting fights in several states mean we’re essentially forecasting a moving target. If it gets to July and maps are still not set, we’ll publish anyway, with appropriate caveats about which districts are in flux. Election forecasters are the real victims of mid-decade gerrymandering.
As with other projects that are a team effort with Mary and Katie, the forecast will formally live at FiftyPlusOne.news and will be free to read — we believe that communicating uncertainty about public polling data is a public service, not something to hide for only readers who are well-off enough to afford yet another media subscription. 50+1 is funded primarily by data licenses, not subscriptions, so we don’t have to put the forecast behind a paywall to make the business math work. (The forecast data feeds will also be available on our API.)
Methodologically, this is a Bayesian “fundamentals plus polls plus ratings” model that “stacks” various predictions on top of each other based on how reliable they have been historically at predicting midterm outcomes. It’s the forecast I wish I’d had the time to build at The Economist and FiveThirtyEight, and I’m confident it’ll hold wel up against (what’s left of) the competition. (My model for 538 beat Polymarket in 2024.)
Third, SIN will be on a reduced schedule next month to accommodate my paternity leave
Burying the lede, I know. My wife and I are expecting our first child in the next three weeks, so I’m taking leave starting the first week of June (or earlier, if the baby has other ideas). This means SIN will be on a reduced schedule starting next month.
Such that paid subscribers aren’t left without the content they’re paying for, I’ve pre-recorded several deep dive podcasts to run next month, plus scheduled a few fun poll articles on perennial topics and current party debates. Because of some other scheduling conflicts, David and I will record our last live podcast for a while this Thursday, May 14. The one exception is my write-up of the monthly Strength In Numbers/Verasight poll, which, as always, will come out in the third week of the month.
I’ll probably still post a chart or two when something genuinely important happens (I’m not great at being offline), but the chart of the week and Sunday roundup will be on break.
2026: More strength and more numbers!
It has been a great first year of running this solo business, especially given the relatively low probability of success at the start. I have a lot of plans for making Strength In Numbers even more valuable to readers over the next six months, and then ahead of 2028 after that.
A year ago, I was nervous that an independent, evidence-first political newsletter wouldn’t find an audience large enough to sustain a second career. You all proved me wrong.
Yet now is no time to rest on our laurels. Today we are living through a confluence of three major threats to polling, political journalism, and democracy: (1) serious public opinion research is getting harder and more expensive; (2) the empirically minded political press is shrinking rapidly, with few outlets providing regular novel coverage; and (3) the demand for clear-eyed, numerate analysis of politics and elections that doesn’t both-sides democracy has never been higher. In taking on these three threats to honest political data journalism, I think what we’re building here really matters.
Together, this publication is showing that, in a political and media environment that rewards noise, partisanship, and lies, there’s still strength in numbers.
Thank you for an extraordinary first year!
Elliott
Congrats on a great first year of SIN AND on the coming baby!!! Lots for you and your family to celebrate.
As to SIN, I have to say it has FAR exceeded my expectations, so thank you for that. Will continue to encourage friends to subscribe; it's the best deal in town for clear-eyed, data-driven political analysis.
Pleased to be an annual subscriber, Elliott -- keep writing the good write!