


This post is free to read, but if you want to support my independent, data-driven political journalism and get premium posts like these sent to your inbox 2x a week, become a paying subscriber to Strength In Numbers today. Members also get early access to data products, a private community on Discord for our political data nerds, and an ad-free newsletter experience.
From time to time, Strength In Numbers accepts sponsors for free posts sent out to all readers (never paywalled articles). These funds help pay for things like data acquisition, subscriber churn, and staff members, including people who help with the podcast and survey research. This post contains one such sponsorship, clearly denoted after the introductory portion of the article.
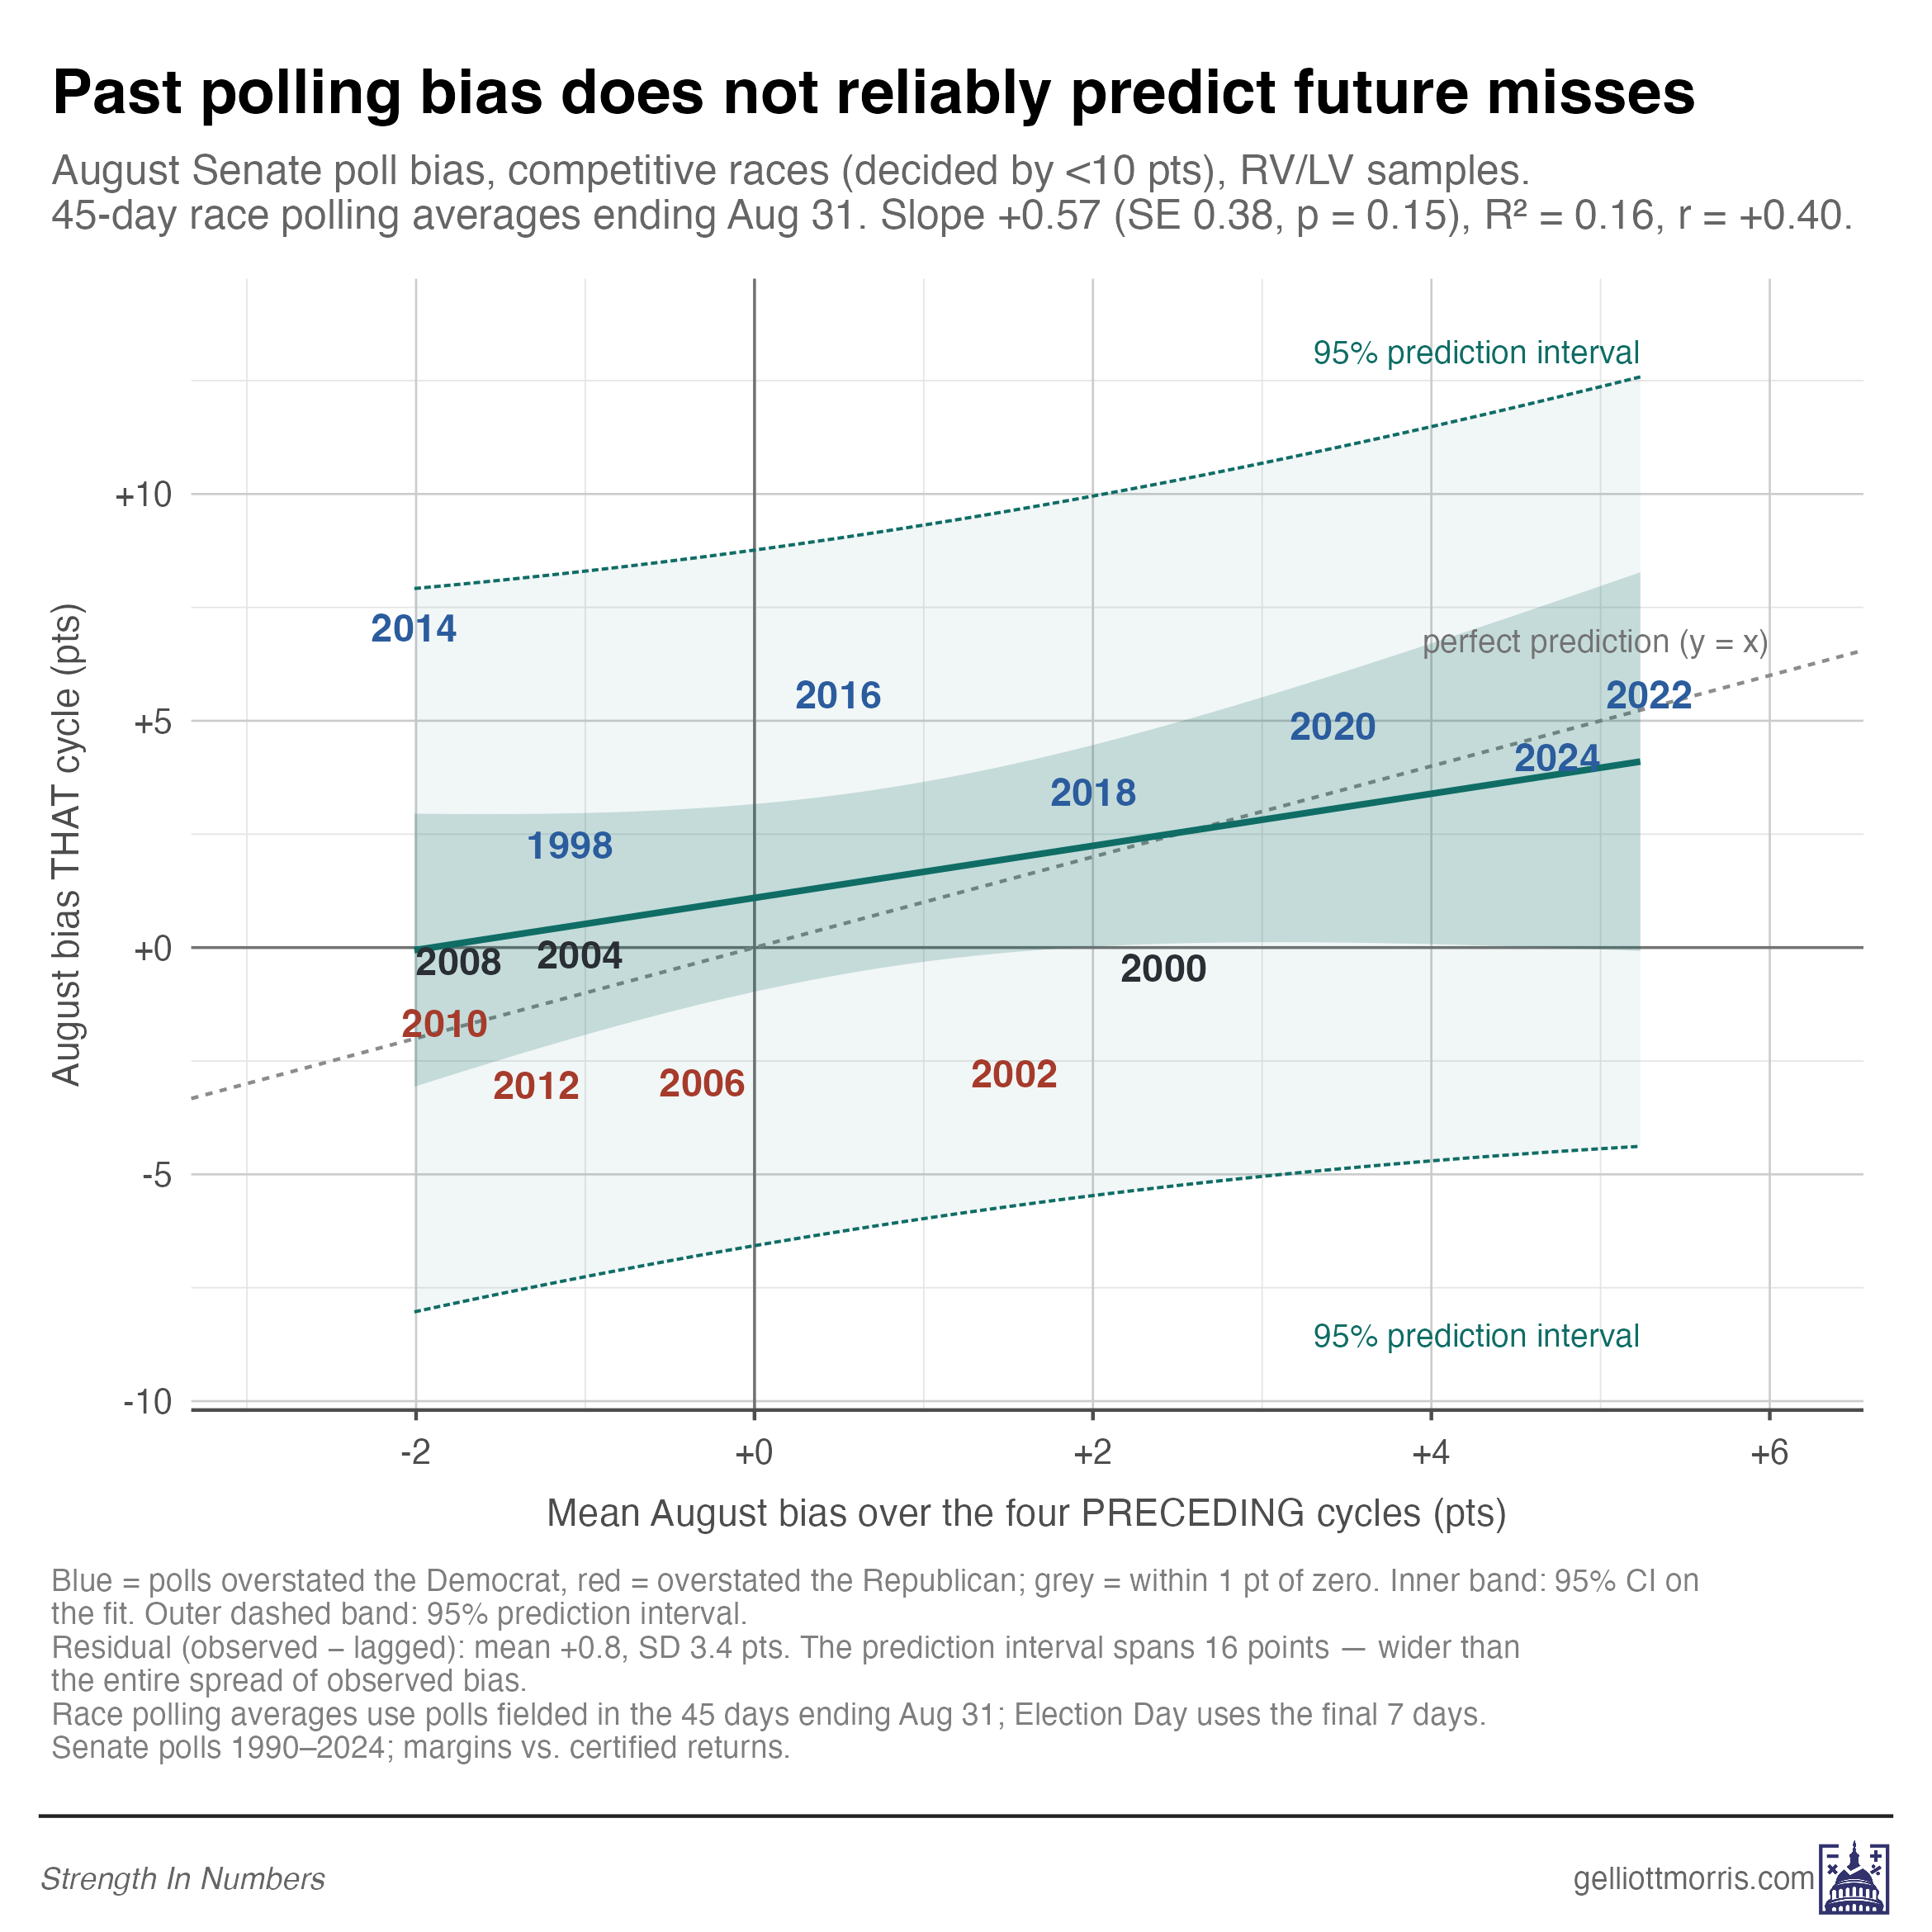
Last Friday, I asked whether polls are overestimating Democrats again this election cycle. The answer I gave doesn’t actually answer that question — because the point I made was that nobody can answer the question until Election Day! Trying to predict the direction of polling error for this cycle using the error over the last four cycles has historically been a bad idea; It often would have left your predictions worse off than just taking the polls at face value:
I’m not promising a more concrete answer today. But there are some more things we can learn on this subject by looking at current polls (whereas last week’s column just looked at historical data).
In talking to other pollsters, I’ve heard anxieties expressed about two potential threats to the polls right now. First, the possibility that people taking surveys might be too progressive, which would cause polls to overstate support for Democrats. But second, there’s also the possibility that people who still admit they voted for Trump in 2024 might be much more right-leaning than 2024 Trump voters were as a whole. This would be bad, because most pollsters now balance their samples by past vote, which would increase the weight on these super-Trump voters.
So this week’s Friday column looks under the hood of our monthly Strength In Numbers/Verasight polls. Are the people answering them now predictably more left- or right-leaning than they were a year ago?
Thanks to Strength In Numbers Discord user “Jofish” for suggesting this topic.
This section contains sponsored content.
One of the big lessons from this election cycle so far is that not all polls are created equal. The same is true for the news you see online.
That’s why I’m happy to partner with Ground News, a website and app I use constantly that helps me identify when stories are being pushed by one side of the ideological spectrum. Ground News gathers news articles from over 50,000 sources worldwide and shows you a measure of each outlet’s factuality, ownership, and political bias. You can also filter news by whether an outlet is owned by private equity or a corporate conglomerate — or is an independent outlet, like this Substack!
Ground News is a smart news aggregator to help you deal with the challenges of our modern information ecosystem. The constant news monitoring and feature filtering help me keep my own news diet attuned to facts, not spin. I think these tools would be incredibly useful to my audience — informed readers trying to find the facts in the news. Today, they’re offering readers of Strength In Numbers 40% off their “Vantage plan,” which gives you a personalized feed as well as data on factuality, partisan bias, and funding information for every news outlet.
Question 1: Are respondents to polls too progressive?
I can proxy an answer for this question by looking at the trend line in weighted ideological self-placement in our polling data. This is a crude approach in that it leaves open the possibility that a panel as a whole has been biased from the start, though we do not think that is the case for reasons explained here; we can monitor the data for changes over time.
Verasight records where panelists place themselves on a seven-point liberal-to-conservative scale as part of an intake survey respondents take when they are recruited to join Verasight’s panel. Crucially, this question is asked separately from the survey we field each month — it is a question asked previously, so it can be used as a proxy for how liberal/conservative the panel is over time.
As a gut check on the stability of the ideology variable, I trained a machine-learning model to identify respondents who have taken our polls multiple times over the past year by matching people by demographic traits within zip code, and identified roughly 1,000 out of roughly 24,000 respondents who look to have taken our survey multiple times over the last 15 months. (I could have asked Verasight for respondent IDs to link them formally but ran out of time; expect a follow-up article soon.) Over 99% of these respondents report the same ideology in both surveys they took.
So when the ideological mix of our poll shifts, it’s mostly because different people answered the poll, not because people are changing their ideological ID over time. However, we do not find a predictable increase in the liberal-conservative tilt of our panel over the last year. In fact, if anything, the panel has gotten slightly more conservative since June 2025.
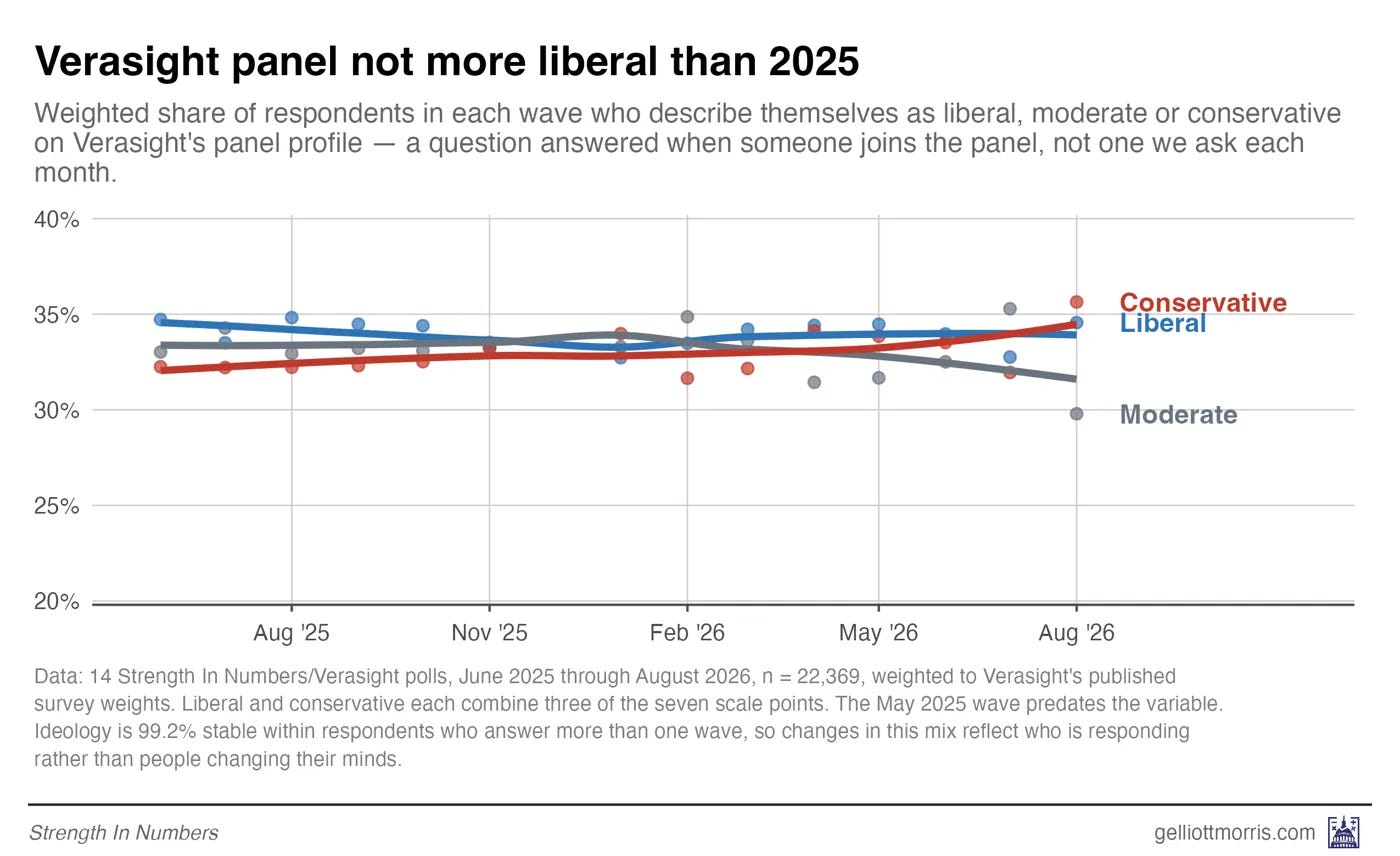
The weighted liberal share of respondents went from 34.4% in the first three waves to 33.8% in the most recent three. The very liberal share slipped from 11.0% to 10.9%. Neither trend is distinguishable from zero.
I also checked that the unweighted share of respondents identifying as Democrats has been stable over time, and it has, floating between 44.3 to 45.1 percent over the last 15 months with no discernible trend.
Question 2: Is weighting by past vote increasing support for Republicans?
Buckle in for a bit of survey wonkery on this one.
Most pollsters now balance samples against the results of the 2024 presidential election — which, if they only get, say, 20% of all adults saying they voted Trump in 2024, this group gets up-weighted to the true population proportion (around 38%).
But this creates a potential compositional problem within the category of people who say they voted Trump in 2024: It’s possible that the softer Trump voters have quietly stopped telling pollsters they voted for him last time. If so, the group still claiming a Trump vote would be an increasingly hard-core remnant, and weighting to 2024 would increase their share in the population — and would, in turn, increase the poll’s estimated population proportion for anything correlated with intensity of Trump approval (e.g., the House generic ballot vote).
To see if this was true — if our poll was getting increasingly Trump-y over time — I built a model that is trained on polling data from 2024 (and calibrated to match results of the election at the county level) that predicts how someone with a given age, race, sex, education, income, and zip-level neighborhood characteristics (2024 presidential vote, rural-urban status, percent gay and percent in college) would have voted in 2024. Because the formula is fixed to predict the results in 2024 accurately, it can be used to gauge the political composition of the people responding to our poll.
I can then break out these scores by voters’ recalled past vote, and see if those people who claim to have voted last time look like more intense Trump supporters, given their demographics and geography.
Within the group of people who say they voted for Trump in 2024, the average predicted Trump support fell by 0.4 points from May 2025 through August 2026 — well within the margin of error for both the individual polls (around 2.5% in the average month) and the trend visualized below (about 1.5%). I have removed the Y axis values from this chart because the thing to focus on is the “lack of” trend, not the level.
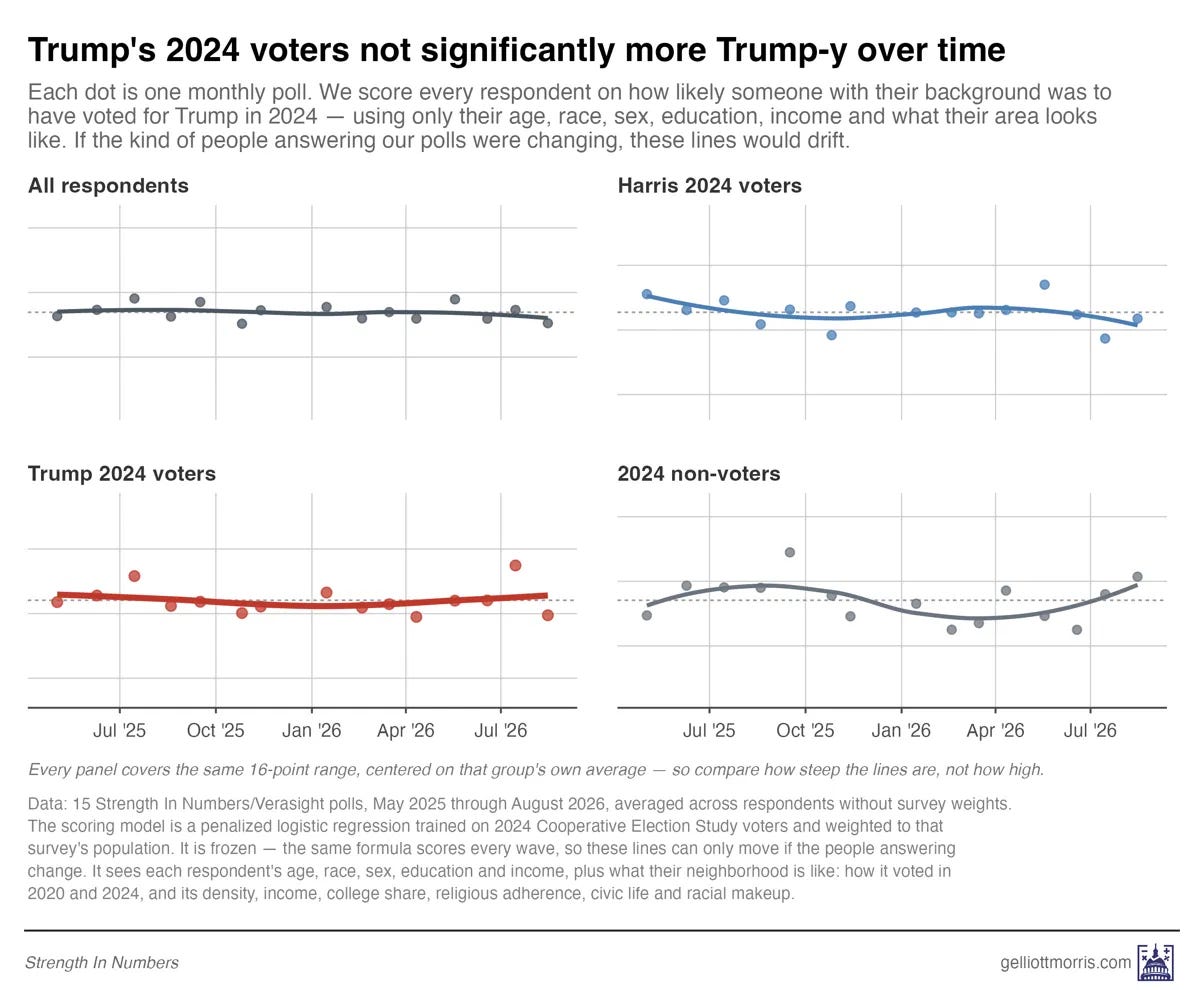
On balance, Harris voters have become a little less Trump-y, and independents are roughly the same as last year. Overall, the pool of people who respond to our poll is no more Trump- or Harris-leaning now than in early 2025.
We can also bucket by intensity of support for Trump and see if the most Trump-leaning respondents increased their population share. They didn’t: those with a Trump probability above 70% went from 29.9% of the group to 27.7%, and the soft middle from 39.9% to 41.7%.
This suggests the opposite of the hardening story — at least in the Strength In Numbers/Verasight poll.
Now for two caveats. This analysis cannot tell us if the Trump voter pool is getting more Trump-y (a) in other polls or (b) in ways that aren’t captured by demographics or local geography. The polls could still end up “wrong” in November for other reasons; we’ve just ruled out two things that aren’t a problem specifically for the Strength In Numbers/Verasight poll.
Concretely, what I have shown is that the people answering our surveys are not drifting to the left, and the pool of 2024 Trump voters we are still getting to respond looks like the same sort of 2024 Trump voters who were telling us that a year ago.
It is still possible that the people who will admit to a pollster today that they voted for Trump in 2024 are higher-probability Trump/Republican voters. But this is why we use a recall measurement that was asked in the past, before the president’s approval rating slipped to 36%.
These are diagnostics we will keep an eye on in our next three polls before election day.
Related Articles


Thanks again to Ground News for sponsoring today’s newsletter. Get 40% off their Vantage plan today.

Ground News paid Strength In Numbers for this sponsorship, but they did not have input on any editorial content.
Thanks for another interesting analysis. I’m always impressed by your creativity and rigor!
Great insight, as usual.
Question: Since Verasight captures people's left-right identity on a 7-point scale, and (I imagine) they also capture each participant's party affiliation (GOP/Ind/Dem), can you have them produce the distribution of Independents' identity along that 7-point liberal-to-conservative scale?