


In honor of Labor Day, there will be no regular Sunday article today. Instead, I figured a personal note on the state of this newsletter was in order. I’ve compiled four short essay-type posts below covering several topics related to this newsletter and related projects. These distill my current thinking about the business behind this newsletter, what we’re building at FiftyPlusOne, how I get a lot of work done, and the value of quitting social media in 2026.
Happy Labor Day. Enjoy your day off. This article is long, so maybe grab a fun beverage to pair with it.
Elliott
1. Economics of independent journalism and polling
We are in a very interesting moment in news media. The old networks are dying while a new world is not struggling at all to be born. Companies that do not shift their business models will wither and die; it is not a question of if but when. To survive, a company needs factuality, transparency, authenticity, and deep relationships with its readers.
Surveying the landscape of successful independent outlets, I see intense demand for coverage of politics that stems from hard data but doesn’t shy away from truths that can be perceived as partisan. Evidence of the success of this category of journalism includes Paul Krugman, The Downballot, and Justin Wolfers’ Platypus Economics here on Substack, as well as outlets like 404 Media, Wired, and The Verge, which despite being known for tech coverage also has some cutting politics investigations.
I believe this positioning — factual, but not both-sides — is also key to the success of this publication.
In a little over a year, the Strength In Numbers community has grown from roughly 7,000 to over 72,000 readers. This comes out to about an average 13% month/over-month growth in readership. Growth has been lower but always positive MoM for paying memberships, though revenue growth for me has been concentrated around elections.
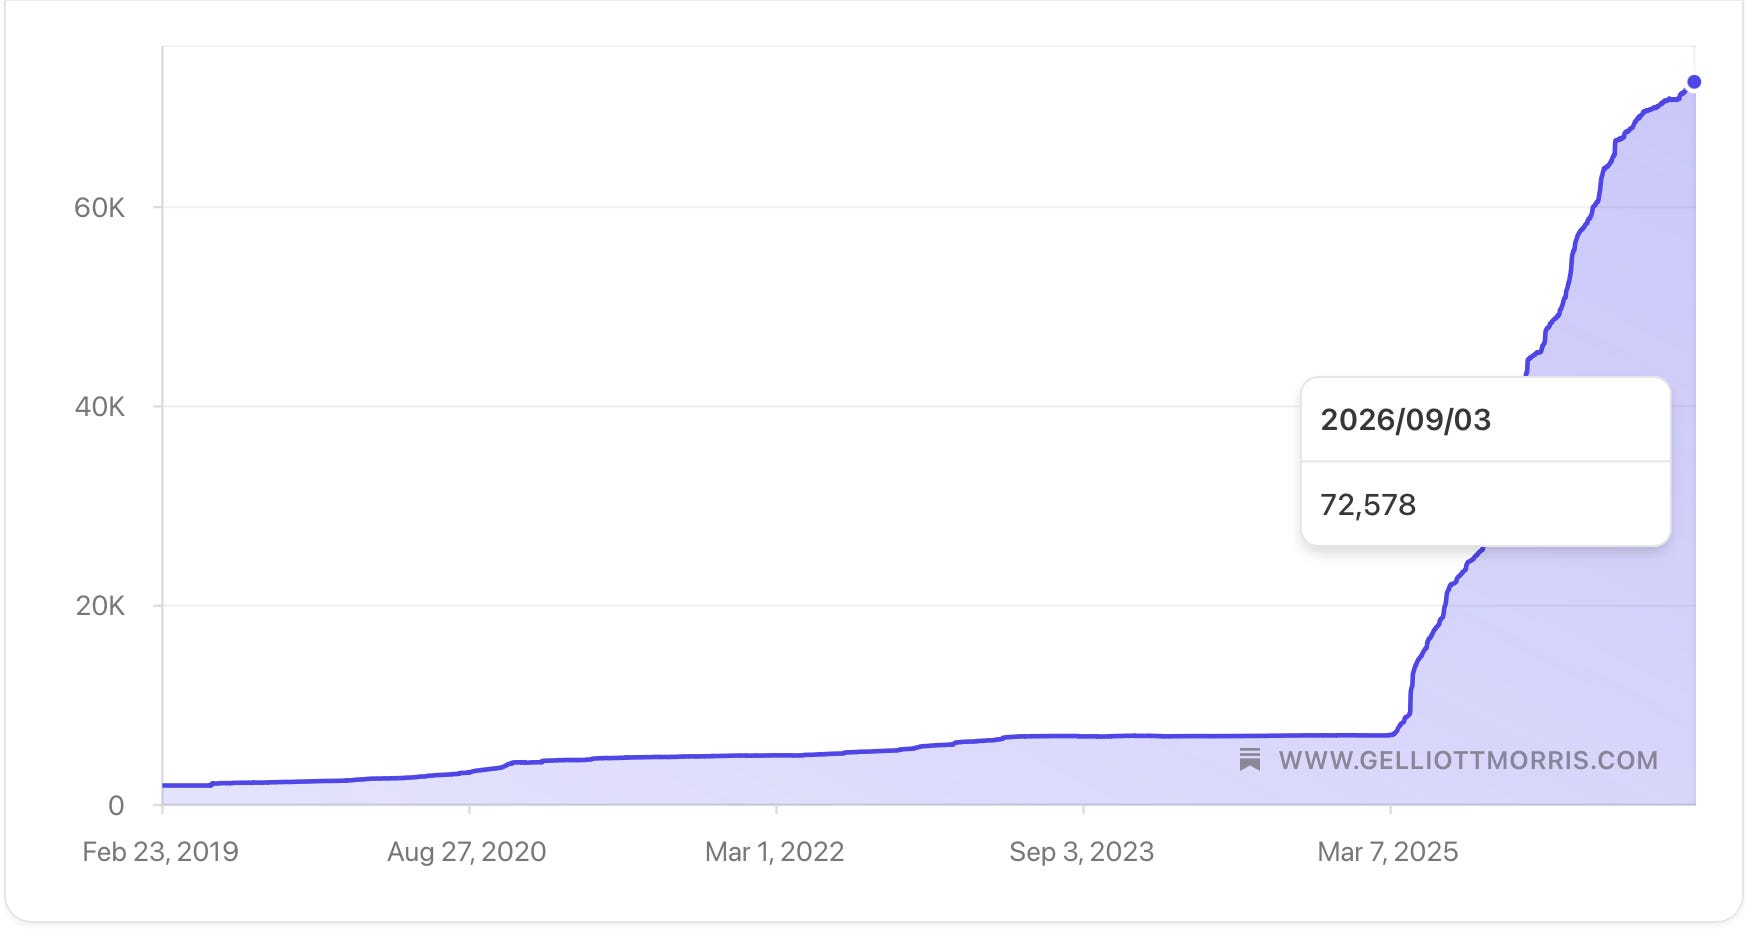
I try not to do a lot of bragging or self-promotion, but I’ve put a lot of thought and time into the journalistic offering and business model here at SIN and I believe the numbers above are evidence it’s working.
Compare the above numbers to those from other Substackers and they become even more notable. At the end of last year, for example, Nate Silver said paid subscriptions to his publication had dropped 27%, and just a couple of weeks ago the culture blogger Taylor Lorenz said paid subscriptions to her Substack had “plummeted.”
I don’t bring this up to pick on Silver or Lorenz, but to make a point about how different editorial models perform in the long term. What makes SIN successful compared to Silver (not in terms of reach, but certainly in terms of not having a third of my business churn in a year) is that content here is “always-on”, rather than being focused in the ~3 months up to an election. Where Silver spends most of his effort writing horse-race columns before an election, he falls off after and turns heavily to other content verticals (like sports) in the off years. If you like the category of journalism that is “everything Nate Silver says,” you can find a home there. But it’s evidently not a business model with sustained growth.
In contrast, SIN is invested in a few projects that constantly deliver new insights for readers. The originality of the work also helps SIN stand out from other pundits, who otherwise have a hard time remaining above-replacement-level for long. Our original polling partnership with Verasight (the first of its kind on Substack), monthly (and soon weekly) MRP tracking with Wave Polling and Research, and integration with FiftyPlusOne means there’s always new insights to be had. This is a business built on creating new data, not averaging other people’s, which helps in story creation and further my mission of using polls to give the people a voice in Washington, DC. We ask a lot of interesting questions here that other pollsters don’t ask, since in the relationship sense I am “closer” to the audience than, say, the pollster at a major network news organization (and I would know, I used to do that kind of work!).
Another newer product is the growing Strength In Numbers podcast. That includes the weekly recording of a live conversation here on Substack, where David Nir and I cover the news of the week from a data-driven perspective, and monthly “Deep Dive” episodes where I interview experts about their research and how it helps us understand politics today. The statistics say the podcast is a surprisingly effective funnel for other audiences to the Substack, and a source of retention for those of you that pay for the newsletter (even though the podcast is free to watch/listen to),
But I think the biggest factors in the success of Strength In Numbers are (a) that I’m an individual in a world where faceless institutions are losing audience share (The Argument Magazine, a pro-liberalism Substack, raised $4M in investment but makes, by my guess based on its position in the Substack leaderboard, maybe an eighth of that every year, before paying for salaries, office space, its original polling partnership with Split Ticket etc) and (b) simply that I am not afraid to call out right-wing partisan bullshit and attacks on democracy for what they plainly are. The value in being a person is easy to see, since people form relationships primarily with other people, not brands. And we are in a moment where lots of news consumers have wised up to authoritarian politics, which is hard for e.g. the old news networks to call out, since they rely on selling advertisements to tens of millions of watchers across the ideological spectrum (and still somehow lose money). But a small team reliant only on support from a few thousand true fans (or “sickos”) can make it work. So can a news network that decides to be partisan; see the success of MS NOW.
So that’s all to say thank you for supporting SIN over the last year. I am committed to delivering fresh and fearless insights to you over the long term. And I think we’re building a special community of data and democracy lovers that doesn’t really exist anywhere else on the internet today. That’s pretty cool.
If you like the free version of SIN, consider becoming a paying subscriber to get access to our private community and additional premium analysis at least once weekly. Paying members of this community keep Strength In Numbers running by supporting the time and data collection it takes to do analyses like this one.
1b. Polling
Now a few brief words on independent polling, since the data from my partnership with Verasivht is the source of a lot of the value-add here at SIN.
Please see here for a discussion of how independent polling funded by newsletter subscribers offers pollsters a new way to ask questions that are closer to the people. Our monthly surveys are collaborative with readers, which means we ask a lot of questions that are “closer” to the average American than those from many other (not all) major media partnerships.
The SIN/Verasight poll also has the advantages that the person writing questions (1) doesn’t spend all day on X, getting an algorithmically biased view of what voters care about (see Section 4); and (2) is not otherwise heavily influenced by bosses and peers that do. As a result, we have been ahead of the curve in detecting backlash to Trump and the midterm blue wave, and have done some cool experiments that help us understand voters better than just asking questions so that I could write over and over about how voters have a low favorability rating of the Democrats or want the party to move left on crime.
So then, some recent developments: Over the last 6 months I have been working on the latest addition to the Elliott Morris universe of polling and forecasting small businesses that collectively pay my bills. That universe includes this newsletter, FiftyPlusOne.news (of which I am one of three equal co-owners; more in Section 2), and as of last month a standalone polling and research firm, Wave Polling and Research.
Wave is the official vehicle through which I do research work for several political and non-political clients. Wave specializes in advising on quick-turnaround research using mixed-mode online panels, and uses a proprietary MRP model I’ve developed over the last several years to produce time-series estimates of opinion at the state and local geographic levels that are calibrated by Americans’ demographics and politics (the latter step is the hardest.)
Wave can take your national polling data, or run a new study, and transform it into predictions of opinion on every question you test at the state, county, congressional district, and neighborhood level. The business angle to Wave is that nobody else is currently doing this in a systematic or accurate way, and the use of MRP means we can give people insights that are accurate to about 95% of what they’d get with an original state or district poll at a fraction of the cost — and clients can get coverage of every geography, not just one.
Wave was born out of work I did originally for this newsletter. And now it is the legal supplier of all MRP estimates published here and at my projects website. To be crystal clear, the monthly SIN/Verasight poll is not a product of Wave Research; SIN just licenses MRP methodology from Wave to apply to our monthly data.
The unit economics at Wave are, honestly, very good — but also extremely constrained by the time I can devote personally to finding clients and developing relationships. As any founder knows, this is a perennial problem in the services sector, especially in politics and especially especially in Washington DC, where organizations really want a high-touch relationship with smart people. So running Wave is cool and probably profitable long-term, but right now more of a “side business” than my main focus. That’s still, and will always be, this newsletter.
2. Economics of independent forecasting
Now a couple of words about FiftyPlusOne, the sister site to Strength In Numbers where we publish original polling and election journalism including my polling aggregates and election forecasts. First, some backstory if you’re new here:
When ABC News shut down FiveThirtyEight in March 2025, I was in need of a quick and stable way to pay my bills. I had some interest from several investors to reboot 538 with a new, business-to-business business model, but I decided it was ultimately unlikely to succeed the way they wanted it to and that it would take too long to get spun up properly — and I needed work fast.
Hence, this Substack. Since I had monetized it on a small scale before, I knew a subscription newsletter was the most straightforward — though not easiest — path to stable income in the near term. So I spun up a site here. The offering here originally included polling aggregation and forecasting models. From May-August 2025, these were powered by public spreadsheets that were kept up to date by my former colleague at 538, Mary Radcliffe.
As soon as it was possible (read: my key bills were paid), I combined forces with Mary and a former 538er, Katie Marriner, to spin off the polling work onto a standalone site. I explained at the time we launched 50+1 that while I knew it would cause some brand confusion, this was the proper way to make sure Mary (and then, for designing our website, Katie) were properly credited and compensated for their work. Strength In Numbers actually pays a modest license fee to 50+1 to re-use some data here.
Now, 50+1 isn’t setting any records for revenue, but at this point it is financially sustainable and, in my opinion, successful: A lot of smart people come to us for comprehensive and transparent aggregation of polling data — and even-more-comprehensive election forecasts — which is ultimately the product we care most about. 50+1 makes money through subscriptions to our website and Substack, and by selling access to the underlying data we generate to commercial clients. We all make a little money (low 5 digits) off the top after paying for server costs and freelancer time.
I bring up FiftyPlusOne to explain the economics of aggregation and forecasting today. Nobody is getting rich off the project, and that’s partly by design; we give an incredible amount of data away for free journalistically that we could otherwise charge for. Other forecasters hide their charts and data behind a paywall to force people to fork over cash. But we believe that aggregation and forecasting is ultimately a public good, and that hiding headline information from the public — especially data derived from public polls, released publicly — does a disservice to election journalism.
To be sure, when I say 50+1 is “financially stable” I’m stretching the truth. This is only the case right now because the co-founders have other jobs that pay the bills, so none of us needs to take a full-time salary. (Though if things currently in the works work out, we’re aiming to make some full-time hires soon. Stay tuned!)
Despite this we keep the site running anyway because we believe in the power of the data we are generating there. Polling averages for presidential approval are, when used correctly, potentially very democratically valuable. And it is good journalistically to have a north-star aggregator of polls that also explains uncertainty in pre-election surveys (e.g., via forecasting).
3. How to get a lot of work done in a medium amount of time
Today I am effectively running or helping to run 3 successful, profitable, growing companies in the political media and polling/research spaces. This takes a lot of work. People frequently ask me: Elliott, how do you get so much done?
There are a few ingredients to my productivity surplus. None are revolutionary and the biggest, overriding factor is that I have a very strong work ethic and care deeply about being successful and providing for my family’s future.
The first ingredient to my not-so-secret sauce is time: I work somewhere between 40 and 70 hours a week. This includes the “hard” time I sit at my desk working, but also the supplementary “soft” time I spend making sure that when I do sit down at my desk, I have everything I need to start and finish my tasks. That includes things like walking my dog while I dictate notes for articles or answer emails via headphones, the time I spend on the bus to and from the office sketching out posts, and the time I spend washing the dishes while I wait on Claude Code to finish reviewing a new model or survey analysis I wrote.
I probably spend about 30-40 hours at my desk every week. The other 20-30 hours is soft work. To recharge, I try not to work Wednesday or Friday after 2:00 PM, but usually something comes up and I end up having to work anyway. Like many writers, I also spend some time working on the weekends, usually a few hours Sunday morning (though this is harder now that I’m a parent) and during downtime on Saturday. I start work promptly at 9:30 AM on weekdays and am always off “hard work” by 5:00 PM, though I usually do a good amount of soft work after dinner and baby bath time. (I wake up at 6:00 every day with my wife and daughter, and we have 2.5-3 hours of uninterrupted family time before commuting to work/school)
So that’s ingredient one: time. If you want to be at your peak, there is really no negotiating the time commitment. You also get a lot of time back if you have a supportive spouse, and my wife handles a lot of what we call “life-min” (life administration work) that makes it possible for me to write out a blog post on my phone at 2:00 AM. Finding a partner early also just cuts down on the huge time investment that comes with dating. I got married when I was 24 and met my wife when I was 17; in terms of my career, I don’t know where I'd be if I had to spend the amount of time other people my age do courting various prospects for a life partner, but it wouldn’t be where I am today.
But I also have some key processes that make sure the time I spend working is actually time I spend working. Not scrolling on Twitter, not DMing memes with people on Slack, not getting caught up in constant email about product management and office politics etc. — actually working. And the biggest advice I have here is to get off your phone.
Step one is to delete all social media apps from your personal phone. You simply do not need these on your personal device. (This part is related to Section 4 below.)
I have become something of an anti-social media evangelist of late. Modern platforms exacerbate political polarization, spread disinformation, and in the case of X and TikTok, have a documented history of being used by their owners to tilt politics to the right. Algorithms silo us in ever-more-targeted echo chambers and prevent journalists (who, let’s face it, are probably the core user base of X) from seeing the big picture about politics. All while providing few benefits.
Social media is also an incredible source of distraction and lost time. Often people ask me how I am able to get so much done (see # 1 and # 2 above) and increasingly I think my main competitive advantage is that I spend very, very little time on these platforms.
Apart from election nights, when I use Bluesky and X to follow news on races from local reporters and online wonks, I try to stay off them altogether. I schedule all of my posts using a paid service called Buffer (I consider this a business expense) and spend about half an hour a day responding to mentions from readers on Bluesky, X, Threads and (yes) LinkedIn. I have a policy never to scroll on algorithmic feeds, which saves my brain, and saves my time.
I also never use social media apps on my phone. All the above activity takes place exclusively at my desktop computer at home (a cheap $500 Mac Mini). As explained here, whether I’m at home or the office, I keep my phone plugged in one location — what the anti-smartphone community calls “land-lining.”
If you are a knowledge worker, particularly one who works from home, I find it can also help to have a dedicated space and/or device to do creative work. At home, when I want to write something and have already finished (or don’t need to do) any heavy data analysis or statistical modeling, I sit at an old writing desk in my living room (that has no permanent screen or computer) and whip out a used iPad Mini connected to an old Apple Magic Keyboard — the old-school one! with batteries! — and type away in the notes app. That’s actually how I’m writing this post.
I also use this desk for reading fiction books. It has a warm lamp and an old vintage lounge chair. It’s pretty cozy.
Finally, I don’t get any auditory notifications on my phone except phone calls from my wife and text messages from my family and core friend groups. This is one of the benefits of working for yourself that many readers might find hard to replicate. Anyone who is accountable for answering messages within a certain amount of time on Slack might similarly be wondering what to do with the advice to put away your work laptop and log into an old iPad for creative work. Well, you could always ask your boss for an hour or so a day where you get to do things like this and not have to be active on email/IM. Failing that, I can’t offer you anything but empathy; I’ve been in your shoes, and that situation sucks.
4. How to not rot your brain
Here is an article from Talking Points Memo’s Josh Marshall about a new prognostication from Charlie Cook of doom for the Republicans in November. It’s a good read. Not a lot of people know the extent of Cook’s bias toward conservative (lower-case ‘c’) forecasts, but it is actually quite pronounced. The race ratings industry has a significant bias toward making safe predictions, such that the ratings Cook Political Report issues in its “Lean” category are won by the favored party close to 9 out of 10 times — what you would expect instead for “Likely” and “Safe.” This actually-quite-poor calibration is well known in the election forecasting community.
As evidence of this in the current cycle, just a few weeks ago, Cook was arguing that the “gravitational pull of partisanship” would limit Democratic gains in November. Back in June, Cook was all but ruling out a “blue wave” for the Democrats because he was making the critical error of conflating party identification with vote choice. This was back when our forecast at FiftyPlusOne was showing Democrats with a 50-60% chance of winning the Senate, and 84% chance in the House.
So that’s the usual bias against forecasting a wave. But another factor this cycle is how journalists, party strategists, and forecasters are all addicted to Twitter/X. This was, of course, true in past cycles as well — but the platform is different now in ways that produce a warped perception of U.S. politics. This is true for anyone who simply logs onto the platform with an open mind, but also in the empirical literature. A study of X users who were shown posts recommended by X’s “For You” algorithm were significantly more likely than those who only saw posts from people they followed to hold right-leaning attitudes on issue prioritization, the war in Ukraine, and Donald Trump, and followed more conservative accounts:
And these are average effects for average users. Those who come to the platform explicitly for political content are likely even more susceptible to being moved by the new Elon Musk-ified recommendation algorithm. This is a platform that is funded and accountable only to a man who donates hundreds of millions of dollars to Republican candidates for office, and who has called Democrats a threat to civilization — so it’s not a surprise that it would produce a warped sense of reality.
X is a reality distortion field for the far-right. This is hard to prove quantitatively but it is plain to see for anyone who studies politics and comes to the platform with an open mind. Here’s Marshall’s take:
how long people held on to the so-called “vibe shift”, the idea that what was actually a pretty small electoral shift represented a sea change in U.S. politics and and a decisive shift to the populist right. But I’ve also wondered how much of it is the venue where the “vibe shift” and so much else took hold: X.
It is difficult to overstate the degree to which a mix of tilted algorithms, withdrawal of non-right-wing voices and the specific algorithmic funny-business tied to Elon Musk’s own account has created not just a right but far-right echo chamber. We hear a lot about how Bluesky is an echo chamber. And it’s certainly true that it’s basically a Democratic or center-left to left-wing space. But I don’t think anyone on Bluesky thinks they’re interacting with a cross section of the American population or getting a vibe that is in any sense representative of the country. To a much greater degree, a lot of people do think they’re getting that on X.
What is dangerous about that, of course, is that X is big enough that it can kind of change reality. Many people tend to adjust or acclimate to something along the spectrum of accepted/normative opinion. If you shift those goal posts to the right, that’s going to have a big effect. Normally it’s extremely difficult to do that without hard coercive state power. There are just too many inputs. Controlling an ecosystem like X is a very different matter. I’ve actually watched this happen to a number of prominent people over the course of time in which Musk has owned X.
Like Marshall, I have seen several smart center-left analysts become completely radicalized by X. This manifests itself not necessarily in changing political views but also in beliefs about beliefs; X tends to magnify fringe left-wing voices while making far-right opinions seem commonplace and tame by comparison. Anecdotally, I have found this to be especially common among economists and people who live in or spend a lot of time with Silicon Valley types, especially those who work in AI.
For these reason and more I think it is harmful to one’s journalism to spend any more than a trivial amount of time on the platform — and those who don’t have to be there for work simply shouldn’t. If your job is to fairly observe, to narrate, or even to persuade, spending time somewhere that is designed to, and has been shown to successfully, warp your view of reality is frankly just stupid.
I have been very public about my shift away from using these platforms for a few years now. And I think Strength In Numbers shows how freeing yourself from the X algorithm pays dividends. Here are some links to things I wrote in early 2025, while famous X-addicted journalists were still writing about politics like it was June 2023 or 2024.
In none of these articles was I relying on private data or proprietary methods. But in order to write them, I had to be distanced from the predominant narrative in DC, and in X, at the time that Trump was culturally dominant and his (narrow) win was evidence of long-term Democratic doom.
All of these articles were dismissed on X as left-wing lunacy at the time I wrote them. Now, as the vaunted Charlie Cook proclaims Armageddon for the GOP, maybe more people will see the value in independent quantitative thinking. And in getting off X for good.
Conclusion
The common theme of these four little mini-essays is independence — in thought, work, and business. Not independence in the self-congratulatory hustle-culture sense of having no boss or doing everything yourself (I am a Big Man who Gets Up at 4 AM to Lift Weights and Crush The Day). I mean having enough control over your work — how it is funded, where you spend your time, and what information gets access to your brain — that you can produce a high volume of high-quality output.
To make independent journalism work in 2026, you have to have a prescriptive and product people find valuable, and you have to be adaptable. None of the projects above is an enormous success alone. Some are more profitable than others; some may eventually grow into something much bigger, and some may remain fun little businesses run by a handful of people who care intensely about the product. But together, they amount to something that makes life in a capitalist society possible and that I’m increasingly proud of: a small, independent ecosystem for quantitative journalism, polling and election analysis that is not reliant on big institutions for funding or social media algorithms for traffic.
For subscribers of Strength In Numbers, this is what your support is helping to build. When you pay for a monthly or annual membership to this newsletter, you’re not just paying for content here. I mean, you are paying for content — that’s the business transaction — but you’re also helping to sustain me personally while giving me the freedom to pursue related projects that add to this ecosystem.
A little over a year into this project, that feels like a pretty good thing to be building. Thanks for being part of it.
And now back to regular Sunday features…
2. What Strength In Numbers published last week
Last Sunday’s roundup covered new data on Trump’s 2024 coalition: one out of six of his voters now say they wouldn’t vote for him again.

On Tuesday, our August Strength In Numbers/Verasight poll found Democrats and Democratic leaners are unified on wanting their party to fight Trump’s corruption — but split on what this means for the party long term:

On Thursday, our weekly podcast looked at why Trump keeps making unpopular choices ahead of the midterms — from the White House ballroom to the war in Iran — and the toll it’s taking on the GOP:

Friday’s free Chart of the Week dragged focus on the salience of party priorities in vote choice, an often overlooked factor in prognostication. Trump’s approval on prices and inflation, the issue voters name as their most important, is -48 — and generally Trump does worst on issues voters rate as most important. A supermajority of adults say he is focusing on the wrong problems.

If you’re a frequent reader of Strength In Numbers, I’m confident you will get a lot of value out of a paid subscription. You’ll get access to all of my Tuesday Deep Dives, monthly polling crosstabs, our private community of election nerds on Discord, and more.
3. Even more numbers!
Gas is up 40% since the Iran war began, and it’s Trump’s own voters eating more of the cost — they drive a lot more than Harris voters do, even though polling shows they’re less likely to say prices are rising fast in the first place. Gas Prices Are High. Trump’s Supporters Are Feeling The Most Pain.
Pew: 67% of Republicans call themselves “working class,” compared with 55% of Democrats — and the gap holds up even after controlling for income, education and occupation. Who Sees Themselves as Working Class?
And that’s it for this week! Thanks for reading. Strength In Numbers will be back in your inbox on Tuesday-Wednesday with the weekly deep dive for premium subscribers.
Got more for next week? Email your links or add them to the comments below! Comments are unlocked in the Sunday roundup.
Thank you, Elliott for your hard (and productive) work every day. I know when I read your newsletter that I am getting an honest, well-thought-out and thorough take on the subject of the day. Thanks for your commitment to your readers and the care taken to cut through the bullshit that many pass off as journalism.
Thanks, Elliott, for this explanation and for all you do. I’m happy to support this project. Your subscribers get so much from your hard work and dedication!