Two new polls show learning about Trump's policies moves public opinion toward Democrats
Your weekly political data roundup for November 23, 2025
Dear readers,
This is my weekly roundup of new political data published over the last week.
One of the big mysteries in public opinion research is the problem of non-attitudes. Because pollsters just get responses to survey questions and have to take them (mostly) at face value, we usually don’t know whether the answers people give to us represent real, well-thought-out attitudes, or are simply answers quickly conjured from the front of the mind for the purpose of answering a survey.
The difference between the two is important because if the thing pollsters are measuring is attitudes — formed through an informed model of the world and stable for each individual over time — then they are predictive of both other thoughts and behaviors in the real world (see: the 2026 midterms). But if polls are measuring non-attitudes, then our analysis about what people think now (and how they might act in the future) is thrown into question.
The lead story slot this week is about two new public polls that help us assess the difference between attitudes and non-attitudes as they relate to Donald Trump’s policy agenda and the 2026 midterms.
On deck here at Strength In Numbers: It’s Q&A week! I’ve got a good-sized list already, but send in any extra questions you might have via email or leave them in the comments below.
Also, it’s Thanksgiving week! Holidays are a big deal in my family, and this year I’m hosting my parents and siblings (including cooking much of the food), so emails and responding to comments/chat posts will be delayed in the latter half of the week. I will probably take next Sunday off, or send a fun newsletter about Thanksgiving polling — but paying subscribers will still get the usual Tuesday and Friday posts (my deal with members is that you paid, so you get what you paid for).
Finally, someone pointed out to me via email that comments for this newsletter had been locked to just paying subscribers. That was an accident, because I want all readers of the Sunday roundup to be able to post links in the comments. Comments on Sunday newsletters are now unlocked!
1. Two survey experiments find that learning about Trump’s policies/that GOP controls Congress moves opinion left
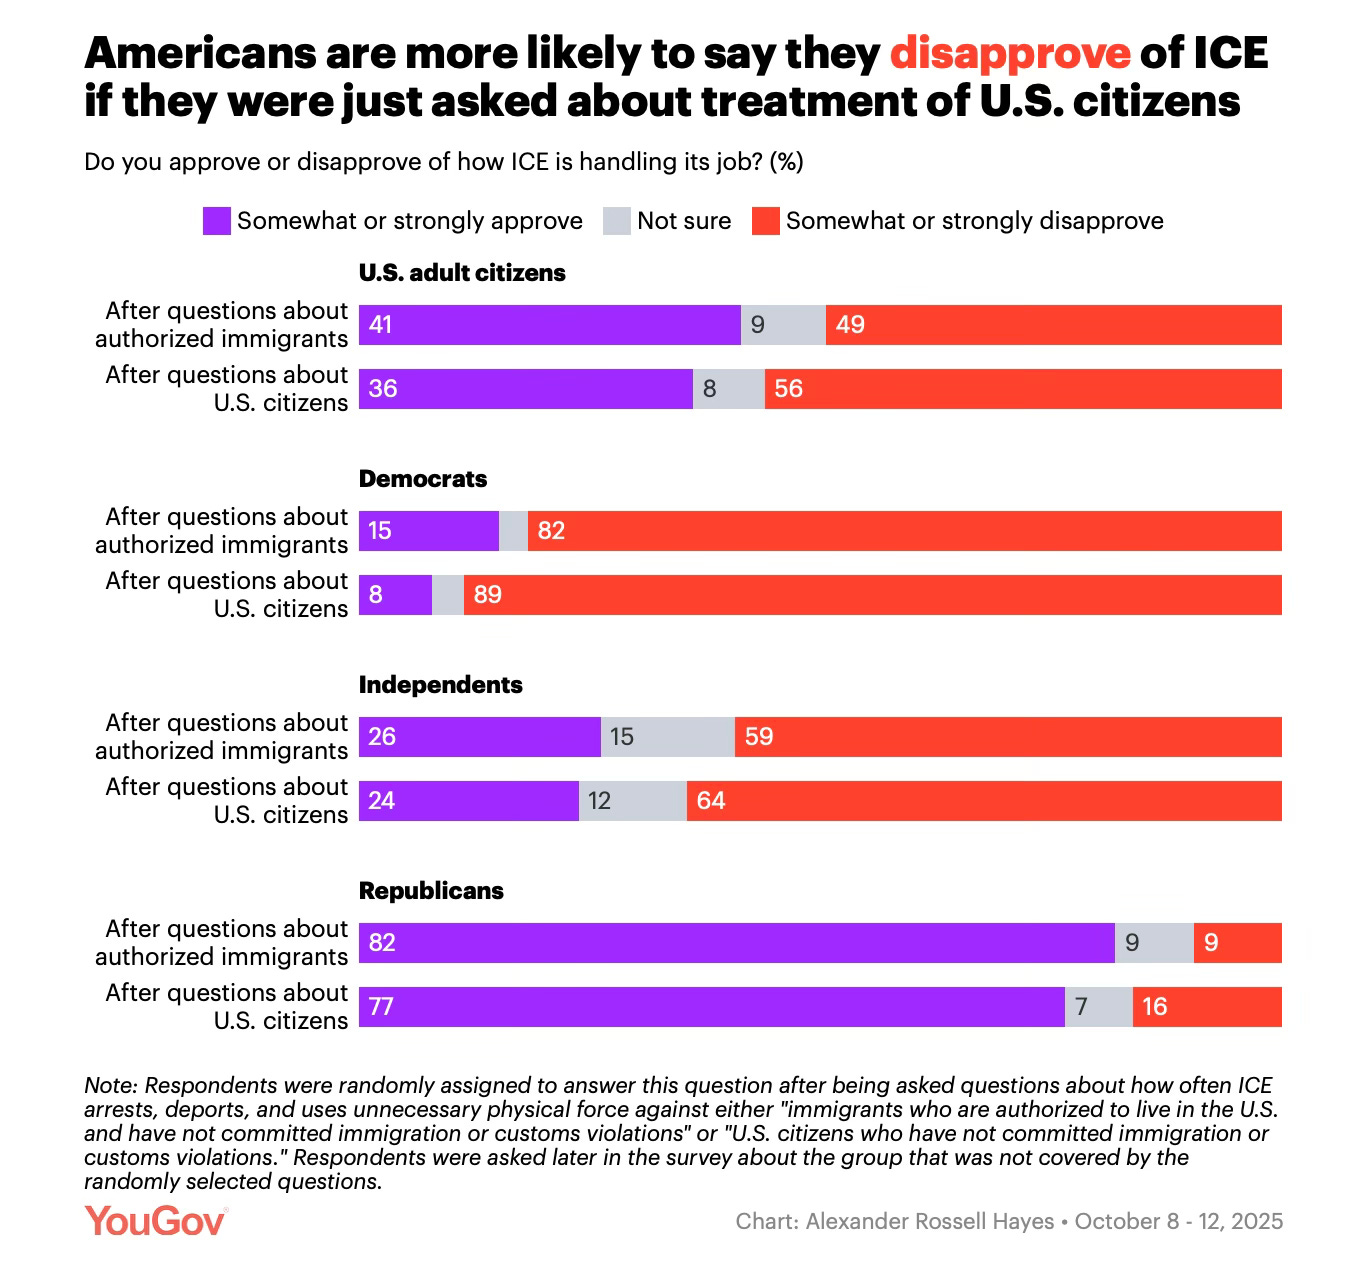
First up, here are the results of a new YouGov poll released this week that looks at how respondents behave differently in surveys when they receive different information about recent actions taken by Immigration and Customs Enforcement. In a nutshell, what YouGov did was run two different versions of its poll, where half of the respondents were asked how they felt about ICE after receiving a question about ICE’s treatment of immigrants, and half were asked how they felt about ICE after receiving a question about ICE’s treatment of American citizens.
As a survey respondent, you either saw these two questions in this order:
How often do you think ICE uses unnecessary physical force against immigrants who are authorized to live in the U.S. and have not committed immigration or customs violations?
Do you approve or disapprove of how ICE is handling its job? (%)
OR these two questions, in this order:
How often do you think ICE uses unnecessary physical force against U.S. citizens who have not committed immigration or customs violations?
Do you approve or disapprove of how ICE is handling its job? (%)
The results of this experiment are summarized in this chart:
The results of the experiment show that being asked to think about ICE’s treatment of citizens makes Americans more likely to disapprove of ICE, relative to being asked questions about ICE’s treatment of authorized immigrants. YouGov reports:
Americans who were asked about their evaluation of ICE after questions about ICE’s treatment of U.S. citizens were 7 percentage points more likely to disapprove of ICE than those who had just seen questions about ICE’s treatment of authorized immigrants (56% vs. 49%) and 5 percentage points less likely to approve (36% vs. 41%). This effect goes in the same direction among Democrats, Independents, and Republicans. In all three groups, respondents who were first asked about ICE’s treatment of citizens were between 5 and 7 percentage points more likely to disapprove of ICE than those who were first asked about authorized immigrants.
Note that approval of ICE is underwater regardless of question wording — including by 30+ points among political independents.
One thing I like about this experiment is that YouGov is not giving any new information to respondents — e.g., in the form of long question wording with added context. For example, in a standard survey experiment, a researcher might alternate between asking respondents a straight-up approval ask and a question that begins with “Recently, during an immigration raid in New York, ICE arrested four U.S. citizens for being in the country illegally, which it does not have the legal authority to do. Do you approve or disapprove of the job ICE is doing?”)
It would not be surprising to find that this survey wording pushed respondents to disapprove of ICE. In contrast, all YouGov did was ask respondents to share their own opinions in a different order. This suggests that Americans may already have this anti-ICE information in their heads, and that prompting them to recall it moves their attitudes in a predictable direction. YouGov concludes:
This suggests that high-profile instances of ICE detaining, arresting, injuring, or shooting U.S. citizens could be particularly damaging to the agency’s reputation, as making ICE’s treatment of citizens more salient to Americans appears to make them more likely to disapprove of ICE.
(Emphasis my own.)
Now, for the second experiment.
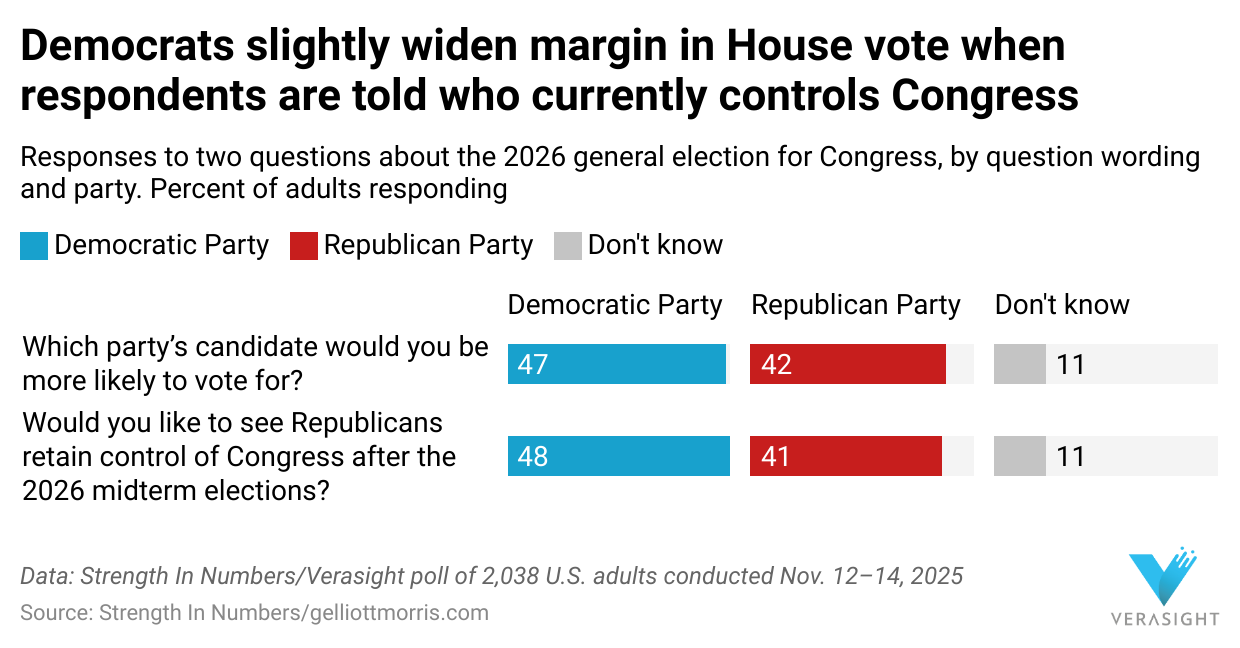
In my November Strength In Numbers/Verasight poll, we split our sample in half and asked 1,019 U.S. adults each a different version of the U.S. House generic ballot question. One group of 1,019 respondents received the standard generic ballot question (“If the 2026 general election for Congress were held today, which party’s candidate would you be more likely to vote for in your local Congressional district?”) while the other half received a version that specified which party currently controls Congress.
In this “informed ballot” question, Democrats slightly widened their lead in the race for the House vote next year (from +5 to +7):
This experiment suggests that when voters learn that Republicans currently control Congress, they decide to vote against Republicans.
Similar to a recent experiment by YouGov Blue, detailed in this newsletter at The Downballot, I find that the effect is mostly driven by independents moving against the Republican Party. In my usual generic ballot question, independents currently break 36% to 25% for the Democrats over Republicans (D+11), with 39% saying they are undecided for next year’s House elections. In the informed ballot, however, the Democratic vote share among independents rises to 44%, Republican share rises to 28% (D+16), and undecided percent shrinks to 29%. The “don’t knows” move left.
The results of these two survey experiments suggest that when voters learn about what Trump and Republicans in Congress are doing, their vote intention for next year’s midterms moves toward the Democrats. If you’re a Democratic Party strategist trying to maximize your party’s chances of winning the 2026 midterms, the conclusion from these experiments is to spread information about what ICE is doing to American citizens and run hard against Trump in general.
2. What you missed at Strength In Numbers
This week was another big one at SIN. All subscribers received an analysis of our exclusive new Strength In Numbers/Verasight poll and a generic ballot update, and paying subscribers got premium posts including a new methodology for placing voters on (and off!) the left-right political spectrum.
Here’s everything published in this newsletter over the last week:
If you’re a frequent reader of Strength In Numbers, I’m confident you will get a lot of value out of a paid subscription. You don’t just get a lot of extra, high-quality content, including premium data features and trackers, but also direct access to me and a private community of data nerds working in polling and U.S. politics. I know there are a lot of writers asking for your money these days, but think about this: Who else is offering you 4+ original, high-quality, data-driven analyses of U.S. politics and elections in a single week?
A yearly subscription really helps the business grow:
If a paid subscription isn’t right for you, the best thing you can do to help this business succeed is share this newsletter with a friend or on social media:
3. Even more numbers!
Links to other articles in the political data space I discovered over the last week
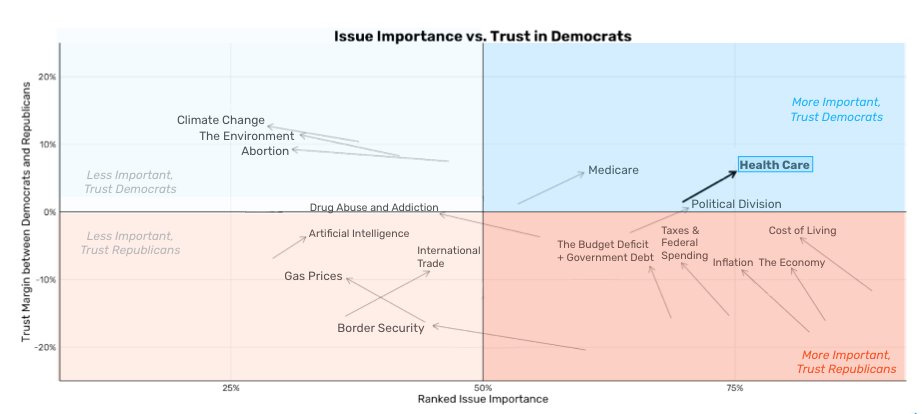
Democratic data scientist David Shor says: “The issue landscape has changed dramatically over the last year - Democrats successfully have simultaneously raised the salience and expanded our trust advantage on our best issue (healthcare) \*and\* dramatically improved our trust advantage on the cost of living and the economy” and posts this graph:
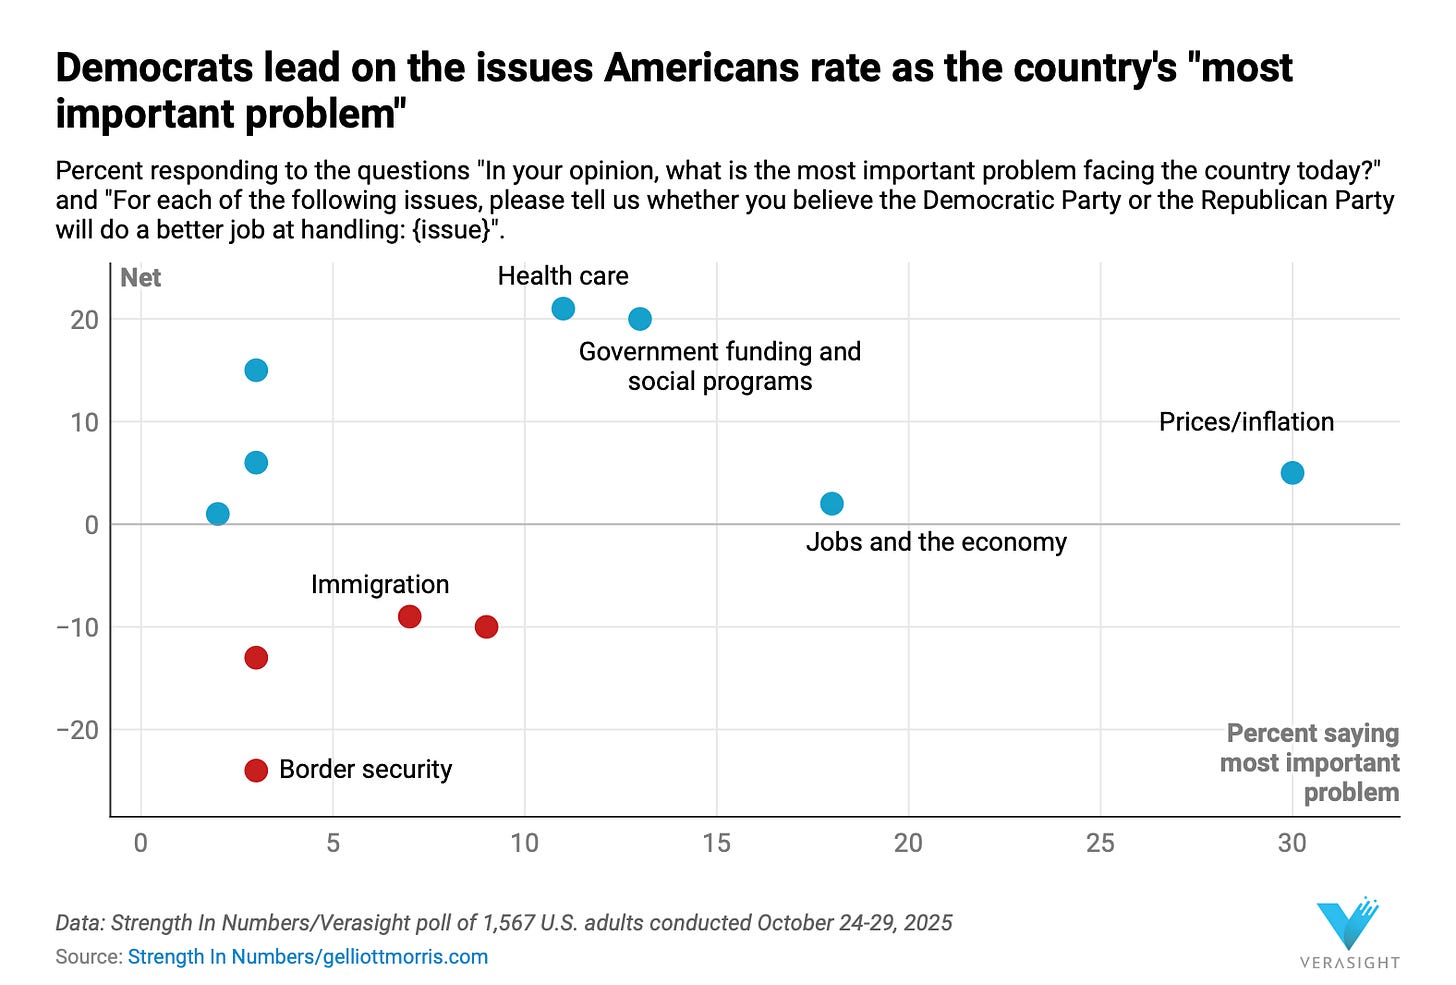
This is very similar to the following chart that I posted here back in October. Democrats are leading on the issues Americans say are most important to them:
Also, this is a great reminder that public opinion can change over time — so parties that root their strategies only in what “the polls” are saying right now are locking themselves into a backwards-looking strategy, and risk looking like feckless trend-followers.
Pew has a new course up about how polls work. It should be very useful for journalists. As part of this rollout, they’ve also posted the following video about why polls have underestimated Trump over the last 3 presidential elections, and what pollsters are doing about it:
Courtney Kennedy was my boss once, in a past career. She’s really good at this.
Pew also has a new poll out about social media use in 2025. Young people use Instagram, TikTok, and Reddit a lot. Facebook has peaked. Bluesky’s user base is tiny.
The new Fox News poll shows Trump getting worse marks than Biden on a question that asks respondents how much they blame the president personally for the performance of the economy.
Gallup finds that public support for democracy is really high, actually. Democracy erodes from the top.
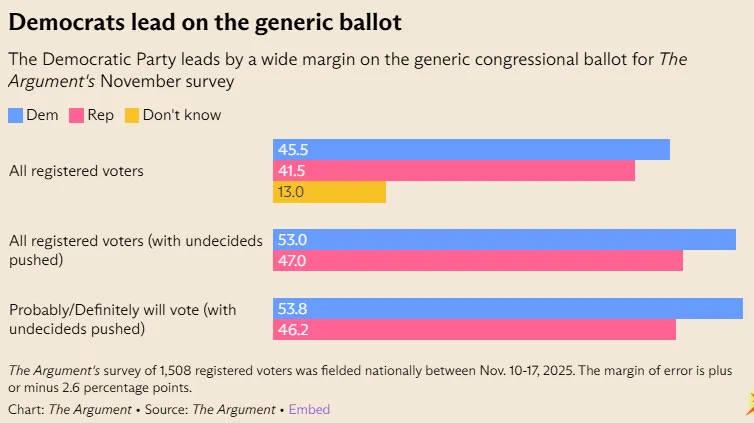
New polling by The Argument shows Democrats gain on the generic ballot when people responding “don’t know” are forced to make a decision. Very similar to the findings in part 1 of this newsletter.
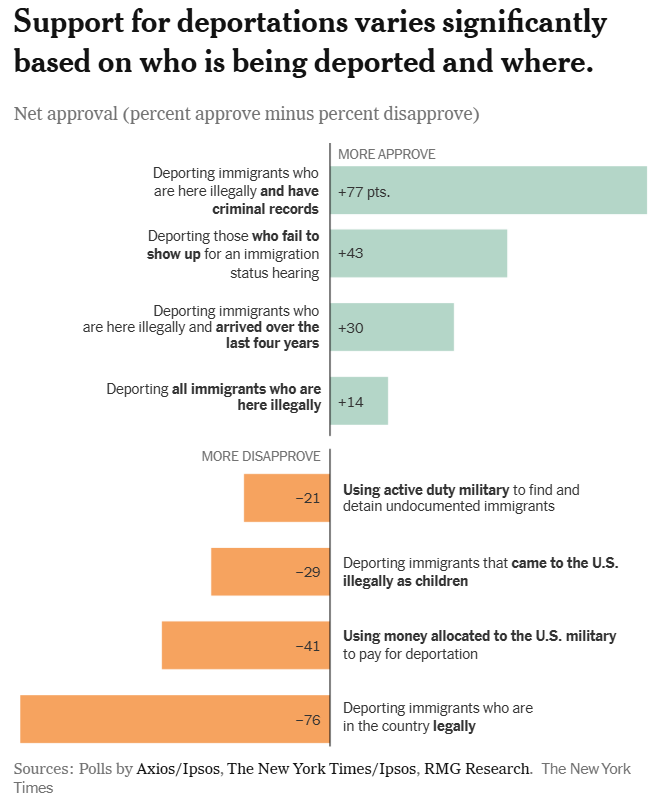
The New York Times looks at immigration polling again and reaffirms a finding from this newsletter: the more specific pollsters get about Trump’s immigration policy, the more unpopular it gets.
And a new poll from Equis Research finds Latino voters are economy voters first:
Got any political data stories of your own to share? Drop them in the comments below!
4. Polling update
The Strength In Numbers polling averages have moved to a new webpage at fiftyplusone.news, a website purely for poll-tracking that I’ve set up with my friends. Some averages, like my average of Trump’s approval rating on individual issues, remain on the data portal but will be moved to the new site soon.
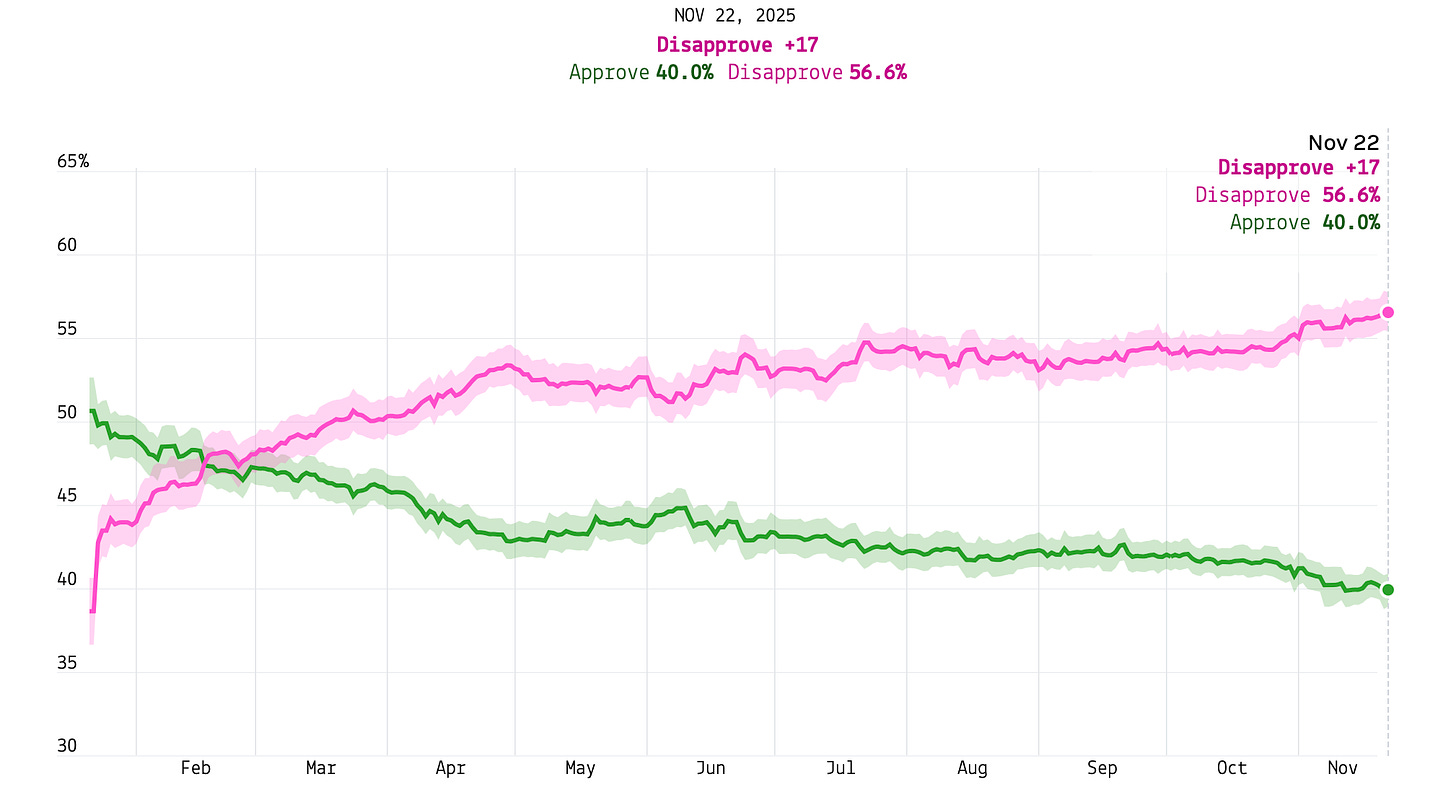
Trump’s net job approval is -16.6, a new low for the president.
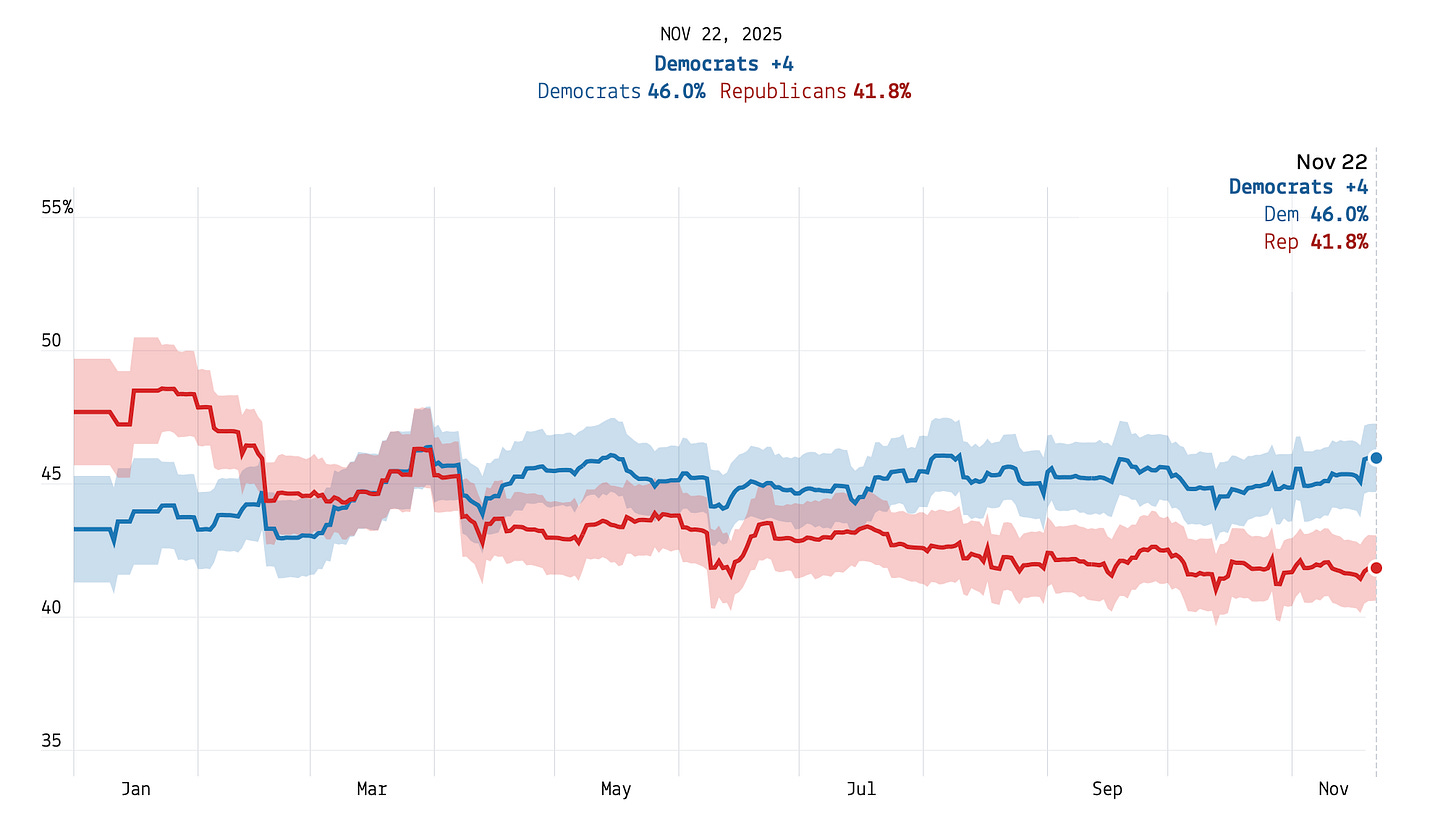
The generic ballot is D+4.2, a new high for the Democrats.
Soon, we’ll be adding averages of politicians’ favorability ratings to the site. Stay tuned.
That’s it for your major political data stories this week.
Got more for next week? Email your links or add to the comments below!
Have a nice week,
Elliott




I know this is not really a question and just a statement of my own sensibilities, but I see these data and my reaction is surprise that 40-45% of Americans still approve of Trump and his policies.
I’ve thought for a long time that Democratic politicians place too much emphasis on financial aid for college educations and not enough on financial aid for apprenticeships and other “blue-collar” job training that prepares young people for career paths that provide good jobs but don’t require a college education. I’d like to see a poll question that asks people how much they support increased government funding for (a) college education and (b) non-college job training.