


Hi everyone, Elliott here with a short business note before the main content. The months leading up to elections are always the biggest months of new revenue for this newsletter. But in the months after, there is a predictable churn of people canceling monthly subscriptions after votes are tallied.
If you’re new here, or on a monthly plan, I want to ask you to support this independent publication by becoming a yearly member. More than ask you, I want to incentivize you: that’s why I’ve enabled a discount code for 20% off annual subscriptions here at SIN from now until Election Day. Redeem it with the button below.
Strength In Numbers is not an election-year-only publication, and I have big plans for our work in 2027 and 2028 — including the monthly poll and data dashboard, podcast, and collaborations with other publications — that you won’t want to miss. Not only do I think that $72/year is a really great deal for informed, data-driven politics coverage delivered straight to your inbox 3x a week, I think we’re building something special here that you can’t get anywhere else in the media. And, frankly, SIN has had a very good track record since launching full-time in May 2025, with a lot of Value Above Replacement compared to the pundits you’re used to hearing from/about.
So please join us. If you believe that there is strength in numbers, you’ll feel right at home here.
1. Polls might overstate Democrats, but they roughly align with the fundamentals
There is a lot of debate online right now about whether the polls can be believed. Democrats are doing suspiciously well, the logic goes, in red states where polls have overstated support for Democrats before. On Wednesday, CNN’s Harry Enten pointed out that polls overestimated Democrats in Iowa, Michigan and Ohio in 2016, 2020 and 2024. Two years ago, Republicans beat their September polling in those states by 9 points in Iowa, 6 in Ohio and 5 in Michigan, according to Enten.
It is worth noting that polls were unbiased on average nationally in 2018 and 2022, though they overstated Democrats again in those same Midwestern states.
President Trump reposted the clip to Truth Social, and by Thursday the National Republican Senatorial Committee had written up a whole press release, warning Democrats (and GOP donors) against relying on “rosy polling” that historically overstates Democrats. Last week, the Senate Leadership Fund pulled out of the race in North Carolina — independent actions that seem to affirm, not contradict, the polls.
It is understandable that the Republicans would want to deny the polls. But now Enten’s segment is being used as evidence by the broader pundit class that the polls are not to be trusted. As blogger Matthew Yglesias put it, “the midwestern polling is probably fake.”
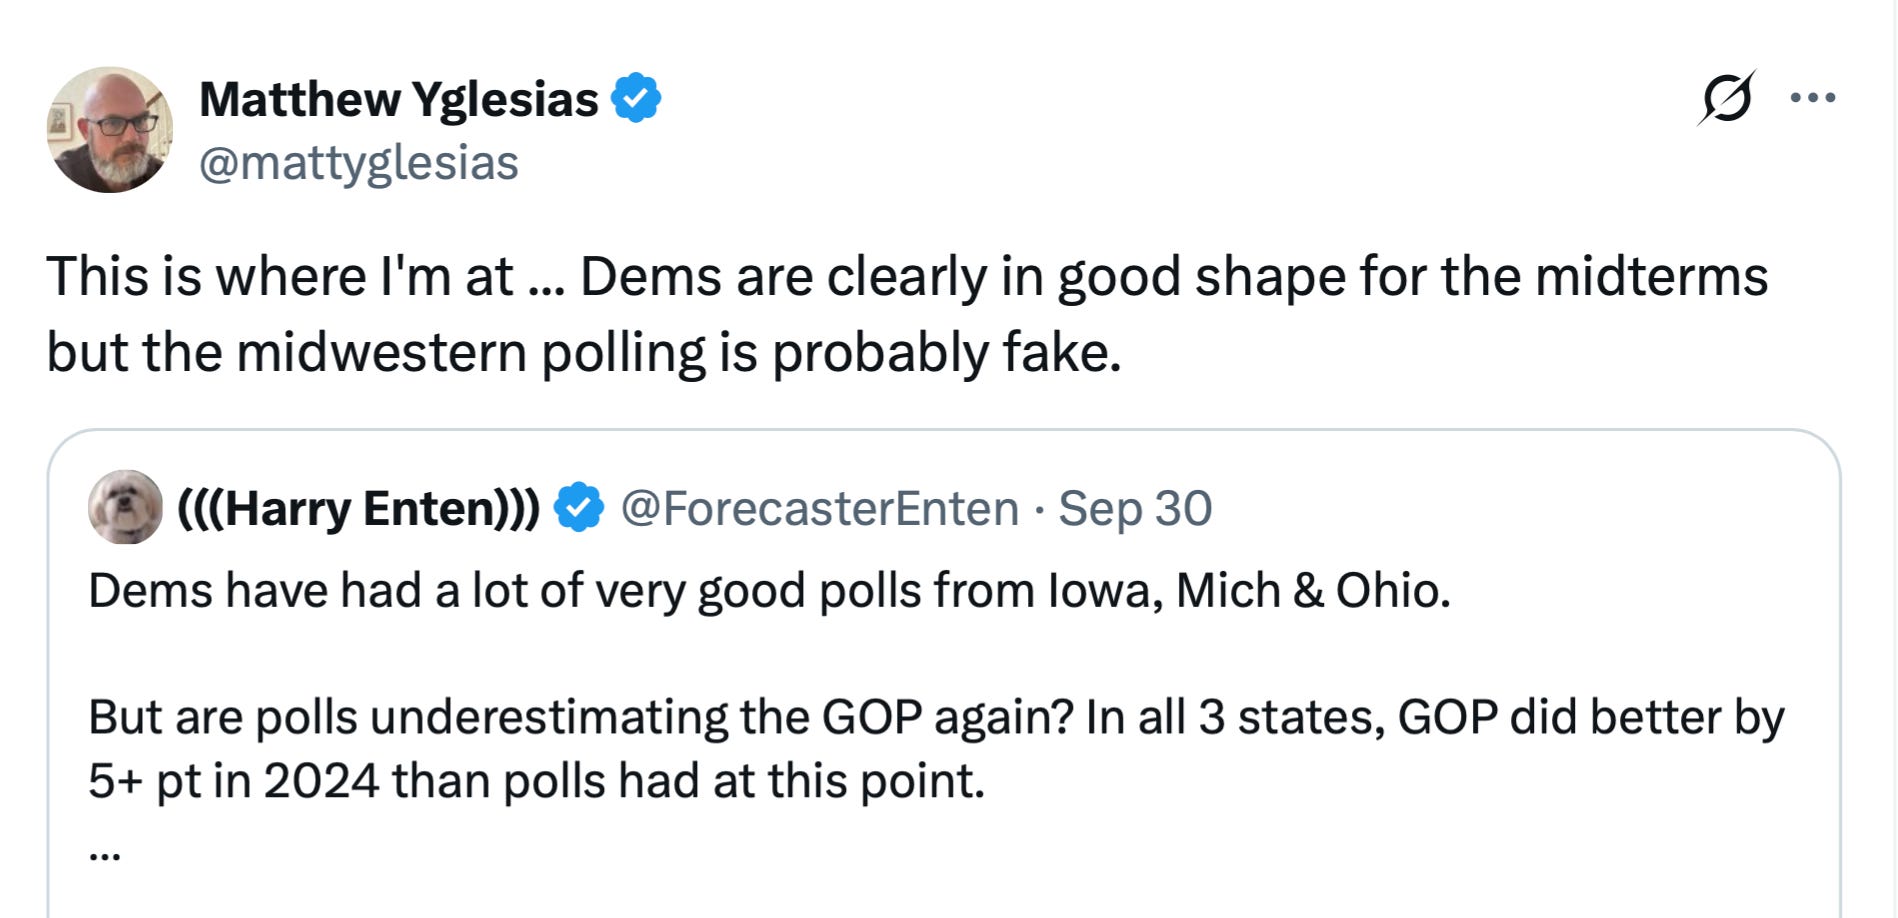
Do I think Yglesias actually means that pollsters are faking their data in these states, as he says? No, I don’t think he really believes that. But I’m not going to put words in his mouth. That’s a pretty serious allegation!
It’s true that polls overestimated Democrats in these states recently. By my count, September polling averages overstated the Democrats in all 24 Senate, presidential, and governor races in Iowa, Ohio, and Michigan since 2016, by about 6 points on average. Not great, Bob!
But as I wrote in August, past patterns of polling error are not historically predictive of future misses. If you expand the analysis from 2016-2024 to 1998-2024, the results from Enten’s analysis reverse. Using our database of polls at FiftyPlusOne — as far as I know, the most comprehensive collection of surveys up and down the ballot — I have shown that the direction of polling bias bounces around from election to election. Knowing what the polls did in the previous four cycles tells you almost nothing about the next one.
For example, from 1998 to 2014, polls in the Midwest leaned the other way, understating Democrats by about 5 points in Michigan, 2.5 in Iowa, and a point in Ohio. If you used those values to adjust the polling averages in 2016, you would have ended up with even worse predictions than the polls gave.
More recently, those trying to “unskew” the polls have failed badly. In 2022, RealClearPolitics subtracted its estimate of polling bias (from the past three cycles) from its Senate averages and turned a tied race in Pennsylvania into “Oz +2.2.” Fetterman won by 4.9. RCP’s adjusted averages had Republicans ahead in Arizona, Georgia, and Nevada, and its final map projected a 53-seat Republican Senate. But after runoffs took place, Democrats won 51. I wrote about that at the time.
And who can forget in 2012, when Dean Chambers’s UnskewedPolls.com (yes, that was its real name) adjusted surveys for an assumed GOP party ID lead and said Mitt Romney was winning? Barack Obama won by nearly 4 points.
Finally, in the most recent election cycle in 2025, the polls under-shot Democrats by almost TEN PERCENTAGE POINTS in the New Jersey and Virginia governor’s races that year. That is an error twice as big as the state polling misfires in 2016, 2020, and 2024. Some people even used early pro-Republican partisan polls to predict the GOP would carry New Jersey!
Yes, the polls today could be different from the final results. There are 30 days left, and measurement error is inherent to polling. But that doesn’t mean you should expect bias in any direction. On average historically, assuming surveys are unbiased is empirically the right decision. It’s also possible that polls are underestimating Democrats, and if so, all the predictions of pro-Democratic bias are going to look really silly.
I’ll have more analysis of potential Democratic bias in Tuesday’s exclusive Deep Dive for paying subscribers. I deploy a new test of “effortful responding” in our own polls to look for signs of partisan non-response that weighting can’t fix. To maybe spoil this a bit, yes, I do think there are some things to be worried about. Make sure you’re subscribed to get that in your inbox.
But enough about that for now; the ground has been pretty well-trodden at this point. What I want to point out today is that these state-level polls aren’t the only positive sign for Democrats. The electoral “fundamentals” show a big pro-Democratic year, too.
What the fundamentals say
At FiftyPlusOne, our Senate forecast starts every race from a “fundamentals” estimate that uses no state polls at all. There are four components to this projection:
First, the national environment. The model uses our House popular-vote forecast, which is anchored on the generic ballot polls and stood at about D+9 in the latest run on Saturday night, October 3.
Yes, there is some circularity in using the generic ballot polls as a component in the fundamentals forecast. But the good news is that the D+9 reading from the generic ballot (which is by far the best predictor we have of the House popular vote) is in line with the other indicators of a Democratic year, from Democrats’ edge in special elections to the signals David Nir and I walked through in this interview with Paul Krugman published yesterday. And see this regression analysis based on presidential approval from Joel Wertheimer:
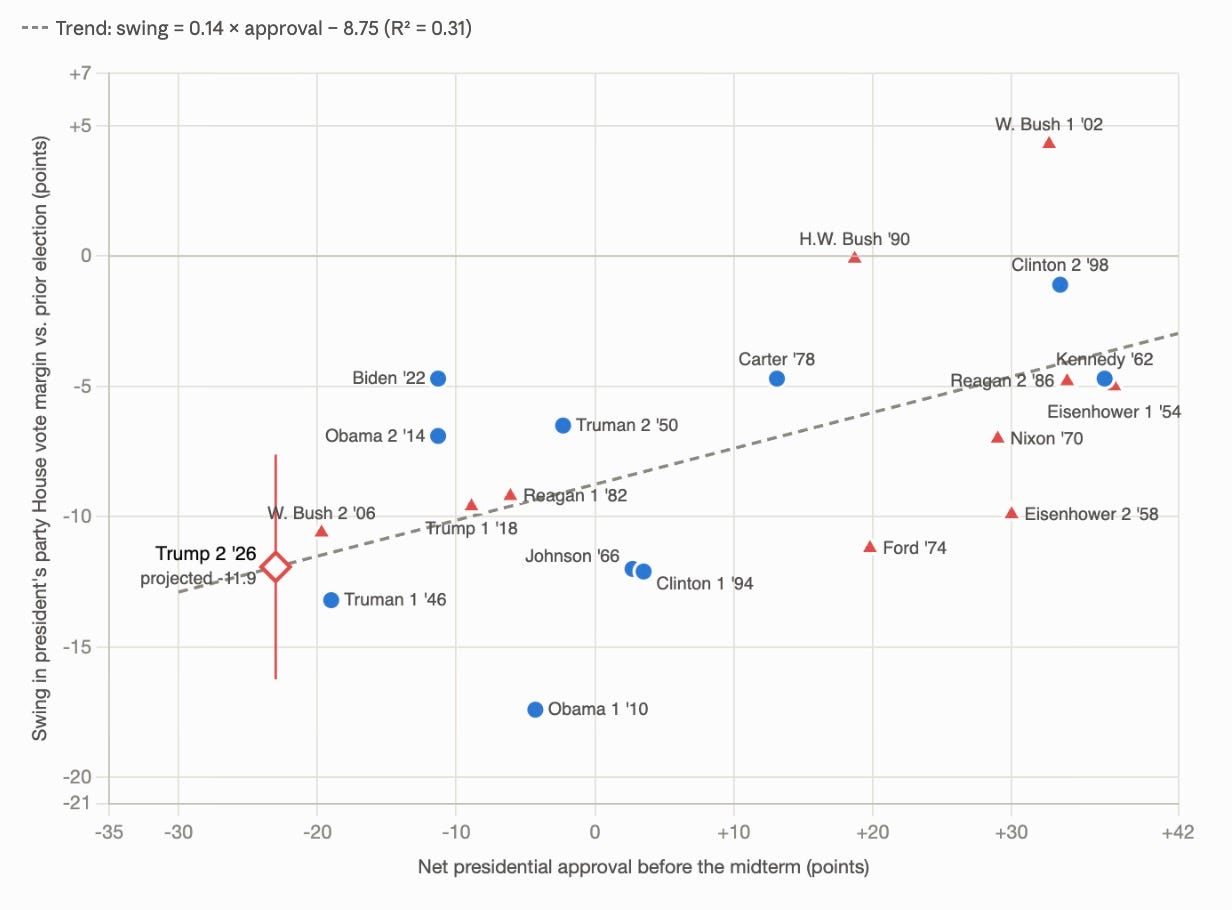
So the polling and non-polling national predictors are all in basic agreement that we’re at D+8-11 in the national House vote.
Second, the state’s partisan lean. This is a measure of how much redder or bluer a state voted than the nation in 2024 and 2020, weighted 80/20 toward the more recent election. This value gets multiplied by 0.83, our forecasting model’s estimate of how much of a state’s presidential lean carries over into a future Senate race.
Third, the candidates: Incumbency, political experience, and each nominee’s share of the two candidates’ individual fundraising historically predict Senate elections.
Fourth, the “personal vote”, which measures electoral over- or under-performance for incumbent Senators, relative to all the factors mentioned above. More about these four categories of predictors in our model write-up.
If you do the math on these predictors in most states with competitive Senate seats, you get a result that looks an awful lot like the polls. Here, for example, is how the fundamentals add up in Iowa, the race the skeptics are most focused on:
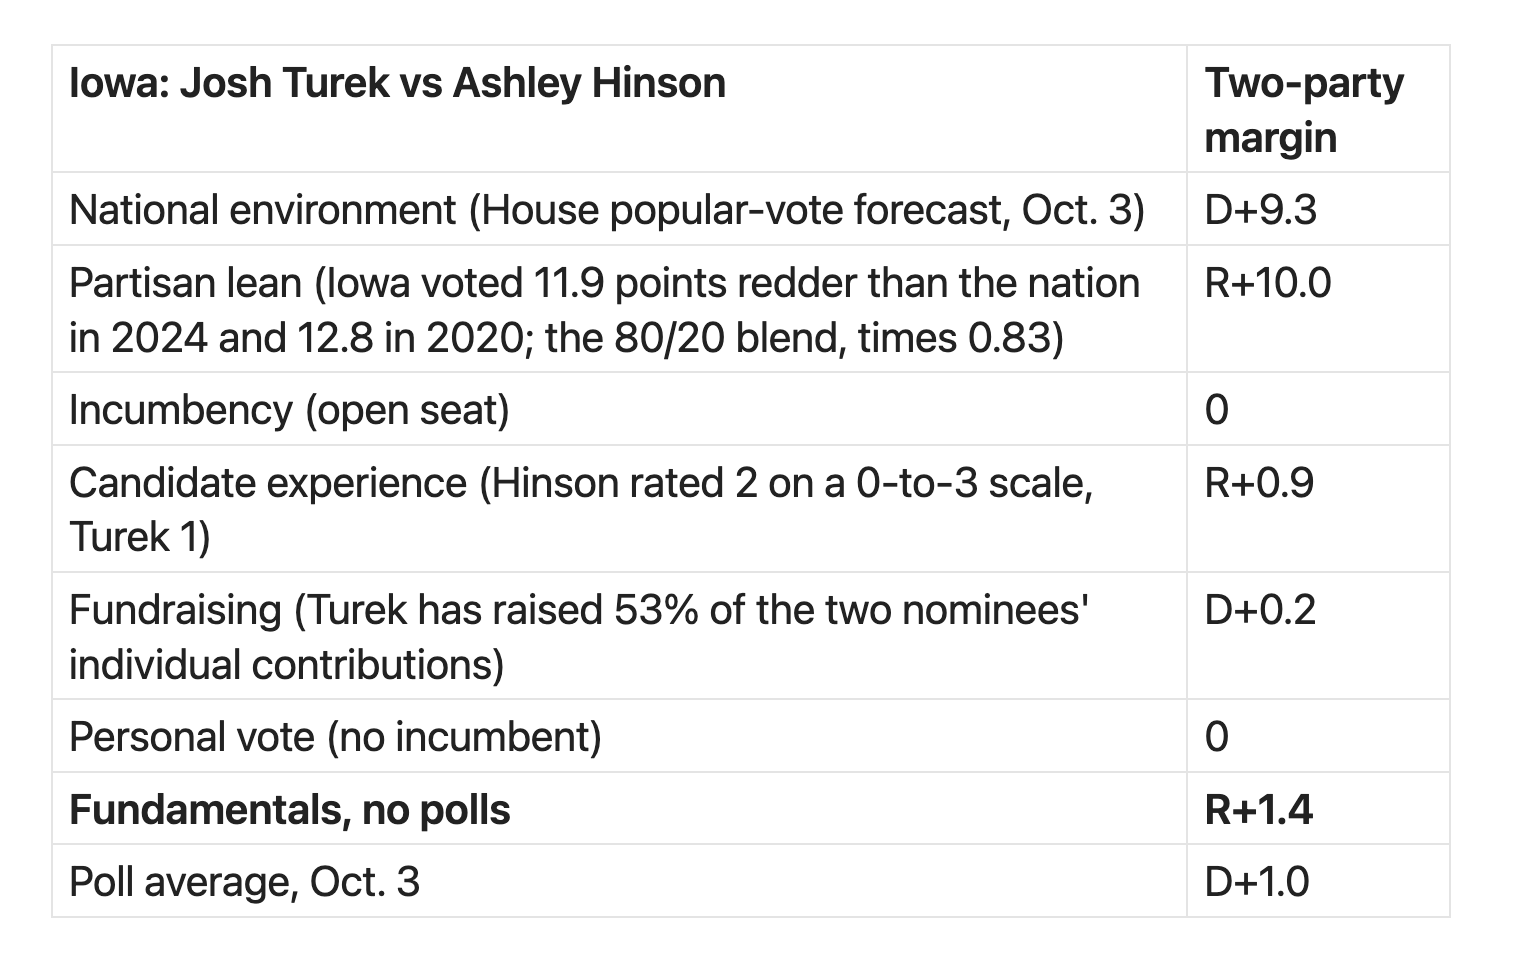
The upshot of this math is that before you even read a single Iowa Senate poll, the fundamentals say it is a one-point Republican race. The FiftyPlusOne polling average in Iowa today is D+1. When you consider that the fundamentals are not perfect predictors of election results (they have a historical standard deviation of out-of-sample error of 7 percentage points), the 2-point difference between the polls and fundamentals is not statistically significant.
If you run the same exercise on, for example, Ohio, you get a predicted election-day margin of D+1.5; Texas is D+2.0; and Alaska is D+2.0. From very first principles, a state that voted ~12 points redder than the country is almost a coin flip in a D+9 year. Again, you get a pretty Democratic leaning environment before even looking at the polls!
Here’s the full table of fundamentals vs. the polls in every competitive Senate seat. The last column measures how different the polls are from the fundamentals, considering the uncertainty in said fundamentals, using something called a Z-score. Generally speaking, values lower than 1 represent pure noise.
A real boost for Democrats is that they have recruited really good candidates. The model’s personal-vote term says Dan Sullivan has run about 5 points behind Alaska’s partisan baseline over his career — worth 2.7 points to Mary Peltola — and that Roger Marshall has run about 2 points behind Kansas’s. Susan Collins has run 12 points ahead of Maine’s, which is why that race is closer than the state’s lean.
In our testing, a candidate who leaves office and comes back does not get much of a boost for past overperformance, so, e.g., Sherrod Brown gets nothing for carrying Ohio by 12 points in 2006 and 7 in 2018, in years when the national House vote was D+8 and D+9, environments a shade smaller than today’s. This may end up being a blind spot for our model, so if you give Brown some of that back, Ohio’s polls, 2.8 points above its fundamentals, look about right.
In every one of the red states skeptics are focused on, the polls sit within about half a standard deviation of what the fundamentals predict: Ohio at 0.4, Iowa at 0.3, Alaska at 0.3, Texas at 0.2, Kansas at 0.7. This is a very different situation from 2016 and 2024, or even 2020, when polling leads for Democrats in places like Iowa and Ohio were very out of line compared to the fundamentals.
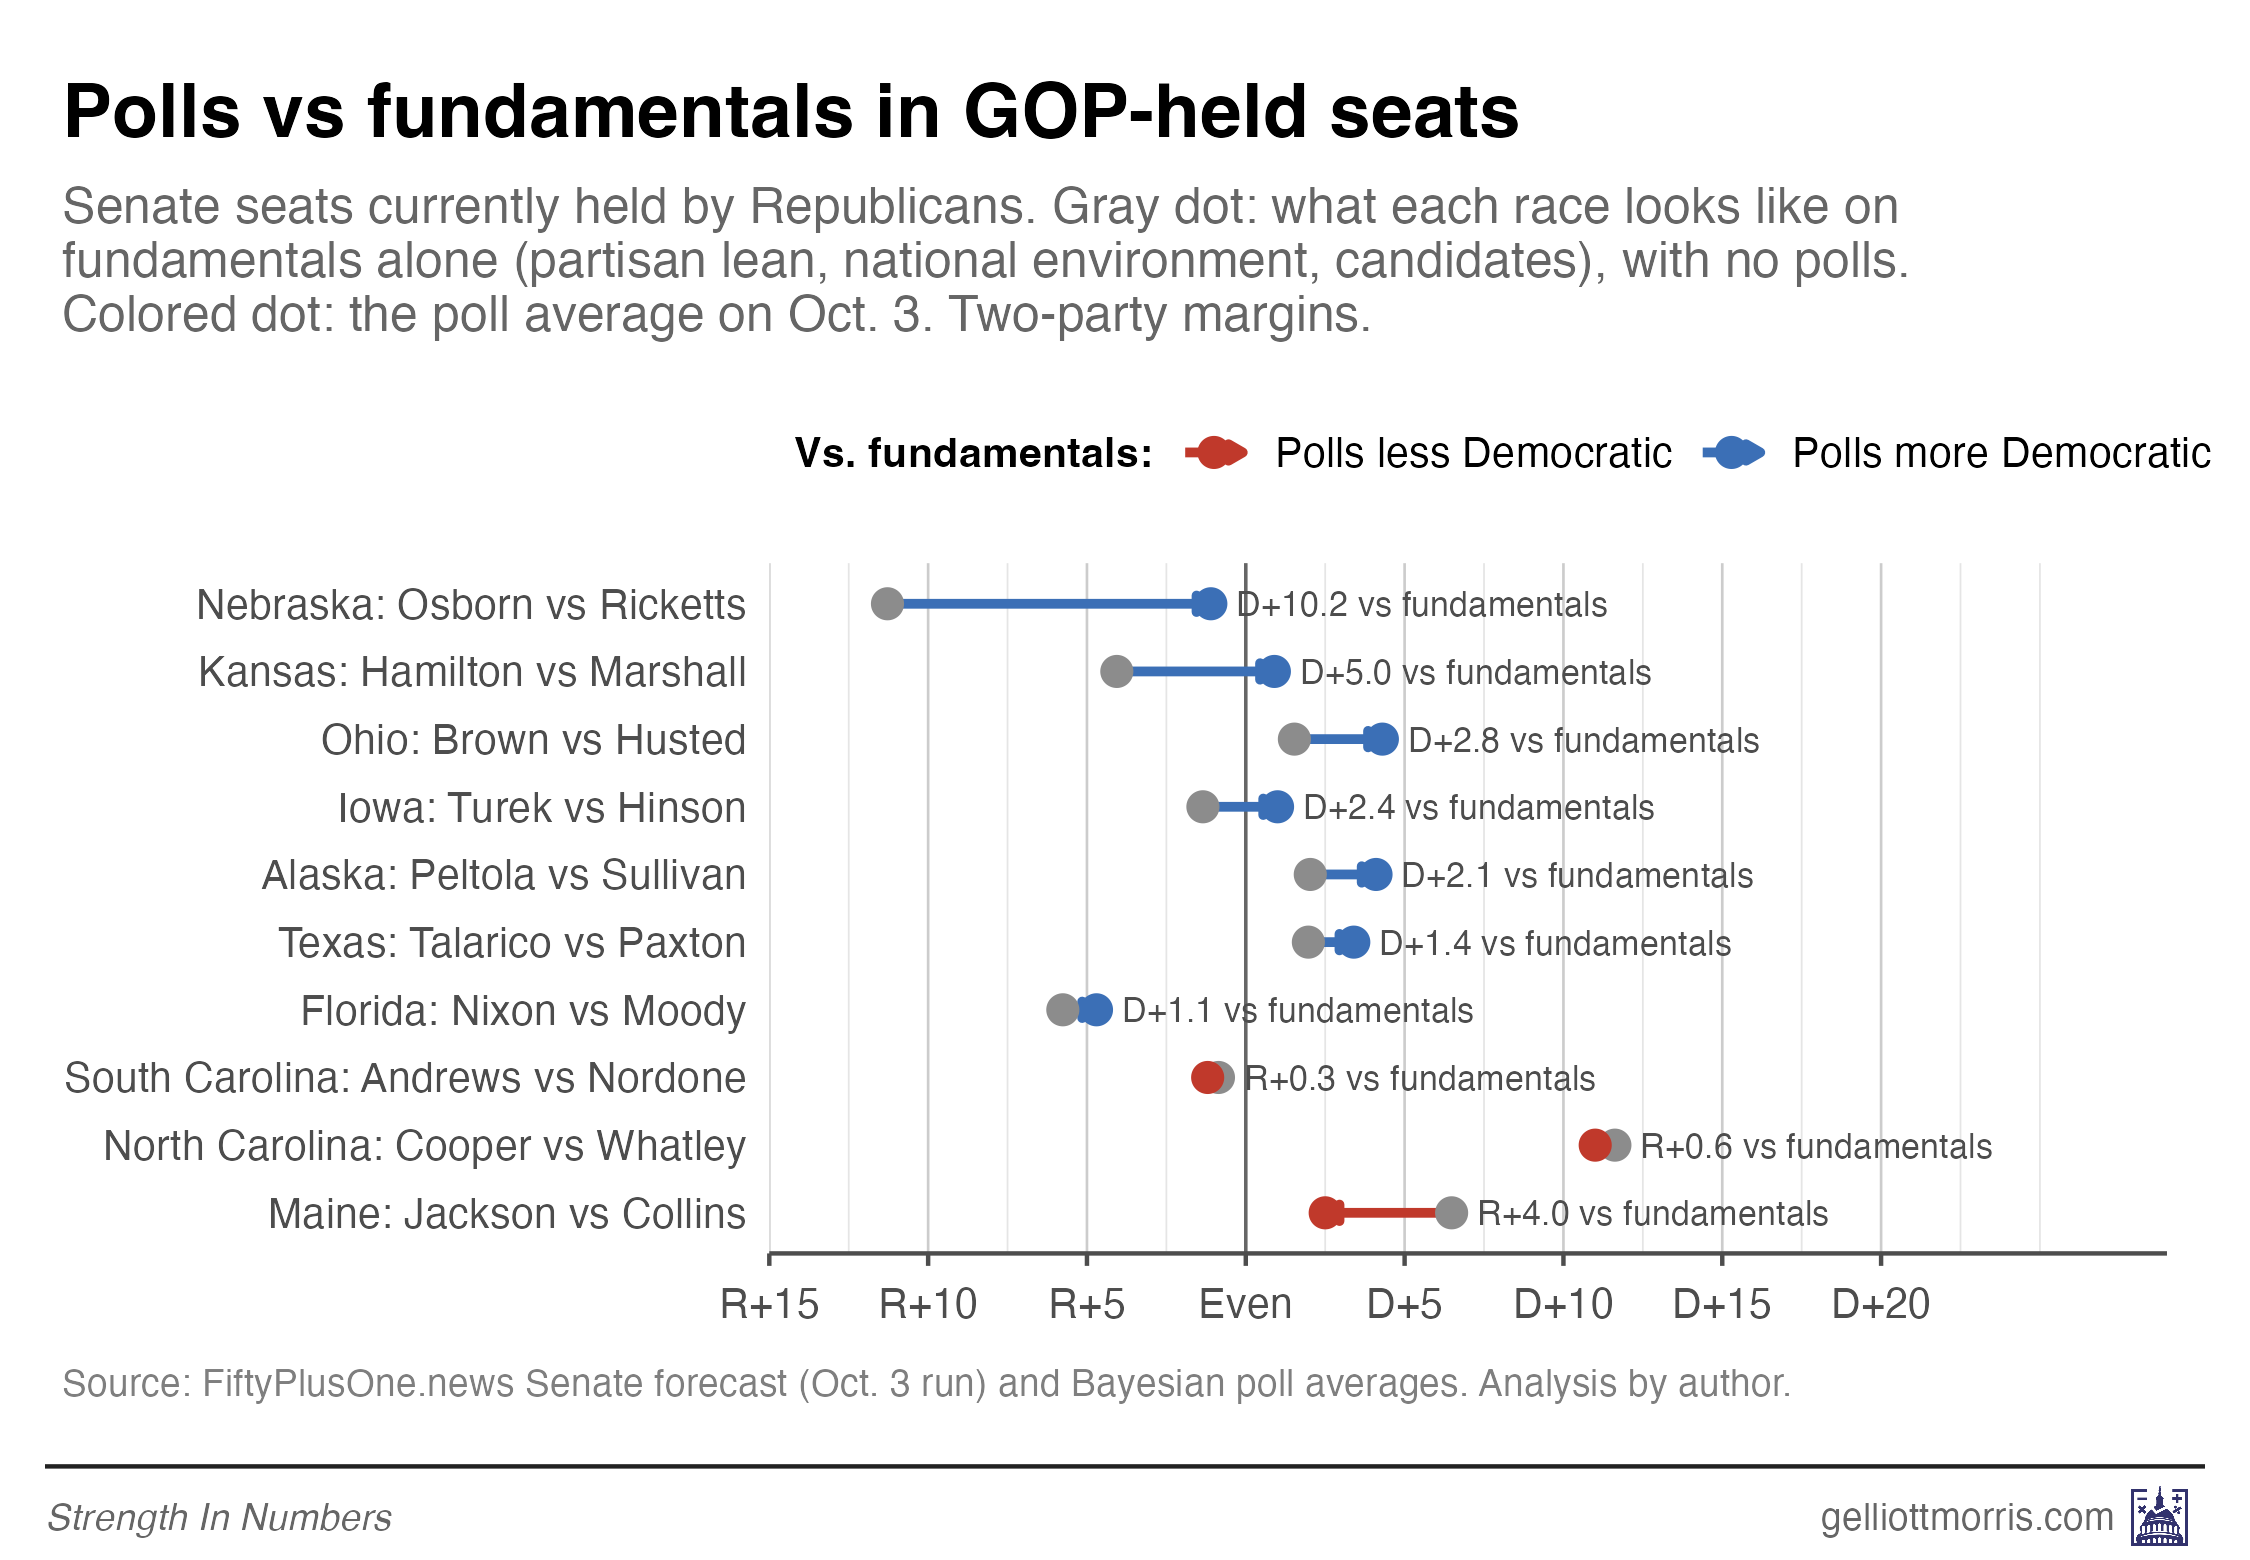
The polls on average are about half a point bluer than the fundamentals.
The one race where the polls tell a story that is fundamentally (ha) different from the fundamentals is Nebraska, where independent Dan Osborn polls a point behind Pete Ricketts in a state the fundamentals put at R+11. Our model mostly refuses to believe this and gives Osborn an 18% chance of winning. I think the fundamentals are probably wrong in Nebraska and over-indexing on Trump’s 2024 margin there.
Here’s a final thought: Pundits seeking attention are highly incentivized to predict polling errors before they happen so they can claim “I called this!” after the votes are counted. I think this is silly and a waste of readers’ attention. Silly because this exercise is historically fraught, and mostly the naysayers are just saying “these polls violate my priors” but not otherwise offering any useful/insightful/original commentary. And a waste because there’s a lot of very good journalism out there — from, for example, Strength In Numbers, Split Ticket, Nate Cohn at the Times, and others — about the mechanics of error that promote a real understanding of surveys. That is key to unlocking the potential of polls to positively shape our democracy.
So you should be prepared for polling error. There will probably be some. But nobody can tell you with any confidence ahead of time which direction it’ll run. This election looks like a blue wave whether you’re looking at fundamentals, state polls, or other indicators. If the current map shocks you, the thing to reconsider may not be the polls, but your own personal priors.
2. What Strength In Numbers published last week
It was a six-article week here at Strength In Numbers!
In Last Sunday’s roundup, I showcased results from our September Strength In Numbers/Verasight poll that found Trump’s promise to send a check worth $5,000 to every American if the Republicans hold the House and Senate at a net 18-point lead unpopular, and 71% of adults say that kind of promise is inappropriate for a president to make:

On Monday, I unveiled a new database of news headlines stretching back to 2016 that I scraped online. I showed that Iran, prices, ICE and Epstein have been the biggest stories of 2026, and that the “Trumpapalooza” GOP Midterm convention didn’t move the news agenda the way a real convention does:

Tuesday’s Deep Dive covered results on election administration from our September poll. Voters said they oppose sending ICE agents to polling places by 30 points, and several vulnerable groups said they’d be less likely to vote if ICE agents were there:

On the podcast Thursday, David Nir and I talked about how much worse (or better?) things could get for the GOP over the last (at that point) 33 days of this election. We also worked out why the House looks so lopsided in the forecasts, how Democrats got to a Senate edge through long-shot red-state races, and spoke frankly about how much of this you should believe:

Friday’s free Chart of the Week covered that for the first time in our tracking poll: a majority of Republicans and Republican-leaning independents — 52% — disapprove of Trump’s handling of prices, a net rating of -8, as diesel hit a record high. This is probably hurting Republican candidates in red states, too. If Republicans lose the Iowa and Ohio Senate races, Trump’s war in Iran will be one of the biggest causes.

And on Saturday, Paul Krugman had David Nir and me on to talk through four indicators pointing to a Democratic November. We tried to wrap our heads around why the polls might be wrong, and also why the media whiffed so badly on Trump in early 2025. Free video with a transcript:

If you’re a frequent reader of Strength In Numbers, I’m confident you will get a lot of value out of a paid subscription to the site. You’ll get the Tuesday Deep Dive every week, access to a private community for paying members on Discord, and an early look at our monthly Strength In Numbers/Verasight poll before public release.
More than that though, you’ll be supporting original journalism about American politics that is rooted in data that we collect, together, as a community devoted to the importance of public opinion.
3. Even more numbers!
In an era with almost no ticket-splitting, Henry Olsen finds a model of House election outcomes based solely on the final generic ballot average came within 11 seats of the actual House majority in each of the last three midterms, and within two seats in 2014 and 2018. Run the same method on an 8-point Democratic average, and you get a Democratic majority of 225 to 232 seats. How many House seats will the Democrats win? The polls may already know.
I think Olsen is probably understating democrats here. I made the same model as part of a 2026 redistricting analysis back in May, and one of the things I learned is that this model badly underestimates Democratic seats in 2020 and 2024. That’s because Democratic House candidates have generally been running ahead of presidential candidates by a couple of percentage points. My best guess is he is about 10 seats off what an adjusted model (adjusted, in this case, to make it more accurate in 2020, 2022, 2024, and 2026) would show.
Pew has an analysis of AI “digital twins” that is pretty damaging for the synthetic sampling crowd. Pew finds that AI-imputed answers for their panelists missed real data from their human respondents by 12 percentage points on average, and the models exaggerated differences between groups. Pew says none of its demographic groups averaged under 12 points of error. How well synthetic samples replicate public opinion
Related: My whitepaper analysis on the same subject for Verasight, published this summer, found much the same thing Pew does here, with an average error of synthetic data vs benchmarks of 11 points.
The University of Maryland’s Program for Public Consultation surveyed more than 20,000 adults across 11 battleground states and 28 battleground House districts on taxes. An annual tax of 2% on wealth over $50 million and 3% over $1 billion is popular with a wide swath of Americans, including a majority of Republicans. Common Ground in the Battlegrounds: federal taxes
Michael Tesler at Good Authority: Google searches for “testosterone booster” track Trump’s 2024 state vote share at r = .85, and a July YouGov poll finds Republicans call boosting men’s testosterone a good thing, 39% to 8%. Republicans’ fascination with testosterone in three charts
Dan Drezner starts gaming out Democrats’ worst cases for November, as a form of “exposure therapy.” Related to the main contents of this newsletter. Exposure Therapy for Democrats, Part One
And that’s it for this week! Thanks for reading. Strength In Numbers will be back in your inbox on Tuesday.
Comments are OPEN on this post. If you have a question or comment you want answered/addressed in next week’s podcast or another article, leave it below!


There are plenty of things MattY could rightfully be called, but "economics blogger" is not one of them. That's a bit of an affront to actual economists and economics bloggers. Noah Smith -now that's an "economics blogger"
Is Indiana so far red that potentials are not even considered?