


This is my weekly Sunday roundup of new political data published over the last seven days. It is free to read, but if you want to support independent data-driven political journalism, become a paying subscriber and get additional data products and premium analysis at least once weekly.
Before we get going, an important programming note! The September Strength In Numbers/Verasight poll will be coming out later this week. If you are a reporter and would like to be added to our email embargo list for receiving toplines and crosstabs early, email me at pollingATgelliottmorrisDOTcom.
1. How to update your beliefs with new polling data, the Strength In Numbers way
The Cook Political Report released its first Battleground District Project poll of the fall last Thursday, and the write-up was the subject of some conversation in the Strength In Numbers Discord on Friday-Saturday. I’m explaining some of the math I did there for paying subscribers here because I think it will be useful to a broader audience.
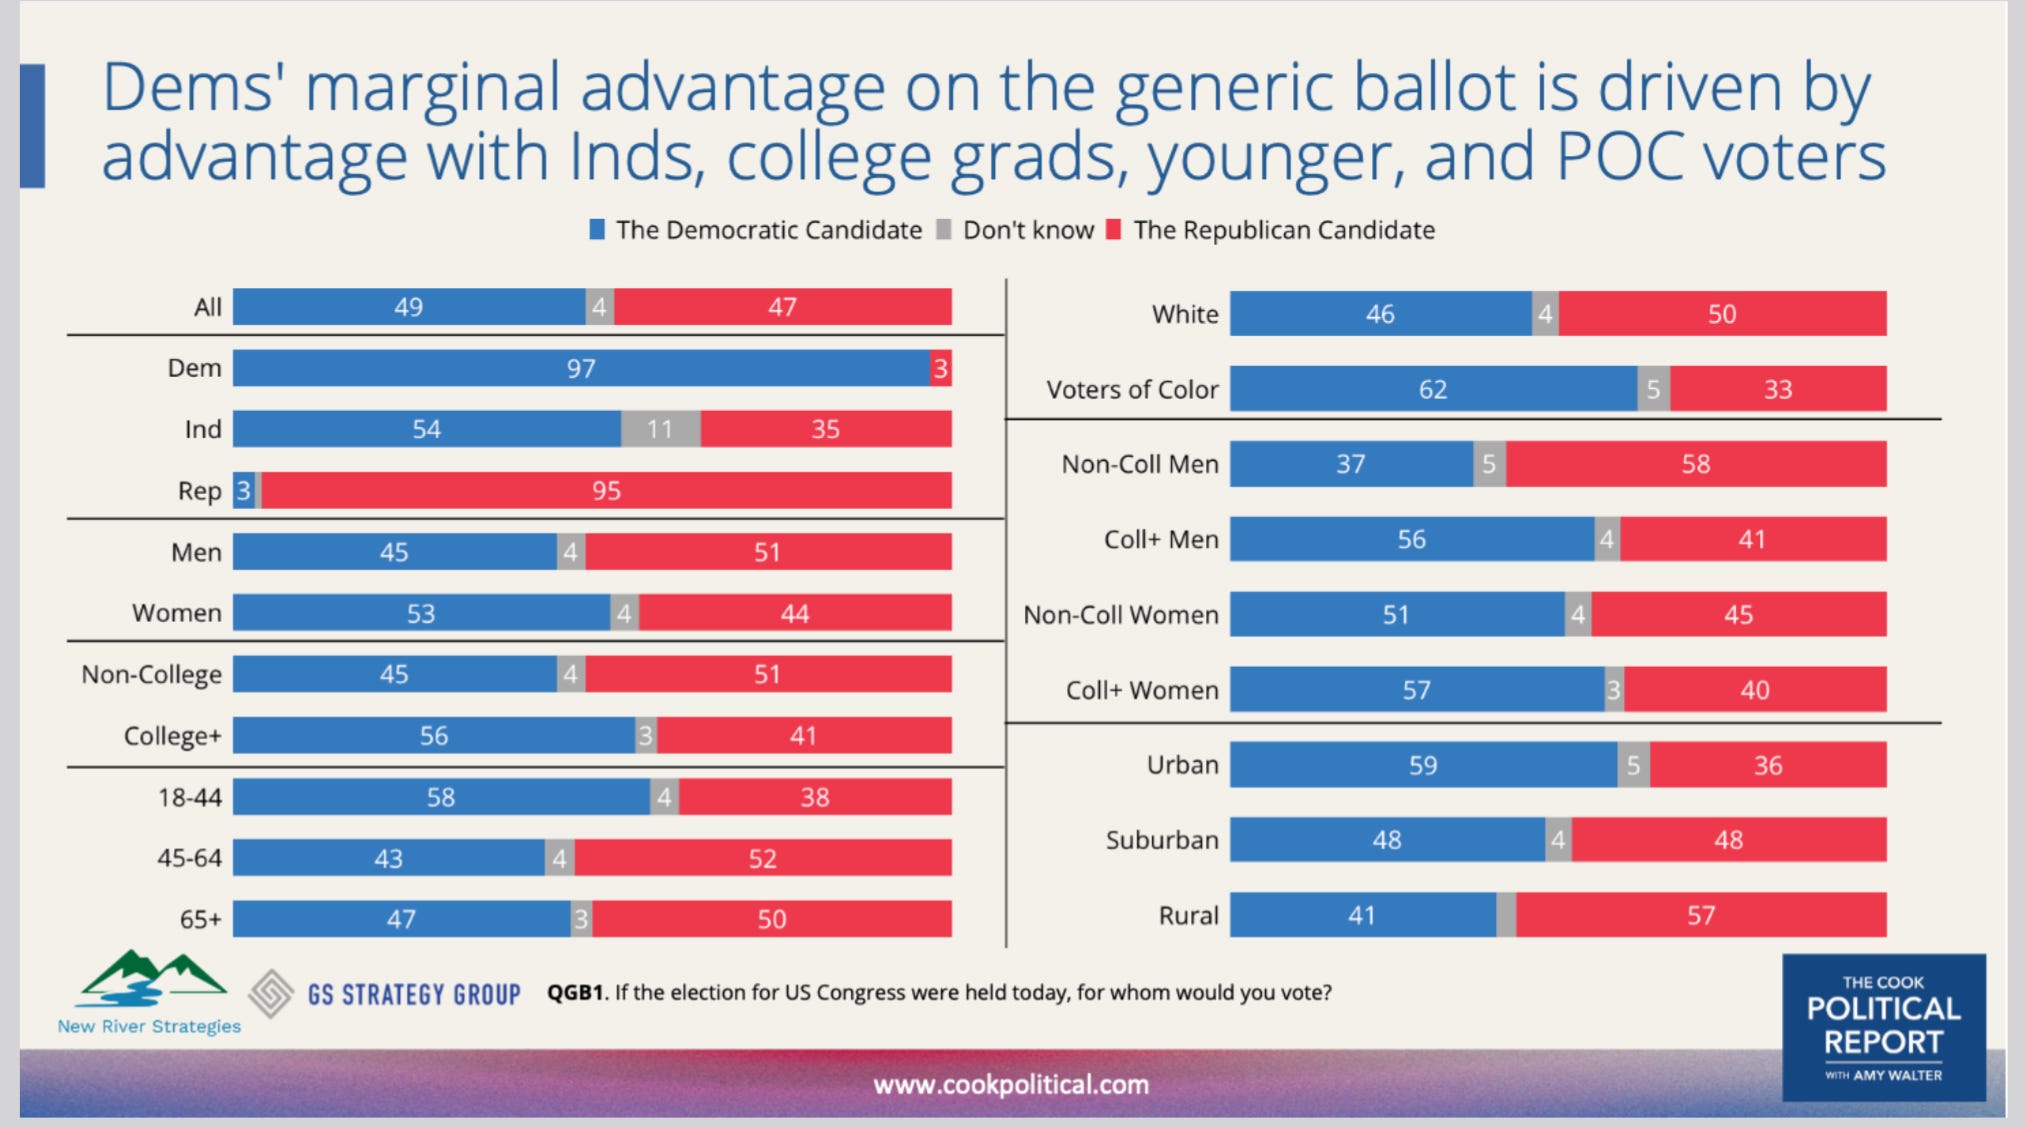
Cook writes that Democrats hold a small 2-point lead in seats they have identified as Lean Democrat, Lean Republican, or Toss-up, a swing of 7 points since 2024 (Trump won the average seat in these buckets by about 5 points, and 5 - -2 = +7). Carrie Dann and Amy Walter write:
Democrats’ small lead on the generic ballot among voters in these red districts suggests that Democrats’ gains this fall will mostly be limited to districts Trump carried by 10 points or fewer. While that’s cold comfort for Republicans running in districts that narrowly went red in 2024, it’s also a reminder of the compactness of the House playing field — 86% of seats held by Republicans are those Trump carried by more than 10 points.
Here are the poll details. Cook, GS Strategy Group, and New River Strategies surveyed 1,052 likely voters from September 8-11 across the 37 districts Cook rates as competitive. Those seats went for Trump by 4.8 points on average in 2024. Today, the generic ballot in them is Democrats 49, Republicans 47, and Trump’s job approval is 42-58. That’s how they get that 7-point swing (okay, 6.8 points, whatever).
These numbers may help explain why Cook, as well as other race raters, are more bearish than the statistical modelers in assessing Democrats’ prospects for the November midterm elections. As I reported Friday, even if you account for the historical tendency of expert handicappers to push toss-up and lean ratings toward the out-party in midterm elections, they’re still forecasting 229-230 seats for the Democrats, which is about 5 seats less than the quantitative forecasters on average (and 7-8 less than the median at 50+1). If you take Cook’s ratings at face value — eg, you split “toss-up” races 50-50 — the organization is “predicting” Democrats to win a bare 218-seat majority.
In reality, they know most of these seats will go Dem; they just haven’t called it yet. One expert described what the forecasters are doing to me as “trying to skate to whether the puck is” on Election Day, not forecasting outcomes as forecasters do.
Okay, but those are the ratings, and this new data from Cook is just one poll. Yes, it’s certainly less blue than the forecasters, which are officially now in Big Blue Wave territory. So how can you reconcile these different measurements? If you’re starting from the position that the election will be around D+7 to D+9, how do you square that with the Cook poll that shows just D+5? (I get to D+5 by adding 7 to -2.3, since Republicans won the House vote by 2.3 points in 2024.)
Well, what you should do is treat the poll as you would every other poll: one survey that is subject to random sampling error and potential non-response bias, and which shouldn’t shape your whole worldview. How does the Cook poll compare to other polls in the districts Cook sampled?
To answer, I pulled every non-partisan, non-internal district poll we have compiled at FiftyPlusOne.news in the 37 seats Cook targeted. We have 13 such surveys, covering 13 districts (the other 24 districts have no qualifying independent non-partisan public poll at all). Those 13 polls average Democrats +4.8 in seats that Trump carried by 6.9 points in 2024, for a swing of D+11.7 points, with a median of 13.1. So we have two readings of the same 13 battlegrounds that are roughly 5 points apart.
If you were to treat each poll as an independent read of the political environment, via laws of sample size, the district polls end up having about six times as much weight as Cook’s single survey. They have more respondents in total, and come from nine different pollsters whose house effects partly cancel out. Cook is one survey, with roughly 28 respondents per district and a margin of error of 3-4 percentage points. (All these polls also carry a shared potential for cycle-wide polling error, but since that is shared I’m ignoring it here.)
If the independent 13 polls are showing a D+11.7 swing, with a standard deviation of the mean of 2.2 points, and you get a new reading at a D+6.8 swing (Cook), with a standard error of 4.5 points (sampling error plus the design effect and potential house effect from Cook’s pollsters), then you’d naively update the +11.7 (+/- 2.2) to +10.8 (+/- 2.0). (The math for this is given in Bayes theorem via the conjugate normal update.)
This is a good start, in that you’re now thinking of the data as a Bayesian and in an additive sense — not Cook vs Everyone Else but what all the data is saying in combination. But there’s also another factor that I’ve been hiding from you.
Cook didn’t ask about voting for individual candidates, but voting for parties. They asked voters in these districts the generic ballot, not support for candidates with their names. I showed last week that Democrats typically do better when they are named instead of asked about generically, just with party labels, so this is an important factor to take into account if you’re trying to forecast an election... where candidates have names.
The seats that have been polled by independent pollsters include districts Democrats are holding that Trump won by double digits — Henry Cuellar in TX-28, Kathy Castor in FL-14, and Don Davis in NC-01 — and the independent polls show a swing of 6.5 points in Lean D seats, 14.2 in Toss Ups, and 16.3 in Lean R seats. The redder the seat, the further Democrats run ahead of the “generic Democrat” label.
If you assume that Democrats get a 5-point boost for being named — maybe the party recruited well, but Democrats also have an incumbency advantage in competitive districts — the two sources reconcile almost exactly. Frankly, 5 points seems high to me, but that’s just a vibe check; and as shown above, if you assume the data is in conflict, you still get to a swing of about 9 points and a national environment of about D+7.
Our polling nowcast at FiftyPlusOne for these same districts shows a +9.8 swing, which is a D+7.5 national environment. That’s what you’d expect from a model already mixing the above non-partisan district polls with district-level campaign internals and the national generic ballot. So it’s not that far off.
Cook’s poll should move your estimate of the 2024-2026 swing from +9.8 to roughly +9.2. This corresponds to a national environment of D+6.9, down from D+7.5. That’s a real update, but still firmly in blue wave territory — especially once you control for likely additional Dem gains in the generic ballot, candidate quality differences, and fundraising favoring Democrats.
What D+7 in votes means in seats
For some context, I have translated the national margins above to naive seat estimates by counting up the number of Republican-held seats that Trump lost or won by less than (6, 8, 10, 12) points. If Cook is at D+5, that works out to about 221 seats for the Democrats:
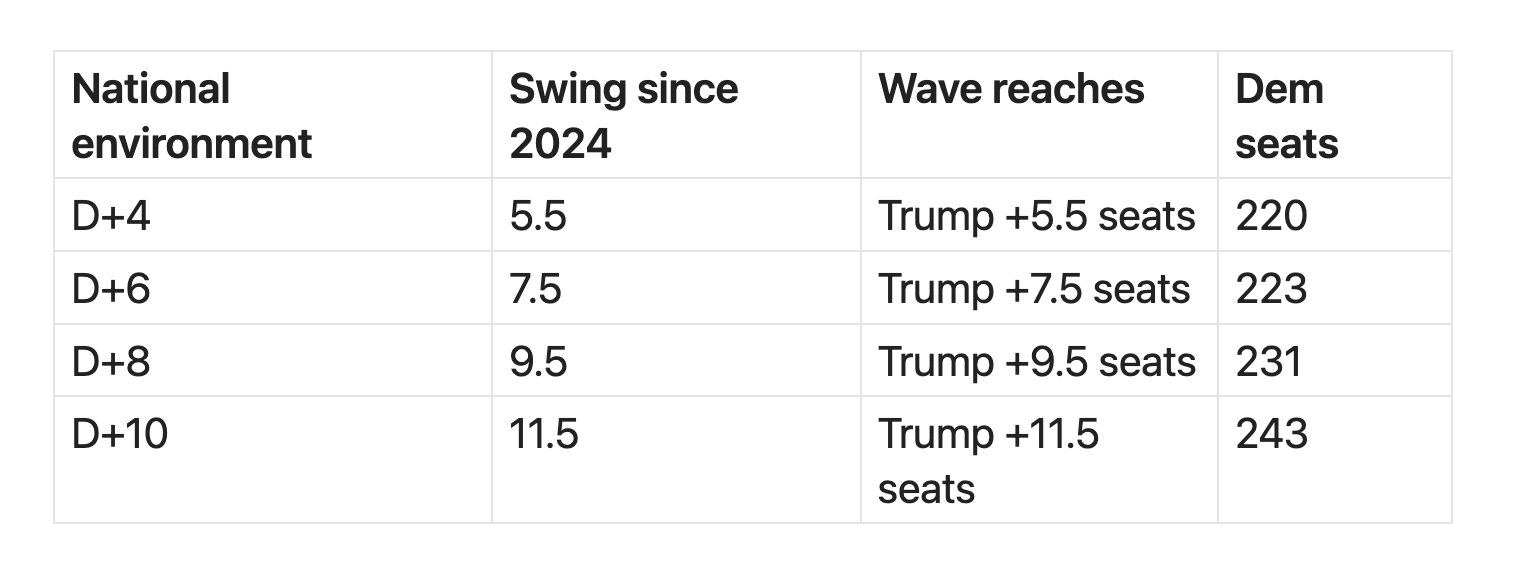
With the models around D+8 today (a 9.5-point swing), you can see why they are giving a seat-level picture that looks so optimistic (for Democrats) when compared to Cook. There are a lot of seats up for grabs in the D+5 to D+8 range, and at D+10 nationally, Democrats are favored in 243 districts. Gains accelerate even more beyond D+10, which is possible but not necessarily likely.
And this brings me back to a line in Cook’s report about gains being “limited to districts Trump carried by 10 points or fewer.” This sounds small (Cook points out 86% of GOP-held seats are redder than Trump +10), but it’s not. A wave that reaches Trump +10 seats is a national environment of about D+8.5. On this map, that’s 234 seats — one seat shy of the Democratic total from 2018, when Trump’s approval rating was higher than it is today, and before pandemic-era inflation increased anti-incumbent sentiment significantly.
Hopefully this helped you understand how we approach the topic of updating our beliefs with new data here at Strength In Numbers. One principle that comes out of the math here is that individual polls should not alone carry that much weight in our forecasts. While Cook is prolific and this is a survey across many different districts, at the end of the day, it’s just one poll. Treat it appropriately.
2. What Strength In Numbers published last week
Last Sunday’s used polling data from YouGov to show that Democrats are doing better in named-candidate polling than the generic ballot:

Tuesday’s Deep Dive addressed the under-discussed potential that polls could be understating support for Democrats, rather than overstating it as many analysts assume. My simulations show the way pollsters are weighting their samples is potentially costing Democrats up to one point in the generic ballot:

On Thursday, David Nir and I discussed this on the podcast, and I made the case that the current political environment was very predictable by the political science “fundamentals”. We also did a state-by-state tour of the current FiftyPlusOne election forecast:

And Friday’s free Chart of the Week looked at the expert handicappers’ ratings for November. Across the last four midterms, when Cook, Inside Elections, and Sabato said a race was a “tossup,” those seats broke for the out-party about two-thirds of the time. This is pretty convincing evidence that their current seat totals for either party are understating Democrats.

If you’re a frequent reader of Strength In Numbers, I’m confident you will get a lot of value out of a paid subscription to the site. You’ll get the Tuesday Deep Dive every week, access to a private community for paying members, and first access to our monthly Strength In Numbers/Verasight poll. More than that though, you’ll be supporting original, data-driven journalism about American politics.
3. Even more numbers!
Pew’s Scott Keeter and Courtney Kennedy have the definitive explainer on weighting by past vote. They explain (like I did this week!) how past-vote weighting is risky, but why it still helps polling on average so pollsters should probably do it anyway. Weighting by past vote, I explained last week, is a bet that partisan non-response bias in polling is larger than potential recall bias, which is probably (but not definitely) true in 2026. Much bigger question mark about 2028, though.
Nate Cohn digs into this week’s Times/Siena poll, which has Democrats up 8.5 on the generic ballot among likely voters. His spends a lot of time on the question of whether Republicans can still hold the Senate by painting Democrats as too far left. A ‘Blue Wave’ May Be Building, but How High?
UMass Amherst went into the field in late August and found just 11% of Americans would support an AI data center being built in their community, while 65% oppose it. Even Republicans are against it nearly 3-to-1 (a rare bipartisan consensus these days), and Trump is 34 points underwater on his handling of AI. Just 1 in 9 Americans Support AI Data Center Construction in their Local Communities
Annenberg’s Constitution Day survey, fielded in August, found that 35% of American adults can’t name all three branches of government, just 9% can name all five First Amendment rights, and 25% think the right to bear arms is in the First. I have written previously about low-information voters.
Survey methodologist (and SIN subscriber!) Raphael Nishimura built a nice interactive app for teaching how sampling actually works. It’s in Portuguese, but your internet browser can translate that. Raphael Nishimura post on his web app.
And that’s it for this week! Thanks for reading. Strength In Numbers will be back in your inbox on Tuesday.
Got more for next week? Email your links or add to the comments below!


I'm an old guy who nearly failed statistics 60 years ago, but 35% who can't name the three branches of government sounds about like the percent who will still vote MAGA as the world burns.
The google tells me that the Cook Political Report was first published in 1984. As an official old person who has been voting since the 70s, I wonder if Charlie Cook is having difficulty naming and claiming his biases? I know I see the worlds of politics a lot differently now than I did in the mid-80s. Social scientists and sociologists think that our heads and beliefs get a little (or a lot) more brittle with age. It is harder for old peeps to adjust long-held views. So maybe The Cook report needs to get out of the office and go talk with some nonwhite 20 and 30 year olds. Those youngsters all have very different interpretations of politics than I did at that age.
Thanks for doing what you do.