


As of writing, Democrats have won back their majorities in the U.S. House and Senate in a historic thumpin’ for the Republican Party. That Democrats have won both chambers is not a surprise — our model gave them a 99% chance in the House and a 79% chance in the Senate — but the size of their victory is larger than most pollsters and pundits expected.
The Democrats have won the largest House popular vote victory for any party since 1974, when the Watergate Scandal rocked the Republicans to their core. The 2026 election is a Watergate-level rebuke of the incumbent party. (Some of us saw this coming!)
Democrats will win at least 55 seats in the Senate, which is more than the median forecast of 53 seats we issued at 50+1 but inside our confidence interval, and at least 250 seats in the House, about 10 more than our median forecast. In general, 50+1 was closer to the result than any other forecaster, and especially the expert race handicappers. I’ll be publishing those results on the FiftyPlusOne website once we have more final results in key states.
There will be a lot of time to dissect these surprising results. Analysts will pore over county-level results (I have some graphs up already) and the polls. Pundits will craft narratives about politics that affirm their priors and support their time. I’m sure Strength In Numbers will even participate in some of the debates over what this all means.
But before doing that, I want to write to you, my readers, about why I’m feeling particularly emboldened by the results of this election. Not in terms of the partisan outcome per se, but because of what it says about the value of this publication.
If you like the free version of SIN, consider becoming a paying subscriber to get access to our private community and additional premium analysis at least once weekly. Paying members of this community keep Strength In Numbers running by supporting the time and data collection it takes to do analyses like this one.
You see, oftentimes this election cycle, I have felt like Strength In Numbers was off on its own little predictive island, seeing worse news for Republicans on multiple angles than other more popular pundits and forecasters. Some have accused me of partisan bias and “resistance maximalism,” and others have called my methods “sloppy” or have outright ignored this publication despite its nominal growth and rising influence.
To those people, I devote the following graph, which shows the error in polls of the House popular vote for all firms that released national likely voter polls in the final three weeks of the election. Strength In Numbers is tied for first as the most accurate pollster of the 2026 midterms.
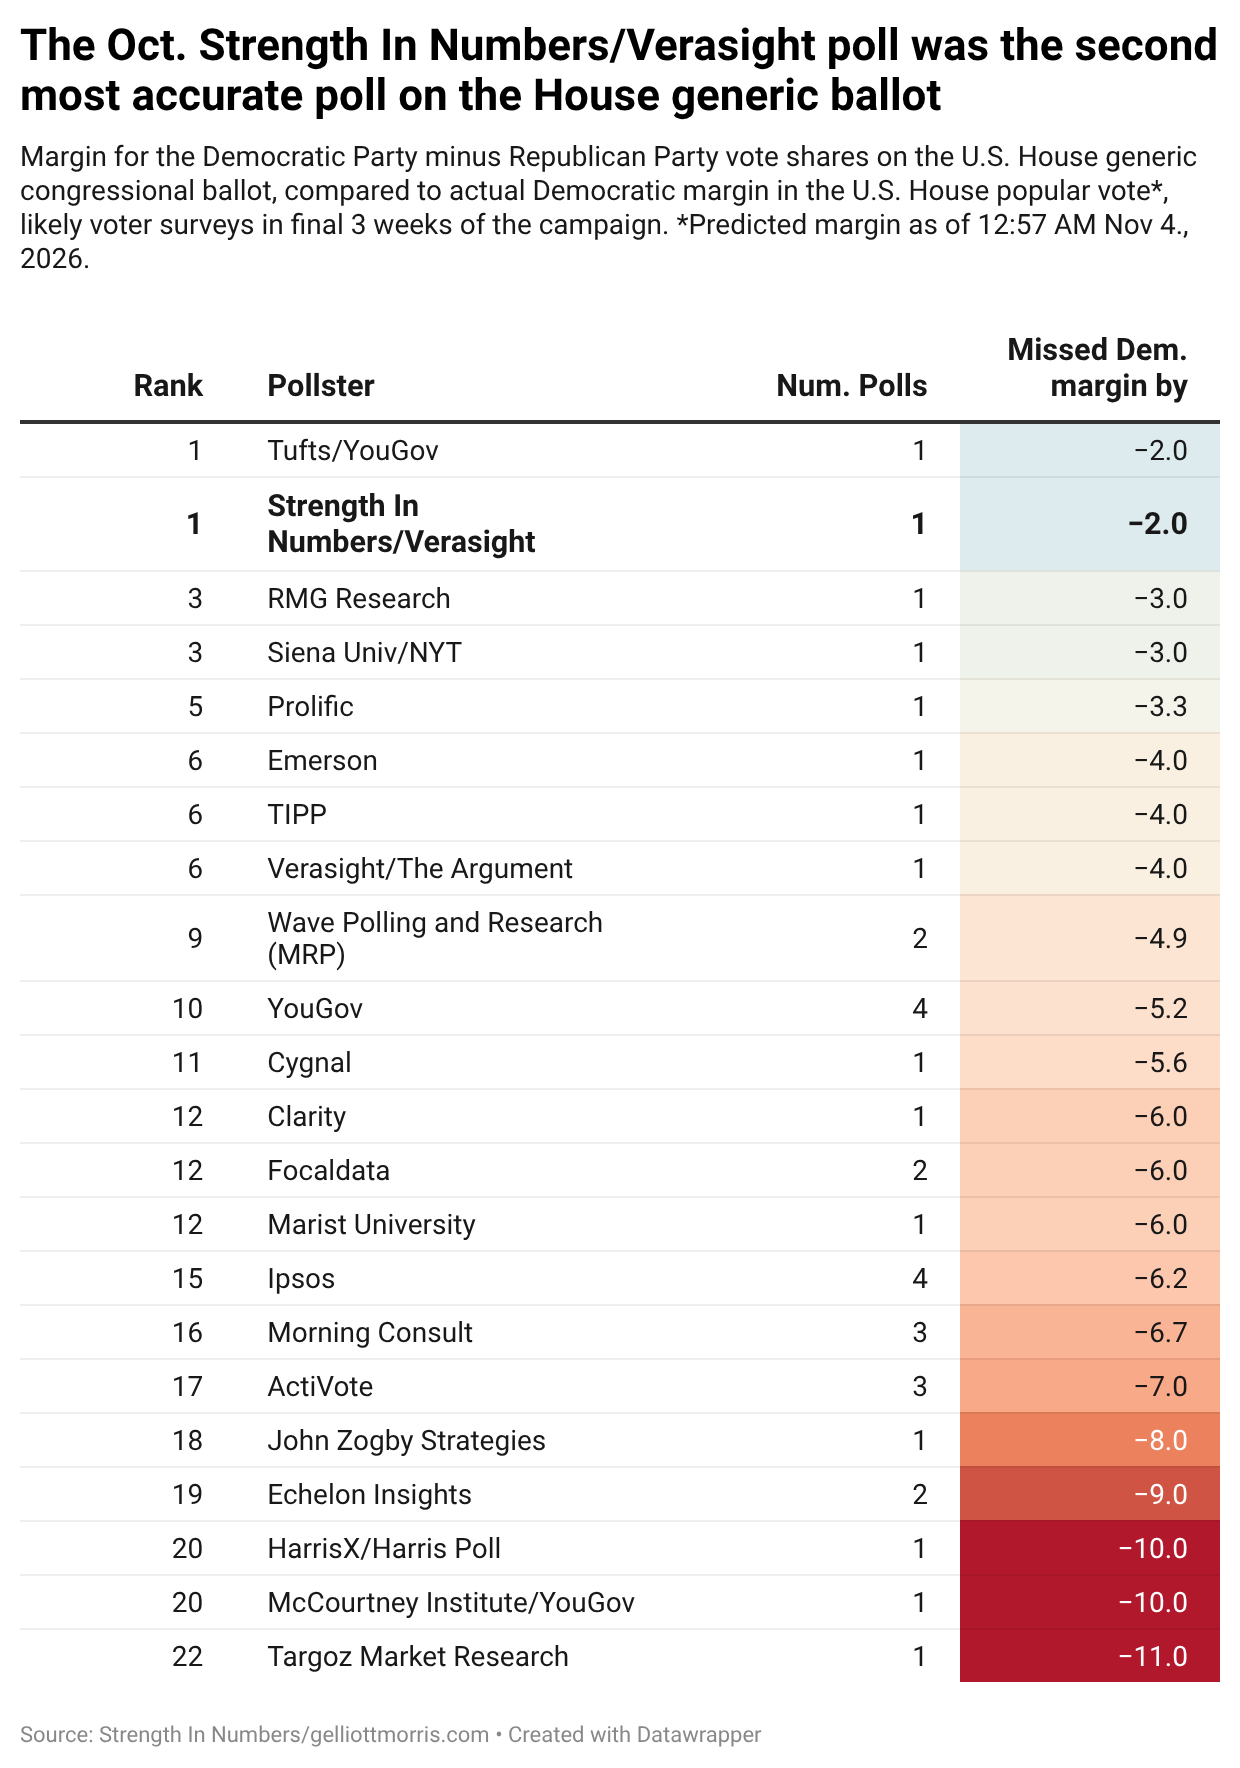
Our polling project with Verasight yielded a final prediction of D+12 among likely voters two weeks ago, and D+14 if you looked only at the behavior of people who said they were definitely going to vote. As of writing, it looks like Democrats will win the House popular vote by about 13-14 percentage points.
The SIN/Verasight poll stands out as more accurate than many other popular media surveys and well-funded operations. Republican firms fill the bottom, having underestimated Democrats significantly — while SIN is in the company of the New York Times/Siena poll and Tufts University/YouGov surveys. I consider this performance an outright coup for us, a validation of the efforts of both myself and especially the methodologists at Veraisght in tackling increasingly hard problems of survey research with new techniques and technologies.
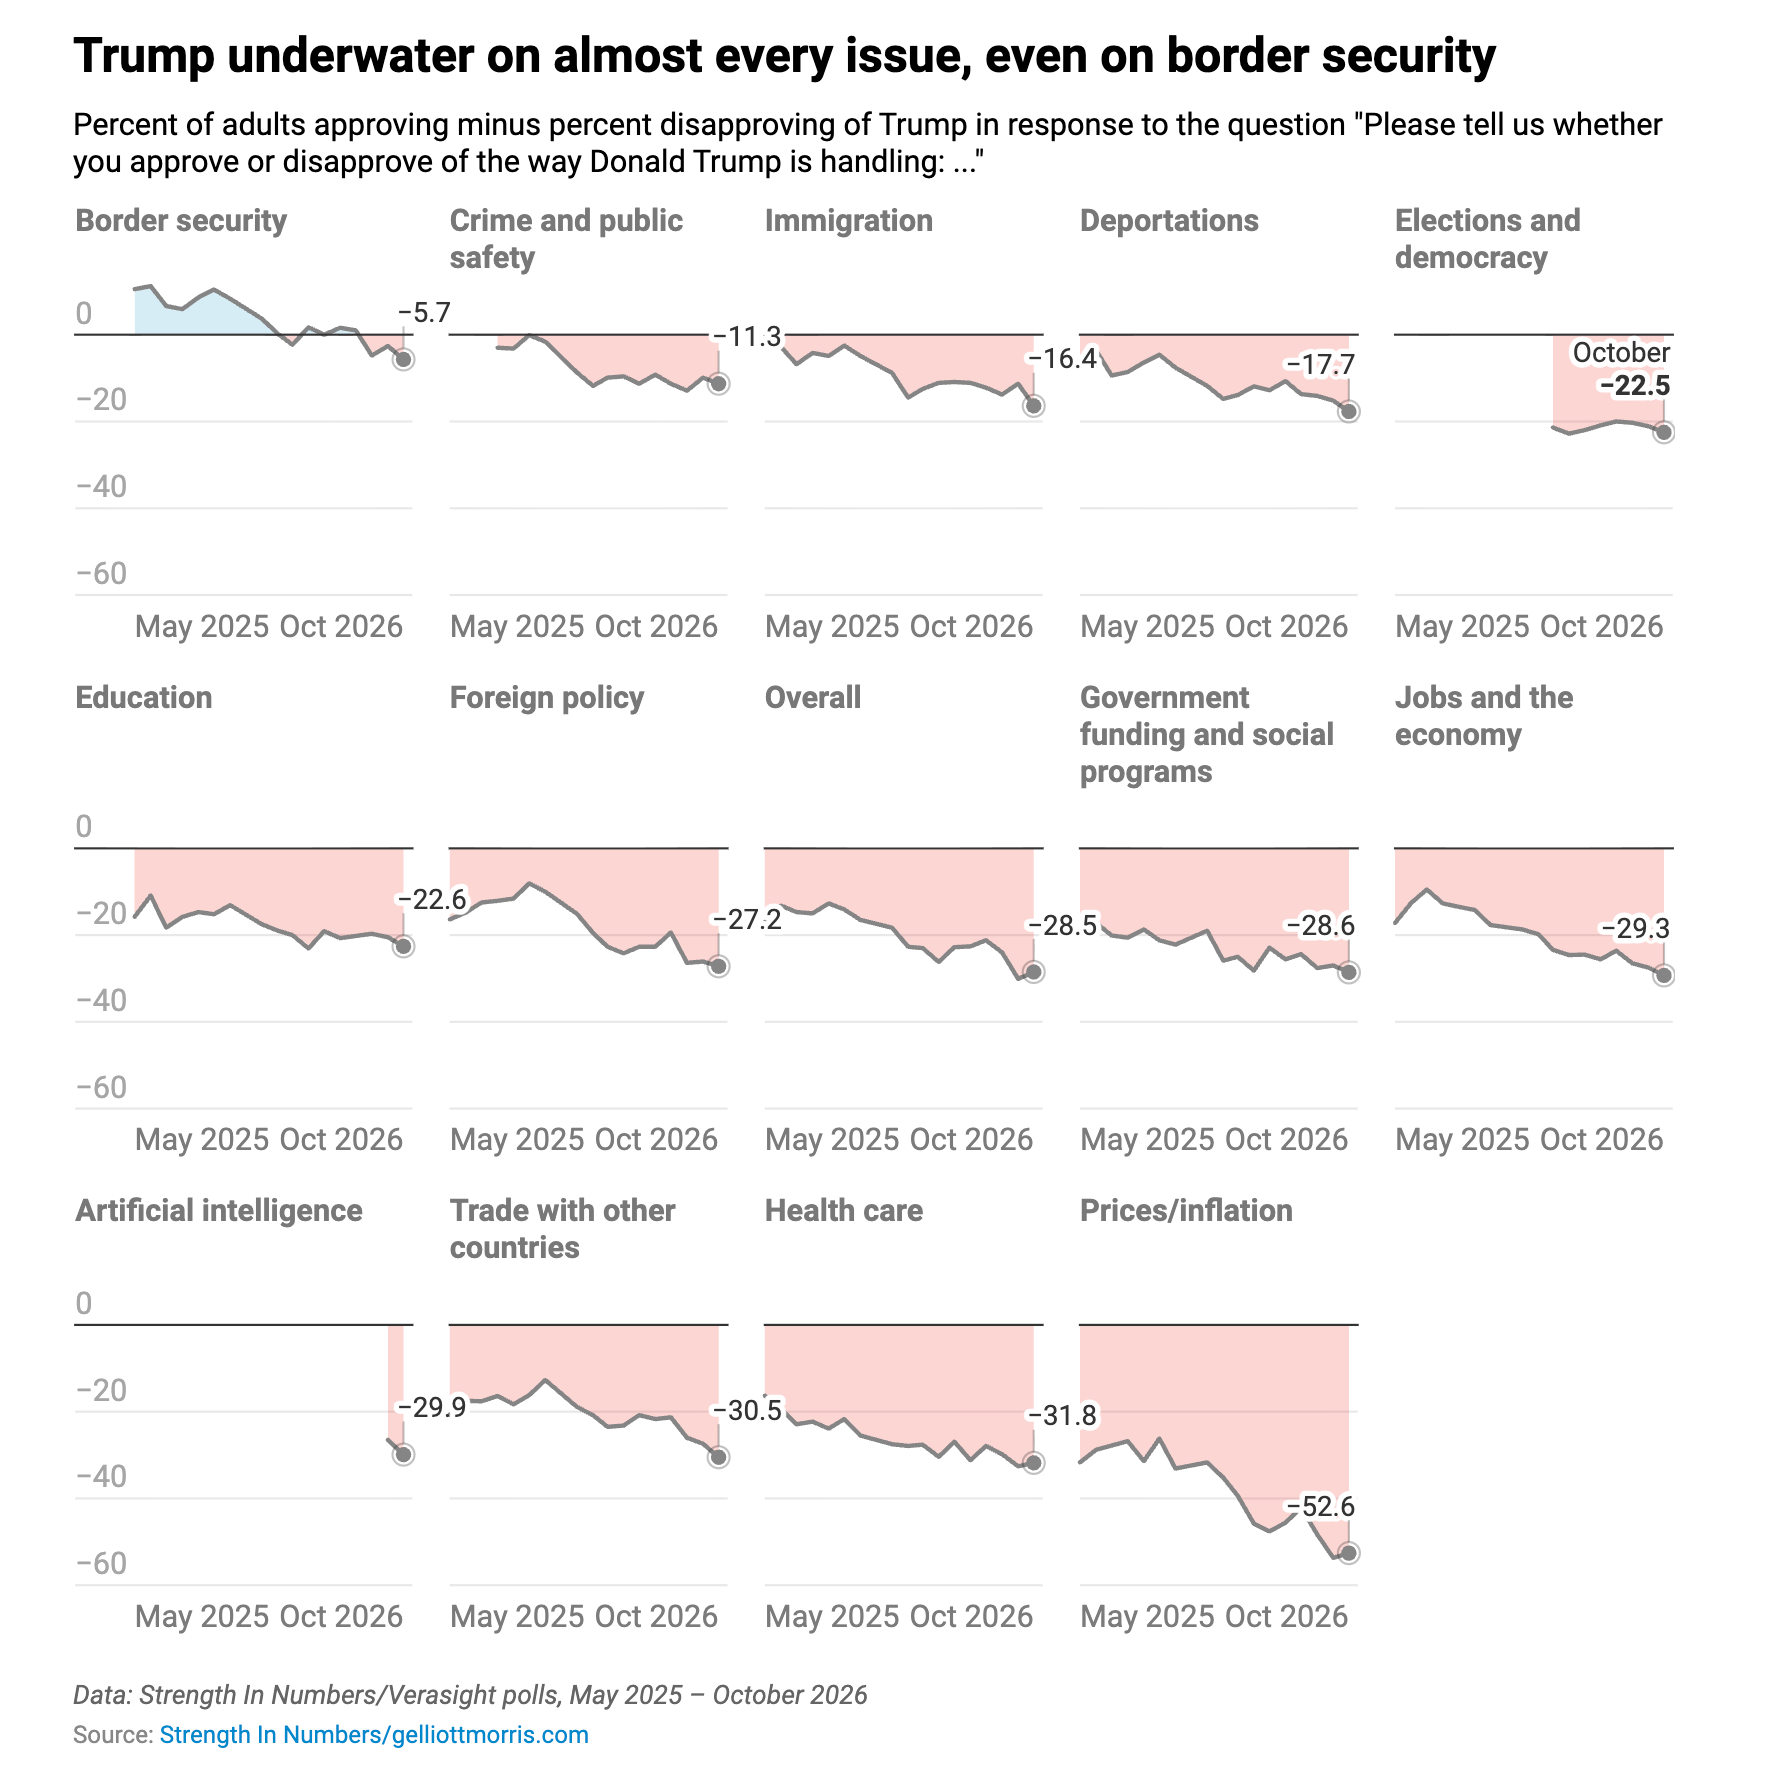
But it’s not just the toplines where SIN got this election right. I also devoted disproportionate attention to covering how Americans feel about Trump’s handling of the issues, as seen in this chart of our poll results over the past 19 months:
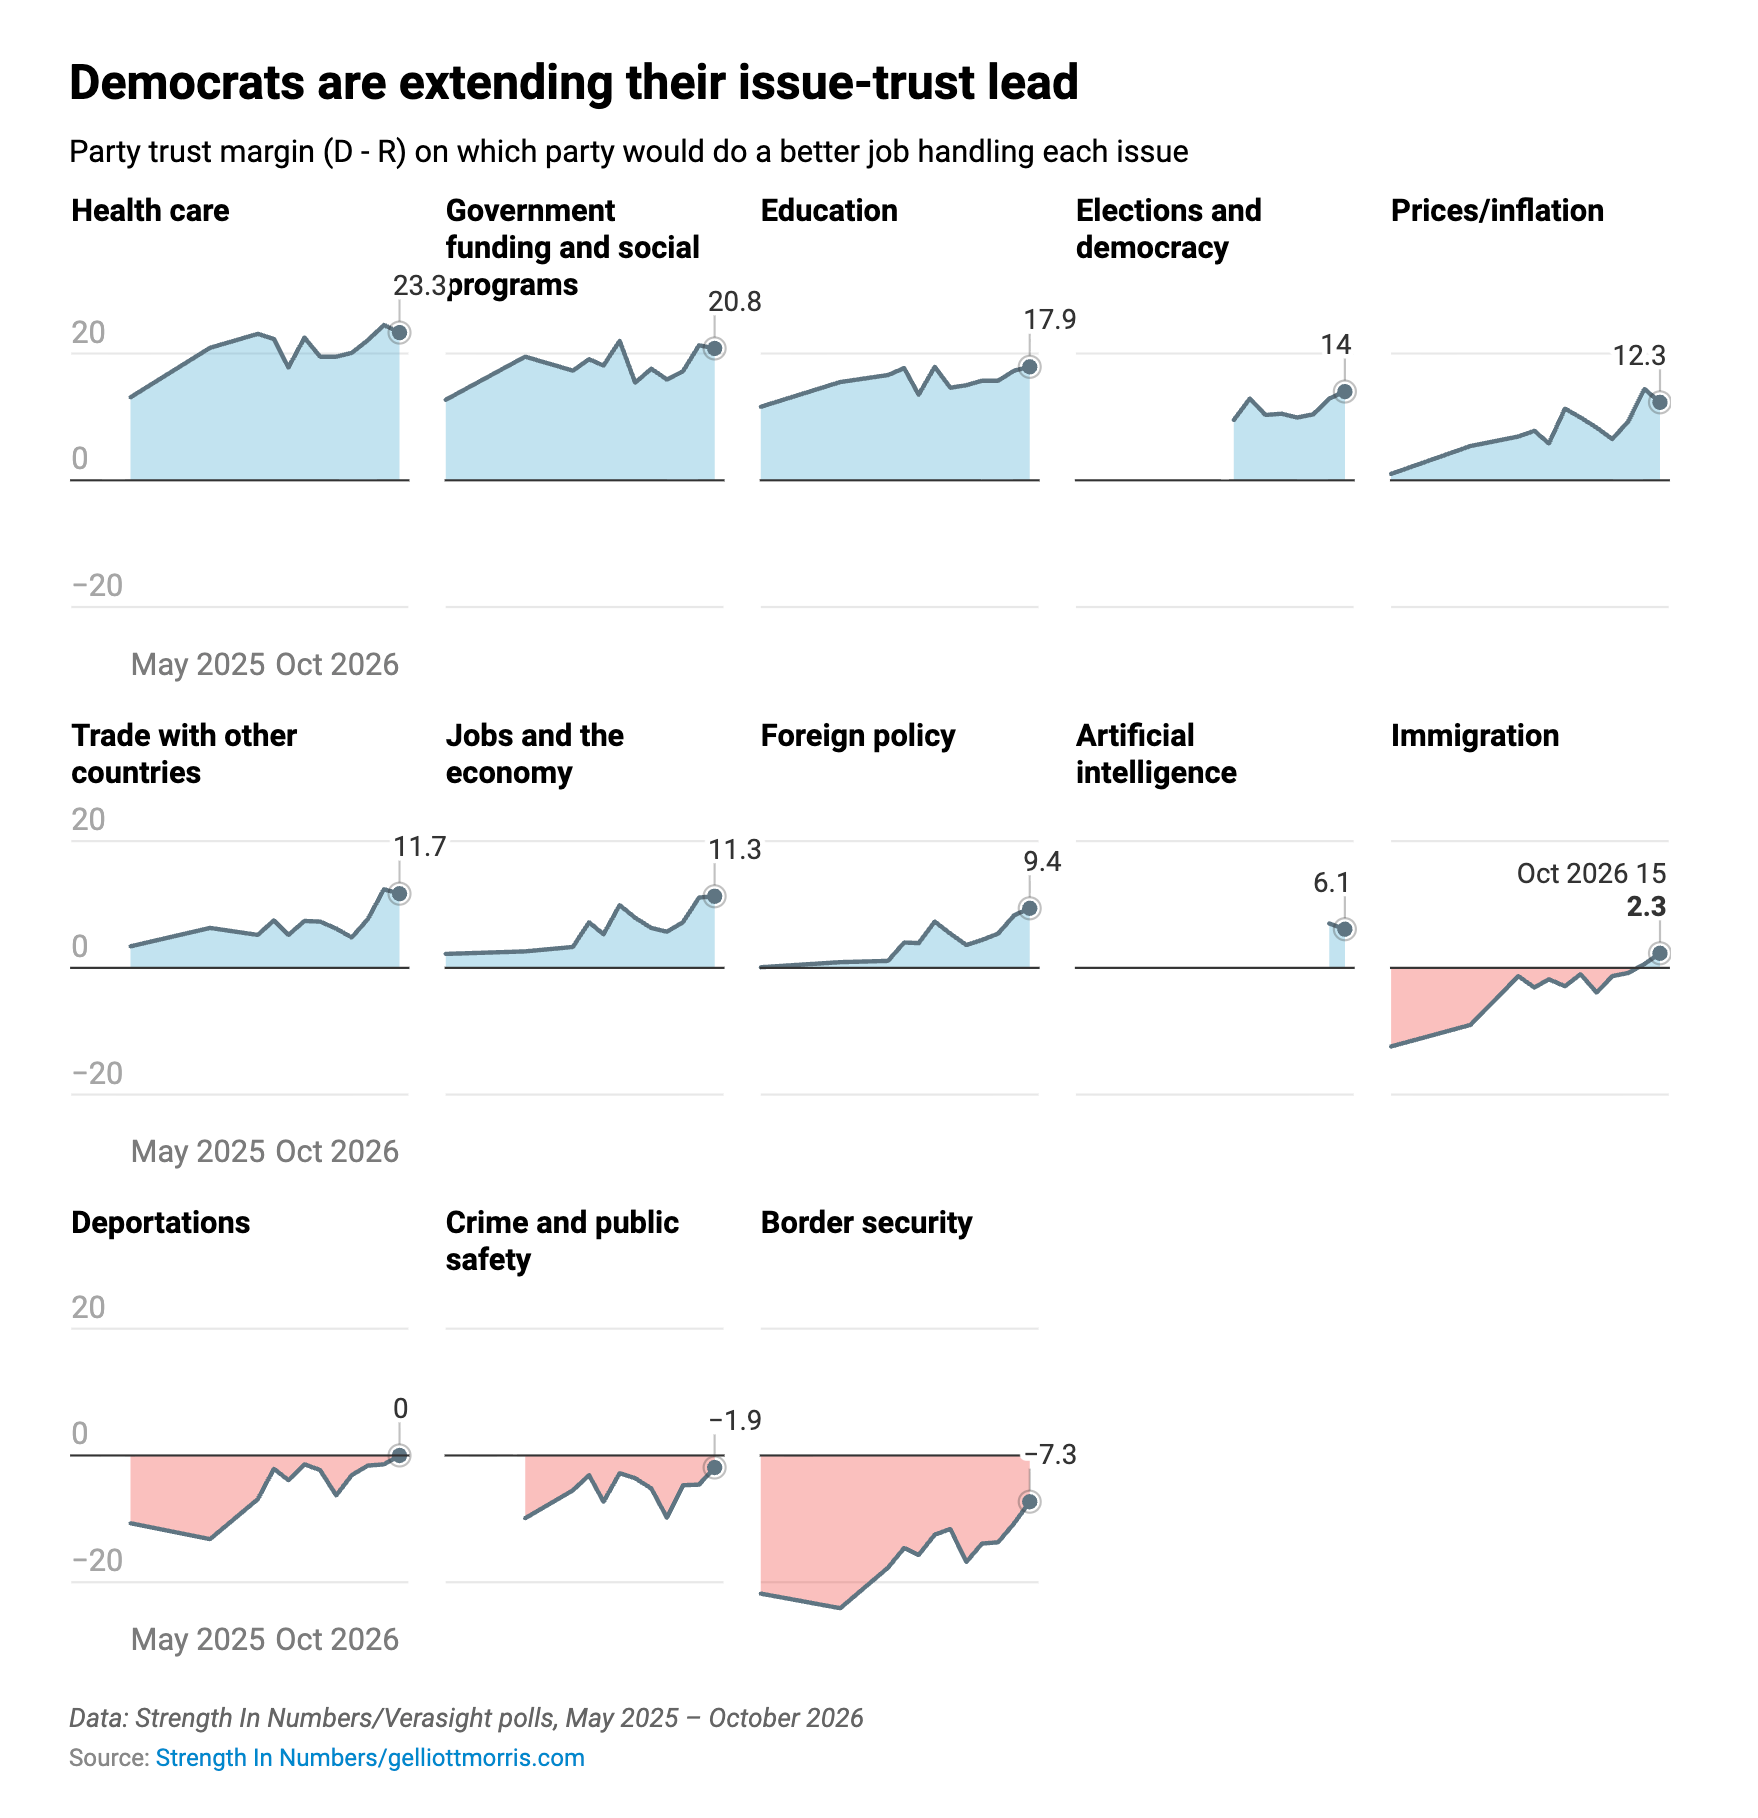
And covered how these numbers were hurting trust in the GOP to handle key policies:
And we asked a slew of questions about why Americans said they were going to vote the way they did, all of which are archived here. One question that comes to mind is that we found that 58% of adults said it’s more important to elect a Congress that acts as a check on President Donald Trump, versus just 25% who want one that helps him pass his agenda.
Additionally, in my election forecasting, I have continued to hew closer than others to the view that political science provides us with good tools for understanding the public and estimating their behavior. For example, in January I wrote that midterms were not referenda so much as backlash or “balancing” events. That matches up quite nicely with the question above. And the political science fundamentals served as a very good guide to this year’s midterms:
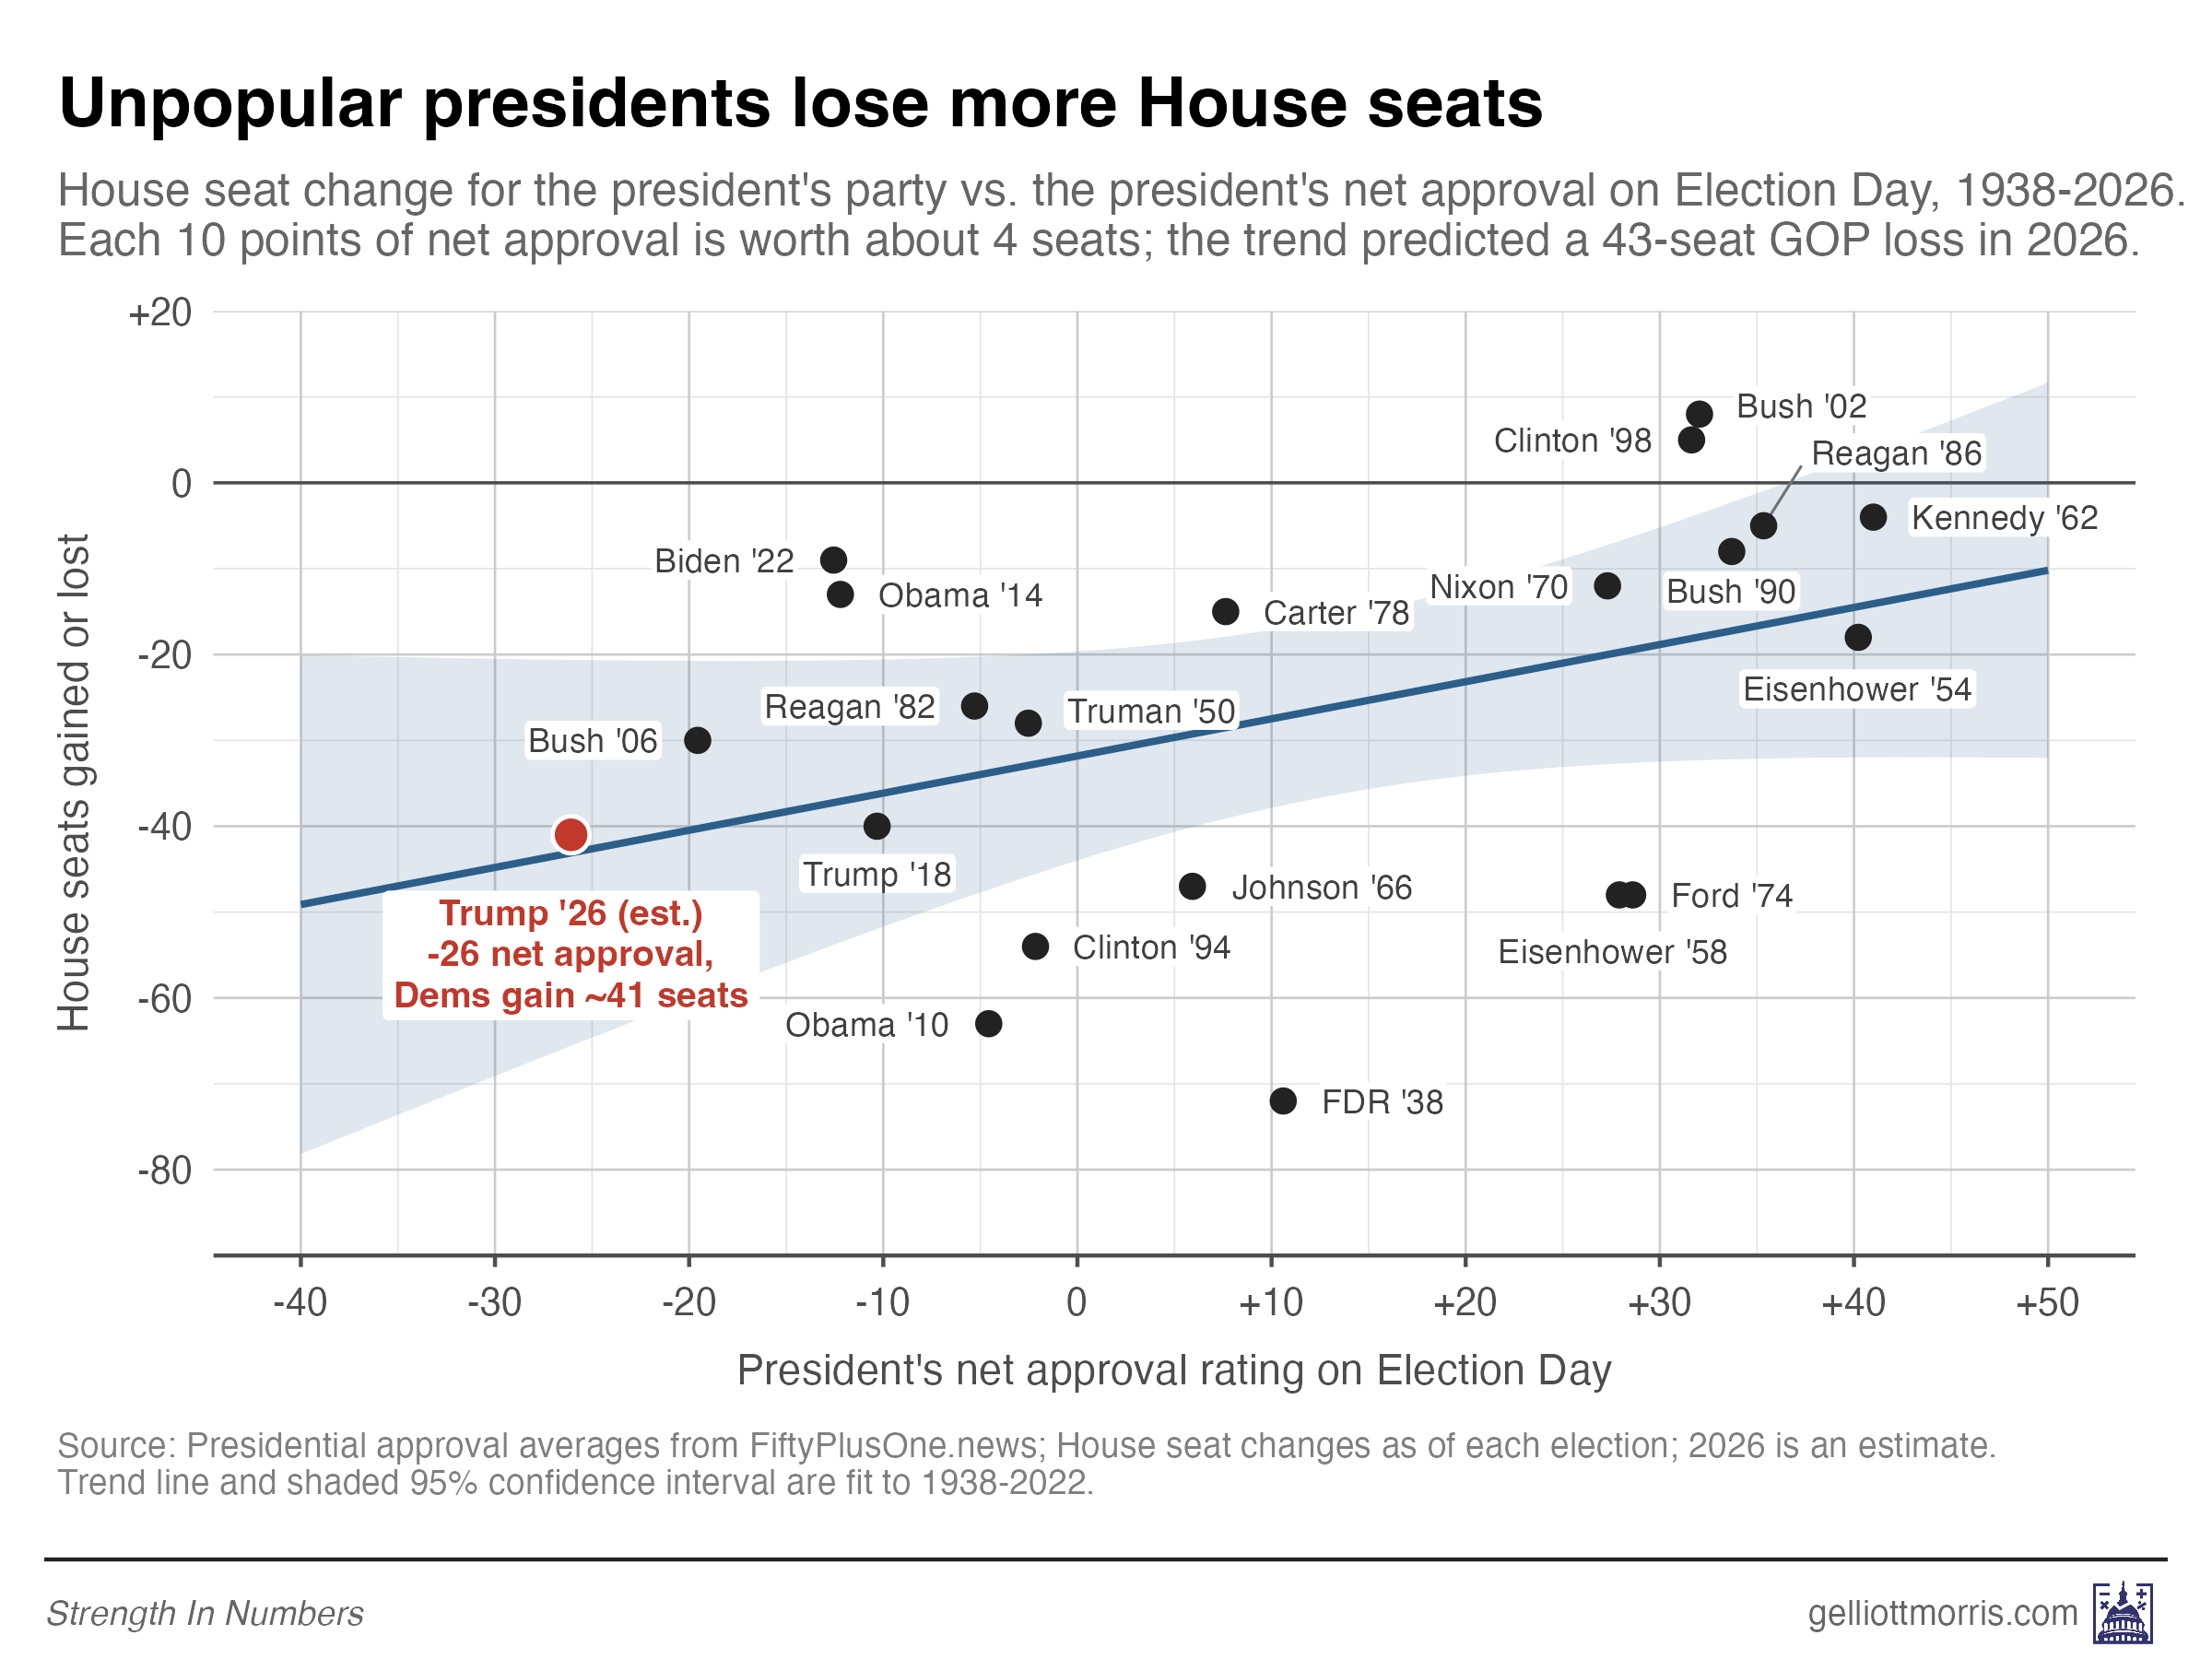
If you wanted to know, months ago, how the midterms were going to go, all you had to do was open this free interactive I published at projects.gelliottmorris.com and input Trump’s approval rating. It would have worked well for both the House and the Senate!


This worked despite some people being really unreasonable about it.
And SIN also took a lot of big swings on what pundits were getting wrong about the electorate. Last year I wrote about the premature hot take that was the “Trump realignment” discourse. And while journalists were busy over-interpreting the Democrats’ narrow defeat in 2024, I pointed out the truth: the party suffered in 2024 from an anti-incumbency bias that would have crushed its dreams regardless of who it nominated or what candidates said on certain policies. Furthermore, I showed that people didn’t understand how unpopular Trump was, and this was causing real harm to their businesses.
Strength In Numbers was not afraid to point out when the conventional wisdom about issues was wrong.
I used the results of our poll to build a new framework for understanding voters: not as people who mechanically occupy some stable position on a left-right ideological scale, but as people who were intensely anti-political and anti-system. The traditional model of understanding swing voters is just foolishly, catastrophically wrong. This turned out to be the key insight powering the campaigns of such successful figures as James Talarico in Texas, Jon Ossoff in Georgia, and Adam Hamilton in Kansas, the former of whom made it a slogan of his campaign that “the real divide in America is not left versus right, but top versus bottom.”
Finally, when the election came close, I penned a lot of analysis that turned out to be pretty darn predictive, if I do say so myself. Here is a collection of SIN greatest hits from this year:
"Are the polls overestimating Democrats again?“ (Aug. 21)
“The race raters are lowballing the Democrats” (Sept. 18)
“The polls might actually be underestimating Democrats” (Sept. 15)
“Likely voters lean more Democratic this cycle” (July 22)
“Democrats have a huge ‘engagement gap’” (Nov. 1)
“America is super polarized. That doesn’t prevent wave elections” (June 9).
The low-engagement voter thread: Feb. 12, Sept. 11, Oct. 23, Oct. 30, plus “No, higher turnout won’t fix the GOP’s Trump problem” (Apr. 28) and my “Trumpapalooza” piece (Sept. 9).
Texas: “Six data-driven reasons Texas could actually go blue” (Mar. 4), and my initial Talarico Toss-up call (when others were stuck with Texas as Likely Republican!) (June 2). If Talarico won, that’s three receipts.
Michigan: “Republicans are probably going to lose Michigan’s U.S. Senate race despite El-Sayed’s win” (Aug. 6).
And over the last two weeks, I have kept a meticulous live blog of early voting analysis that predicted the GOP drop-off in ballots — and culminated in today’s live blog covering what we could learn from early Election Day turnout.
I think the record here is really good, especially the post in August fighting against the poll unskewers. It was a bad idea in 2022, and a bad idea in 2026.
But before I do what you all expect me to do and throw up a bunch of charts that explain the Democrats’ historic win, I wanted to express my sincere gratitude for your support. Whether you are a free or paid reader of this publication, you are helping build a unique media publication devoted to democracy, data, and the idea that there is, ahem, strength in numbers. Frankly, I think this year has been an incredible validation of my approach to this new media company — but it’s only successful because 85,000+ people choose to read SIN daily, and because many of you help fund it. A special thanks to the paying members who keep the lights on.
Over the next year, SIN will be scaling up with more surveys and more tracking to monitor the pulse of American democracy. I’m planning several projects that will have unprecedented scale and granularity compared to past media partnerships. I will, of course, continue the weekly Deep Dive article and Thursday podcast with David — the latter of which is incredibly enjoyable and a great tool for community building.
That’s all to say… analysis will come tomorrow. But for now, I want you to know I’m truly grateful for each and every subscriber to this publication. And I look forward to building even more great things with you.
Well done, America. Exceptionally well done, Elliott. (Pleased to be a paid annual subscriber, and more upbeat about the democracy thing.)
Unless they are waffles you pore over them, not pour.